Thyroid Hormones T3 and T4 as Central Regulators of Basal Metabolic Rate: Molecular Mechanisms, Metabolic Integration, and Therapeutic Potential
Thyroid hormones (THs), thyroxine (T4) and triiodothyronine (T3), are primary determinants of mammalian basal metabolic rate (BMR), regulating energy expenditure, thermogenesis, and the metabolism of carbohydrates, lipids, and proteins across...
Thyroid Hormones T3 and T4 as Central Regulators of Basal Metabolic Rate: Molecular Mechanisms, Metabolic Integration, and Therapeutic Potential
Abstract
Thyroid hormones (THs), thyroxine (T4) and triiodothyronine (T3), are primary determinants of mammalian basal metabolic rate (BMR), regulating energy expenditure, thermogenesis, and the metabolism of carbohydrates, lipids, and proteins across multiple tissues. This article synthesizes foundational and contemporary research on the genomic and non-genomic mechanisms of TH action, exploring their cell-autonomous regulation via deiodinases and transporters. It further examines the pathological metabolic consequences of thyroid dysfunction in obesity, type 2 diabetes, and metabolic syndrome, and critically evaluates emerging therapeutic strategies, including TH receptor-beta selective agonists and the metabolite 3,5-T2, which aim to harness THs' metabolic benefits while mitigating cardiovascular risks. The content is tailored for researchers, scientists, and drug development professionals, providing a comprehensive framework for understanding THs' role in metabolic physiology and their potential as therapeutic targets.
The Fundamental Mechanisms: How Thyroid Hormones Govern Cellular Metabolism
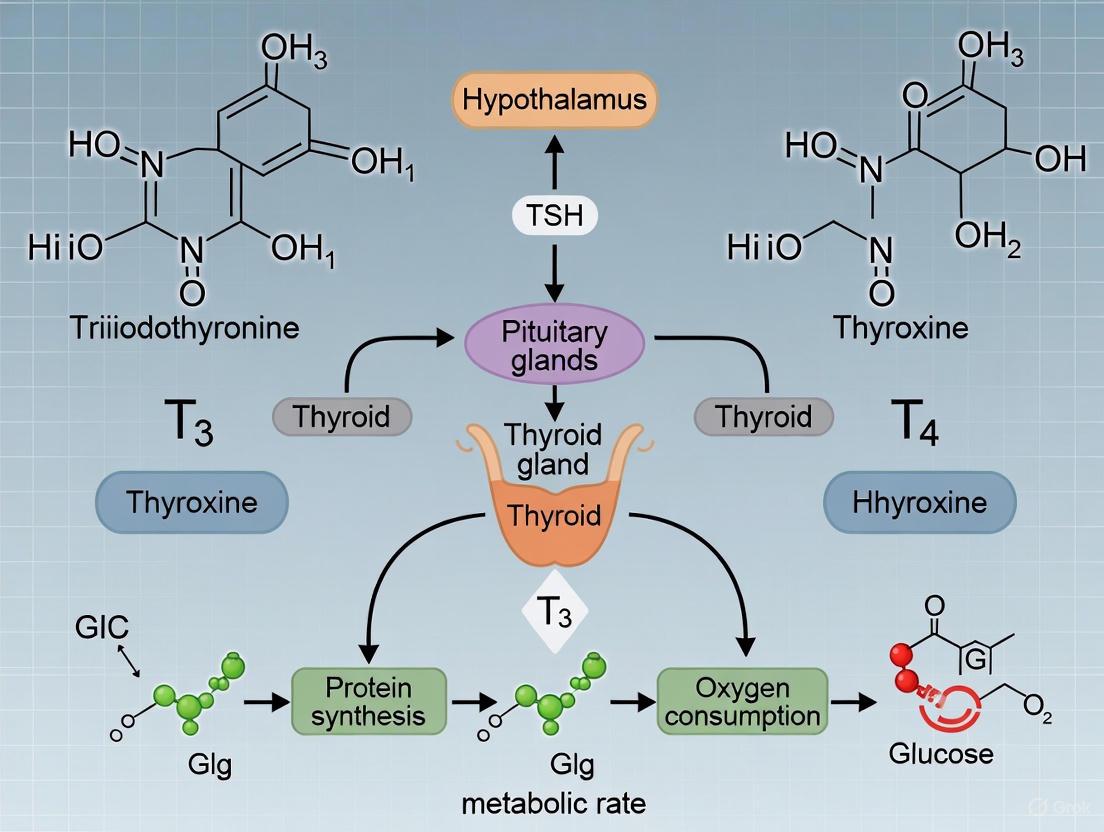
The hypothalamic-pituitary-thyroid (HPT) axis represents a critical neuroendocrine system responsible for the precise regulation of thyroid hormone (TH) synthesis, secretion, and systemic homeostasis. This sophisticated regulatory circuit integrates central neural signals with peripheral endocrine feedback to maintain metabolic stability across virtually all organ systems. Within the context of basal metabolic rate (BMR) research, the HPT axis serves as the principal determinant of metabolic set-point, with the active thyroid hormone triiodothyronine (T3) functioning as the primary effector molecule. This technical review comprehensively examines HPT axis physiology, TH signaling mechanisms, experimental methodologies for investigating thyroid function, and the intricate relationship between thyroid homeostasis and energy expenditure. Understanding these complex regulatory pathways provides fundamental insights for developing targeted therapeutic interventions for metabolic disorders.
Core Physiology of the HPT Axis
The hypothalamic-pituitary-thyroid axis operates as a classic neuroendocrine feedback system that maintains thyroid hormone concentrations within a narrow physiological range, thereby ensuring appropriate metabolic function throughout the body [1].
Hierarchical Hormonal Regulation
The HPT axis functions through a sequential hormonal cascade that originates in the central nervous system and culminates in thyroid hormone release from the peripheral thyroid gland:
- Hypothalamic Release: The neuroendocrine cascade initiates with hypothalamic secretion of thyrotropin-releasing hormone (TRH) from the paraventricular nucleus (PVN). TRH is synthesized as a preprohormone in the neuronal cell bodies of the PVN and transported to the median eminence, where it is released into the hypothalamic-hypophyseal portal system [2] [3].
- Pituitary Stimulation: Upon reaching the anterior pituitary gland, TRH binds to G-protein coupled receptors on thyrotropes, activating the phosphoinositide-specific phospholipase C (PLC) signal transduction pathway. This intracellular signaling cascade culminates in the synthesis and secretion of thyroid-stimulating hormone (TSH) [2].
- Thyroid Activation: TSH binds to TSH receptors (TSH-R) on the basolateral membrane of thyroid follicular cells, activating adenylyl cyclase and increasing intracellular cAMP levels via Gs-protein coupling. This stimulation triggers the five essential steps of thyroid hormonogenesis: thyroglobulin synthesis, iodide uptake, iodination of thyroglobulin, storage of iodinated thyroglobulin in follicular colloid, and proteolytic release of finished thyroid hormones [2].
Table 1: Key Hormones of the HPT Axis and Their Primary Functions
| Hormone | Origin | Primary Function | Regulatory Role |
|---|---|---|---|
| Thyrotropin-Releasing Hormone (TRH) | Hypothalamus | Stimulates TSH synthesis and release from anterior pituitary | Initiates HPT axis activation; regulated by negative feedback from TH |
| Thyroid-Stimulating Hormone (TSH) | Anterior Pituitary | Stimulates thyroid follicular cells to produce and release T4 and T3 | Primary regulator of thyroid gland function; sensitive to negative feedback |
| Thyroxine (T4) | Thyroid Gland | Prohormone; primary secretory product of thyroid | Circulating reservoir for active T3; provides negative feedback |
| Triiodothyronine (T3) | Thyroid Gland & Peripheral Tissues | Active hormone; binds to nuclear receptors | Primary mediator of TH effects on metabolism; potent negative feedback |
Feedback Control Mechanisms
The HPT axis maintains thyroid homeostasis through sophisticated negative feedback loops that precisely regulate hormone production:
- Long-Loop Feedback: Circulating T3 and T4 exert negative feedback inhibition at both pituitary and hypothalamic levels. The pituitary thyrotropes are particularly sensitive to free TH concentrations, with elevated levels suppressing TSH synthesis and secretion [1] [4].
- Short-Loop Feedback: TSH exerts feedback inhibition on hypothalamic TRH release, although this mechanism is less dominant than TH-mediated feedback [1].
- Ultra-Short Feedback: TRH can autoregulate its own secretion through local feedback mechanisms within the hypothalamus [1].
The feedback control system demonstrates hierarchical sensitivity, with the pituitary gland exhibiting greatest responsiveness to circulating TH levels, followed by hypothalamic centers. This tiered sensitivity allows for precise set-point regulation of thyroid function despite fluctuating metabolic demands [5] [1].
Diagram 1: Core HPT Axis Feedback Loop. This schematic illustrates the hierarchical structure and negative feedback regulation of the hypothalamic-pituitary-thyroid axis.
Thyroid Hormone Synthesis and Signaling Mechanisms
Biochemical Synthesis of Thyroid Hormones
The thyroid gland employs a unique biochemical pathway for hormone synthesis that requires specialized cellular machinery and the essential trace element iodine [2]:
- Thyroglobulin Production: Thyroid follicular cells (thyrocytes) synthesize thyroglobulin (Tg), a large glycoprotein precursor that serves as the scaffold for thyroid hormone synthesis. Tg is produced in the rough endoplasmic reticulum, processed through the Golgi apparatus, and packaged into vesicles for exocytosis into the follicular lumen [2].
- Iodide Transport and Oxidation: The Na+/I- symporter (NIS) actively transports iodide from the circulation into thyrocytes against a concentration gradient. Iodide then diffuses to the apical membrane and is transported into the colloid by pendrin transporters. At the colloid-thyrocyte interface, thyroid peroxidase (TPO) oxidizes iodide (I-) to iodine (I2) using hydrogen peroxide generated by NADPH oxidase [2].
- Organification and Coupling: TPO catalyzes the incorporation of oxidized iodine onto tyrosine residues within thyroglobulin, forming monoiodotyrosine (MIT) and diiodotyrosine (DIT). Subsequently, TPO mediates the coupling of iodinated tyrosine residues: MIT + DIT forms triiodothyronine (T3), while two DIT molecules form thyroxine (T4) [2].
- Storage and Release: The iodinated and coupled thyroglobulin is stored extracellularly in the follicular colloid until stimulated by TSH. Upon TSH stimulation, thyrocytes endocytose colloid, lysosomal enzymes proteolyze thyroglobulin, and free T4 (80%) and T3 (20%) are released into circulation via MCT8 transporters [2].
Table 2: Key Components of Thyroid Hormone Synthesis and Their Functions
| Component | Location | Function | Clinical/Research Significance |
|---|---|---|---|
| Sodium-Iodide Symporter (NIS) | Basolateral membrane of thyrocytes | Active transport of iodide into thyroid cells | Target for radioiodine imaging and therapy |
| Thyroid Peroxidase (TPO) | Apical membrane of thyrocytes | Oxidation, organification, and coupling reactions | Major autoantigen in autoimmune thyroid disease |
| Thyroglobulin (Tg) | Follicular colloid | Scaffold protein for thyroid hormone synthesis | Tumor marker for thyroid cancer recurrence |
| Monocarboxylate Transporter 8 (MCT8) | Basolateral membrane of thyrocytes | Cellular efflux of thyroid hormones | Mutations cause Allan-Herndon-Dudley syndrome |
Multimodal Signaling Pathways
Thyroid hormones exert their effects through multiple distinct signaling mechanisms that can be classified into four primary types based on receptor involvement and subcellular localization [6]:
- Type 1 Signaling (Canonical Genomic): This classical pathway involves binding of T3 to nuclear thyroid hormone receptors (TRs) that dimerize with retinoid X receptors (RXRs) and bind to thyroid response elements (TREs) in target gene promoters. The consensus TRE sequence is typically a direct repeat with a 4-nucleotide spacer (DR4): 5'(A/G)GG(A/T)CANNNN(A/G)GG(A/T)CA3' [6] [7]. Ligand binding induces conformational changes in TRs that facilitate coactivator recruitment (e.g., NCoA, SRC/p160 family) and displacement of corepressors (e.g., NCoR, SMRT), thereby modulating transcriptional activity [6].
- Type 2 Signaling (Noncanonical Genomic): In this variant genomic pathway, TRs indirectly associate with DNA through protein-protein interactions with other transcription factors (e.g., AP-1 complexes) without direct DNA binding. This tethering mechanism allows thyroid hormones to modulate gene expression at genomic sites lacking canonical TREs [6].
- Type 3 Signaling (Cytoplasmic TR-Mediated): Cytoplasmic TRs can participate in nongenomic signaling by interacting with kinase cascades, including the PI3K and MAPK pathways. The p30 protein, a truncated TRα1 translation product lacking the DNA-binding domain, has been implicated in these rapid membrane-initiated actions [6].
- Type 4 Signaling (TR-Independent): Some rapid thyroid hormone effects occur independently of classical TRs, potentially mediated by integrin αVβ3 membrane receptors or direct allosteric modulation of enzymatic activity (e.g., μ-crystallin) [6].
Diagram 2: Thyroid Hormone Signaling Pathways. This schematic classifies the four distinct mechanisms through which thyroid hormones mediate cellular effects.
Intracellular Activation and Metabolism
The biological activity of thyroid hormones is critically dependent on intracellular activation and metabolism that occurs primarily in peripheral tissues:
- Cellular Uptake: Thyroid hormones enter cells via specific transporter proteins, including monocarboxylate transporters (MCT8, MCT10) and organic anion transporting polypeptides (OATPs). MCT8 demonstrates particularly high affinity for T3 and shows tissue-specific expression patterns [3].
- Deiodination Pathways: The activation of thyroxine (T4) to the biologically active triiodothyronine (T3) is catalyzed by selenoenzyme deiodinases. Type 1 deiodinase (DIO1) in liver and kidney and type 2 deiodinase (DIO2) in brain, pituitary, brown adipose tissue, and skeletal muscle convert T4 to T3 [2] [3]. Type 3 deiodinase (DIO3) inactivates both T4 and T3 to reverse T3 (rT3) and T2, respectively, serving as a critical regulatory brake on thyroid hormone action [3].
- Receptor Binding and Isoform Specificity: Intracellular T3 binds with high affinity to nuclear thyroid hormone receptors (TRα1, TRβ1, TRβ2) which function as ligand-regulated transcription factors. TR isoforms display distinct tissue distributions: TRα1 predominates in skeletal muscle, heart, and brown adipose tissue, while TRβ1 is abundant in liver and kidney, and TRβ2 is primarily expressed in anterior pituitary and hypothalamus [7]. This isoform specificity enables tissue-selective responses to thyroid hormone.
Methodologies for Investigating HPT Axis Function
Standard Hormonal Assessments
Comprehensive evaluation of HPT axis function requires a multifaceted testing approach that interrogates different levels of the regulatory hierarchy:
- TSH Measurement: Serum thyroid-stimulating hormone (TSH) represents the most sensitive and specific marker of primary thyroid dysfunction. The log-linear relationship between TSH and free T4 allows detection of subtle perturbations in thyroid homeostasis [2] [1]. Current third-generation immunometric assays achieve functional sensitivities of approximately 0.01-0.02 mIU/L, enabling discrimination of thyrotoxic states [1].
- Thyroid Hormone Quantification: Free thyroxine (FT4) and free triiodothyronine (FT3) measurements provide assessment of biologically active hormone fractions, unaffected by variations in binding proteins. Equilibrium dialysis represents the gold standard methodology, though most clinical laboratories employ automated immunoassays with varying methodological limitations [2] [4].
- Dynamic Testing: TRH stimulation testing involves intravenous administration of synthetic TRH (200-500 μg) with serial TSH measurements at 0, 30, and 60 minutes. This protocol distinguishes pituitary (blunted response) from hypothalamic (delayed and prolonged response) causes of central hypothyroidism [5] [1].
Table 3: Standard Biochemical Assessment of Thyroid Function
| Parameter | Biological Significance | Reference Intervals | Interpretation Guidelines |
|---|---|---|---|
| TSH | Primary marker of HPT axis set-point | 0.4-4.0 mIU/L (adult) | Elevated in primary hypothyroidism; suppressed in hyperthyroidism |
| Free T4 | Bioactive thyroxine fraction | 0.8-2.0 ng/dL | Direct measure of thyroid secretory capacity |
| Free T3 | Bioactive triiodothyronine | 2.0-4.5 pg/mL | More sensitive marker of thyrotoxicosis |
| Reverse T3 | Metabolic inactivation product | 10-24 ng/dL | Elevated in nonthyroidal illness syndrome |
| Thyroglobulin | Thyroid tissue marker | 1.5-30 ng/mL | Monitoring for thyroid cancer recurrence |
| Thyroid Antibodies | Autoimmune activity | TPOAb <35 IU/mL; TgAb <20 IU/mL | Diagnostic for autoimmune thyroid disease |
Experimental Protocols for BMR Research
Investigation of thyroid hormone effects on basal metabolic rate requires carefully controlled experimental conditions and precise measurement methodologies:
- Indirect Calorimetry Protocol: The gold standard for assessing energy expenditure involves measurement of oxygen consumption (VO2) and carbon dioxide production (VCO2) using closed-circuit respirometry systems. The experimental workflow includes:
- Acclimation Period: Animals or human subjects acclimatize to metabolic chambers for 2-4 hours prior to data collection to minimize stress artifacts.
- Environmental Control: Maintain thermoneutral temperature (28-30°C for mice; 22-24°C for humans) to eliminate thermoregulatory energy expenditure.
- Fasting State: Conduct measurements after 4-6 hour fast to eliminate diet-induced thermogenesis.
- Data Collection: Record VO2 and VCO2 at 1-minute intervals for 2-4 hours during inactive circadian phase.
- Calculation: Compute BMR using Weir equation: BMR (kcal/day) = [3.9(VO2) + 1.1(VCO2)] × 1.44 [3].
- Tissue-Specific Metabolic Assessment: For investigation of organ-level contributions to energy expenditure:
- Tissue Explants: Isolate fresh tissues (liver, skeletal muscle, brown adipose tissue) and maintain in oxygenated Krebs-Ringer buffer.
- Ex Vivo Respiration: Measure oxygen consumption using Clark-type oxygen electrodes or Seahorse extracellular flux analyzers.
- Substrate Utilization: Assess fuel preference by modifying substrate availability (glucose, fatty acids, pyruvate) in assay media.
- Mitochondrial Isolation: Fractionate mitochondrial fractions by differential centrifugation for direct assessment of mitochondrial function [3].
- Molecular Analysis of Thermogenic Pathways:
- RNA Isolation and qPCR: Extract total RNA from target tissues using guanidinium thiocyanate-phenol-chloroform extraction. Perform quantitative PCR for UCP1, DIO2, PGC-1α, and other thermogenic markers.
- Western Blot Analysis: Resolve tissue lysates by SDS-PAGE, transfer to membranes, and probe with specific antibodies against thyroid hormone receptors, deiodinases, and mitochondrial proteins.
- Chromatin Immunoprecipitation: Crosslink proteins to DNA with formaldehyde, immunoprecipitate TR-bound chromatin fragments, and quantify enrichment at target gene promoters [3] [6].
Diagram 3: Experimental Workflow for BMR Assessment. This flowchart outlines the sequential steps for precise measurement of basal metabolic rate in thyroid research.
The Scientist's Toolkit: Essential Research Reagents
Table 4: Key Research Reagents for Investigating Thyroid Hormone Action
| Reagent/Category | Specific Examples | Research Application | Technical Considerations |
|---|---|---|---|
| Thyroid Hormone Receptor Agonists/Antagonists | GC-1 (TRβ-selective), KB-141 (TRβ-selective), DITPA (cardiac-selective) | Isoform-specific functional studies | Selectivity profiles must be verified in specific experimental systems |
| Deiodinase Inhibitors | Iopanoic acid (nonselective), Gold thioglucose (DIO1 inhibitor) | Modulation of local T3 availability | Vary in specificity and potency across deiodinase isoforms |
| Transport Inhibitors | Silychristin (MCT8 inhibitor), BSP (OATP inhibitor) | Study of cellular TH uptake | Limited isoform specificity for many available compounds |
| Antibodies for Protein Detection | Anti-TRα, Anti-TRβ, Anti-DIO2, Anti-UCP1 | Western blot, immunohistochemistry, ChIP | Validation in knockout models essential for specificity confirmation |
| ELISA/Kits | TSH ELISA, Total T4/T3 ELISA, Free T4/T3 ELISA, rT3 ELISA | Hormone quantification | Method-dependent variations in accuracy, particularly for free hormone assays |
| Molecular Biology Tools | TRE reporter constructs, TR expression plasmids, siRNA/shRNA libraries | Gene regulation studies | Careful titration required to avoid overexpression artifacts |
| Animal Models | TRα/- and TRβ-/- mice, MCT8-deficient mice, DIO2-/- mice | In vivo functional studies | Compensation during development may complicate interpretation |
Thyroid Hormone Regulation of Basal Metabolic Rate
Central Regulation of Energy Homeostasis
The hypothalamus serves as the primary integration center for metabolic signals that modulate HPT axis function and thereby influence systemic energy expenditure:
- Tanycyte-Mediated Regulation: Specialized ependymal cells (tanycytes) lining the third ventricle express high levels of DIO2, converting T4 to active T3 for paracrine signaling to TRH neurons in the paraventricular nucleus. This local T3 production establishes a critical interface between circulating thyroid hormones and central regulation of metabolism [3].
- Nutrient-Sensing Pathways: Hypothalamic nutrient sensing integrates signals from circulating hormones (leptin, ghrelin, insulin) and nutrients to modulate HPT axis activity. During fasting, reduced leptin signaling and elevated AgRP/NPY activity suppress TRH expression, consequently decreasing HPT axis activity and reducing energy expenditure as an adaptive response to negative energy balance [3].
- Autonomic Nervous System Integration: Thyroid hormones modulate sympathetic outflow to peripheral metabolic tissues, particularly brown adipose tissue. T3 acts in the ventromedial hypothalamus to increase BAT sympathetic nerve activity, thereby stimulating thermogenesis through β-adrenergic receptor activation and UCP1-mediated uncoupling of mitochondrial respiration [3].
Peripheral Mechanisms of Metabolic Regulation
Thyroid hormones exert direct effects on multiple peripheral tissues to coordinate systemic energy expenditure:
- Mitochondrial Biogenesis and Function: T3 stimulates mitochondrial biogenesis through upregulation of PGC-1α and nuclear respiratory factors (NRF-1, NRF-2). Additionally, T3 regulates mitochondrial oxidative capacity by inducing nuclear-encoded mitochondrial enzyme genes, including components of the electron transport chain and fatty acid β-oxidation pathway [2] [3].
- Substrate Cycling: Thyroid hormones coordinate substrate utilization through tissue-specific mechanisms:
- Hepatic Metabolism: T3 increases hepatic glucose production through induction of gluconeogenic enzymes (glucose-6-phosphatase, phosphoenolpyruvate carboxykinase) and enhances fatty acid oxidation while simultaneously promoting de novo lipogenesis [3] [7].
- Skeletal Muscle: T3 shifts muscle fiber composition toward faster contractile properties, increases glucose uptake through GLUT4 translocation, and enhances fatty acid oxidation capacity [2].
- Adipose Tissue: In white adipose tissue, T3 promotes lipolysis and reduces lipid storage capacity. In brown adipose tissue, T3 synergizes with sympathetic signaling to induce UCP1 expression and thermogenic capacity [3].
- Cardiac Output Modulation: Thyroid hormones increase cardiac contractility, heart rate, and stroke volume through combined effects on ion channel expression (SERCA, Na+/K+ ATPase), β-adrenergic receptor density, and myocardial energy metabolism, thereby enhancing circulatory support for increased metabolic demand [2].
Pathophysiological Considerations in Metabolic Regulation
Alterations in HPT axis function produce characteristic metabolic phenotypes that illustrate the critical role of thyroid hormones in energy homeostasis:
- Hypothyroidism: The metabolic hallmarks of thyroid hormone deficiency include reduced basal metabolic rate (decreased by up to 50% in severe cases), decreased thermogenesis, weight gain despite reduced appetite, hyperlipidemia, and insulin resistance in muscle and adipose tissue [2] [4].
- Hyperthyroidism: Thyroid hormone excess produces a hypermetabolic state characterized by increased BMR (elevated by 30-100%), enhanced thermogenesis, weight loss despite increased appetite, insulin resistance with increased hepatic glucose production, and increased lipid mobilization [2] [7].
- Non-Thyroidal Illness Syndrome: During systemic illness, proinflammatory cytokines suppress HPT axis function through reduced TRH secretion, altered deiodinase activity (decreased DIO1, increased DIO3), and reduced thyroid hormone binding proteins, resulting in a low T3 state that may represent an adaptive energy conservation mechanism [5] [1].
Emerging Research Directions and Therapeutic Implications
Novel Regulatory Mechanisms
Recent research has revealed previously unappreciated dimensions of thyroid homeostasis that expand our understanding of HPT axis regulation:
- Microbiota-Thyroid Axis: The gut microbiota composition influences thyroid hormone homeostasis through several mechanisms, including modification of enterohepatic cycling of thyroid hormones, conversion of iodide to iodine, generation of short-chain fatty acids that modulate deiodinase activity, and regulation of systemic inflammation that impacts HPT axis function [8].
- Immune System Interactions: Pattern recognition receptors (e.g., NOD1) respond to microbial components and influence thyroid hormone function through immune system activation. NOD1-dependent signaling pathways have been demonstrated to alter thyroid hormone metabolism and contribute to obesity phenotypes in experimental models [8].
- Allostatic Regulation: The HPT axis demonstrates adaptive plasticity in its set-point regulation under conditions of chronic stress, circadian disruption, and metabolic challenge. This allostatic regulation involves complex integration of signals from other neuroendocrine systems, including the hypothalamic-pituitary-adrenal axis and reproductive axis [1].
Therapeutic Applications and Drug Development
Understanding the molecular mechanisms of thyroid hormone action provides opportunities for targeted therapeutic interventions:
- TRβ-Selective Agonists: Compounds with selective affinity for TRβ receptors (e.g., eprotirome, resmetirom) demonstrate beneficial metabolic effects on lipid metabolism and body weight with reduced cardiac and bone side effects, representing promising approaches for treating dyslipidemia and NASH [7].
- Central Thyroid Hormone Modulation: Strategies targeting hypothalamic deiodinase activity or TRH expression may permit fine-tuning of metabolic rate without producing peripheral thyrotoxicosis, potentially offering novel approaches for obesity management [3].
- Mitochondrial-Targeted Approaches: Compounds that recapitulate the mitochondrial effects of thyroid hormones without genomic actions could enhance oxidative metabolism while minimizing adverse effects, representing an emerging frontier in metabolic therapeutics [3] [6].
The hypothalamic-pituitary-thyroid axis represents a sophisticated regulatory system that maintains thyroid hormone homeostasis through integrated feedback mechanisms operating at multiple levels. The active thyroid hormone T3 serves as the primary determinant of basal metabolic rate through complex actions involving both central regulation in the hypothalamus and direct effects on peripheral tissues including liver, skeletal muscle, adipose tissue, and cardiovascular system. The continuing elucidation of thyroid hormone signaling pathways—from canonical genomic actions to rapid nongenomic effects—provides increasingly sophisticated insights into the molecular basis of metabolic regulation. Contemporary research approaches employing selective pharmacological agents, genetically modified animal models, and advanced metabolic phenotyping techniques continue to refine our understanding of thyroid physiology and identify novel therapeutic targets for metabolic disorders. As research progresses, the integration of thyroid hormone biology with systems physiology perspectives including microbiome interactions, immune regulation, and allostatic load will likely yield transformative insights into the role of the HPT axis in human health and disease.
The regulation of basal metabolic rate (BMR) is a complex process orchestrated by numerous hormonal signals, with thyroid hormones (THs), triiodothyronine (T3) and thyroxine (T4), serving as primary determinants. While the endocrine system maintains circulating TH levels, their metabolic effects are ultimately determined by intracellular concentrations of bioactive T3 in peripheral tissues. This tissue-specific regulation is governed by two critical protein families: plasma membrane transporters, including monocarboxylate transporters (MCT8 and MCT10), and deiodinase enzymes (DIO1, DIO2, DIO3). These components collectively control the cellular uptake and activation of thyroid hormones, forming a crucial regulatory layer that modulates metabolic rate, thermogenesis, and energy expenditure [9] [10]. Understanding these mechanisms is paramount for developing targeted therapies for metabolic disorders, as fine-tuning thyroid hormone action at the tissue level could address pathologies like obesity and diabetes without disrupting systemic thyroid status [11] [10].
The coordinated action of transporters and deiodinases enables individual tissues to customize their metabolic response according to local physiological demands. This prereceptor regulation of thyroid hormone signaling represents a sophisticated mechanism that explains how tissues can exhibit different degrees of thyromimetic effects despite similar circulating hormone levels [12]. For researchers investigating BMR, this intricate regulatory system underscores the limitation of relying solely on serum thyroid profiles and emphasizes the need to assess tissue-specific thyroid status.
Thyroid Hormone Transporters: Gatekeepers of Cellular Access
For decades, the lipophilic nature of thyroid hormones led to the presumption that they passively diffused across plasma membranes. However, extensive research has established that carrier-mediated transport represents the primary mechanism for cellular thyroid hormone uptake [9]. This discovery revealed a previously unappreciated layer of regulation in thyroid hormone action, with several transporter families now recognized for their roles in this process.
Key Transporters and Their Characteristics
The monocarboxylate transporters MCT8 and MCT10, along with the organic anion-transporting polypeptide OATP1C1, represent the most specific and physiologically significant thyroid hormone transporters identified to date.
Table 1: Characteristics of Major Human Thyroid Hormone Transporters
| Gene | Transporter | Chromosome | Tissue Distribution | Substrate Preference | Functional Notes |
|---|---|---|---|---|---|
| SLC16A2 | MCT8 | Xq13.2 | Brain, liver, kidney, heart, thyroid | T4, T3, rT3 | Most specific TH transporter; mutations cause Allan-Herndon-Dudley syndrome |
| SLC16A10 | MCT10 | 16q21-q22 | Multiple tissues | T3 > T4 | Also transports aromatic amino acids; bidirectional transport |
| SLCO1C1 | OATP1C1 | 12p12 | Brain (astrocytes), testis | T4 > T3, rT3 | Almost exclusive T4 uptake in human brain astrocytes |
MCT8, encoded by the SLC16A2 gene on the X chromosome, exhibits high specificity for iodothyronines without transporting traditional monocarboxylates [9] [13]. The physiological criticality of MCT8 is dramatically illustrated in patients with Allan-Herndon-Dudley syndrome (AHDS), an X-linked disorder characterized by severe psychomotor retardation and abnormal thyroid hormone levels, resulting from mutations in the MCT8 gene [9] [14]. These patients present a unique thyroid profile with elevated serum T3, reduced T4, and normal or slightly elevated TSH, reflecting the complex role of MCT8 in both central and peripheral thyroid hormone homeostasis [15] [14].
MCT10 shares significant sequence homology with MCT8 (49% identity) but displays distinct functional characteristics [15]. While both transport thyroid hormones, MCT10 exhibits preferential transport of T3 over T4 and also functions as an aromatic amino acid transporter [9] [13]. Recent structural analyses reveal that despite their similarities, MCT8 and MCT10 exhibit distinct thyroid hormone recognition patterns that confer their substrate specificity [14].
OATP1C1 demonstrates a marked preference for T4 over T3 and is expressed almost exclusively in the brain and testis [9]. In human brain, OATP1C1 is predominantly localized to astrocytes rather than capillary endothelial cells, suggesting its primary role involves T4 uptake into astrocytes for subsequent conversion to T3 by type 2 deiodinase (DIO2) [9] [14]. This cellular compartmentalization highlights the sophisticated division of labor in cerebral thyroid hormone metabolism.
Structural Insights and Transport Mechanisms
Recent cryogenic-electron microscopy (cryo-EM) studies have provided unprecedented structural insights into thyroid hormone transport mechanisms. Both MCT8 and MCT10 belong to the major facilitator superfamily (MFS) and display the classical bilobed architecture consisting of N-terminal and C-terminal domains, each comprising six transmembrane helices [15] [14].
Table 2: Structural and Biophysical Properties of MCT8 and MCT10
| Parameter | MCT8 | MCT10 |
|---|---|---|
| Thyroxine (T4) Affinity (Kd) | 8.9 µM | 8.9 µM |
| Triiodothyronine (T3) Affinity (Kd) | 25.2 µM | 10.7 µM |
| TRIAC Affinity (Kd) | 20 µM | 19 µM |
| Silychristin Affinity (Kd) | 44.5-56.9 nM | >75 µM |
| Transport Mechanism | Facilitated diffusion | Facilitated diffusion |
Structural analyses of MCT8 in both outward-facing and inward-facing states have revealed a conserved network of gate residues involved in conformational changes triggered by thyroxine binding [15]. The T4 carboxylic group forms a salt bridge with Arg371 in MCT8 (Arg343 in MCT10), while the iodinated aromatic rings nestle within a highly hydrophobic pocket [15]. The transport cycle involves subtle conformational changes where transmembrane helix 7 kinks upon substrate binding, bringing Tyr339 closer to Asn119 on the opposite N-terminal domain and thereby occluding the gate [15].
The structural basis for inhibitor specificity has also been elucidated. The flavonolignan silychristin binds MCT8 with nanomolar affinity (Kd = 44.5-56.9 nM), locking it in an outward-facing state, while exhibiting minimal interaction with MCT10 (Kd > 75 µM) [15]. This specificity arises from distinct structural features in their substrate-binding pockets, providing a foundation for developing targeted therapeutic agents.
Deiodinases: Masters of Intracellular Thyroid Hormone Activation
Once inside cells, thyroid hormones undergo critical metabolic transformations catalyzed by the selenocysteine-containing deiodinase enzymes. This enzyme family precisely controls the activation and inactivation of thyroid hormones in a tissue-specific and developmentally regulated manner, serving as a crucial determinant of intracellular thyroid status [16] [12].
Deiodinase Types, Functions, and Distribution
The three deiodinase isoforms (DIO1, DIO2, DIO3) coordinate to maintain tissue-specific thyroid hormone homeostasis through their complementary actions on hormone activation and inactivation.
Table 3: Characteristics of Human Deiodinase Enzymes
| Enzyme | Gene | Primary Action | Cellular Location | Tissue Distribution | Kinetics | Sensitivity to PTU |
|---|---|---|---|---|---|---|
| DIO1 | DIO1 | Activation & Inactivation | Plasma Membrane | Liver, kidney, thyroid | Ping-pong (Km µM) | High |
| DIO2 | DIO2 | Activation | Endoplasmic Reticulum | Brain, pituitary, brown fat, skeletal muscle | Sequential (Km nM) | Low |
| DIO3 | DIO3 | Inactivation | Plasma Membrane | Brain, placenta, skin, fetal tissues | Sequential (Km nM) | Low |
DIO1 exhibits both outer and inner ring deiodinase activity, enabling it to contribute to both T3 production (from T4) and hormone inactivation [16] [17]. It primarily generates T3 for export to plasma, with its activity in liver and kidney significantly contributing to circulating T3 levels [17]. DIO1 follows ping-pong kinetics and is highly sensitive to inhibition by propylthiouracil (PTU) [16].
DIO2 functions predominantly as an activating enzyme, converting T4 to T3 via outer ring deiodination [16] [12]. With a nanomolar Km for T4, DIO2 is optimized for efficient T3 production even at low substrate concentrations. Its location in the endoplasmic reticulum positions it ideally for providing T3 directly to the nucleus [16]. DIO2 is regulated at both transcriptional and posttranslational levels, with T4 inducing its degradation via the ubiquitin-proteasome pathway [16].
DIO3 exclusively catalyzes inner ring deiodination, inactivating both T4 and T3 to reverse T3 and T2, respectively [16] [17]. It is highly expressed in placental and fetal tissues, protecting developing tissues from excessive thyroid hormone exposure [12] [17]. Interestingly, DIO3 is rapidly internalized via endosomes and recycled back to the cell surface, suggesting its catalytic activity may occur in both extracellular and intracellular compartments [16].
Regulatory Mechanisms and Metabolic Significance
Deiodinase activities are dynamically regulated according to developmental stage, physiological demands, and pathological conditions. During critical periods such as fetal development, the coordinated expression of DIO2 and DIO3 ensures precise spatial and temporal control of thyroid hormone signaling [12]. In metabolic regulation, DIO2 plays a particularly important role in adaptive thermogenesis through its expression in brown adipose tissue (BAT) and skeletal muscle [10].
The deiodinases represent a dynamic system that permits tissues to customize their intracellular T3 concentration according to local physiological requirements, independently of circulating thyroid hormone levels [12]. This local control mechanism enables tissues to fine-tune their metabolic response to thyroid hormone without perturbing systemic homeostasis.
Experimental Approaches and Methodologies
Cellular Transport Assays
Thyroid Hormone Uptake Measurements:
- Cell Culture: HeLa or other appropriate cell lines are cultured in standard DMEM medium supplemented with 10% fetal bovine serum.
- Transporter Expression: Cells are transfected with plasmid DNA encoding the thyroid hormone transporter (MCT8, MCT10, or OATP1C1) using lipid-based transfection reagents. Empty vector serves as negative control.
- Transport Assay: 48 hours post-transfection, cells are incubated with radiolabeled [125I]-T4 or [125I]-T3 (specific activity: 4400 μCi/μg) in uptake buffer (e.g., Hanks' Balanced Salt Solution) for predetermined time points (typically 5-60 minutes).
- Inhibition Studies: To assess transporter specificity, parallel experiments are conducted with specific inhibitors (e.g., 100 μM silychristin for MCT8) or excess unlabeled substrate.
- Termination and Measurement: Uptake is terminated by rapid ice-cold wash buffer. Cells are lysed with 0.1N NaOH, and radioactivity is quantified using a gamma counter.
- Data Analysis: Specific transport is calculated by subtracting nonspecific uptake (vector control) from total uptake. Kinetic parameters (Km, Vmax) are determined through nonlinear regression analysis of concentration-dependent uptake [15] [14].
Deiodinase Activity Assays
Enzyme Kinetic Characterization:
- Tissue Preparation: Target tissues (liver for DIO1, brain for DIO2, placenta for DIO3) are homogenized in appropriate buffer (e.g., 0.25 M sucrose, 20 mM HEPES, pH 7.0).
- Reaction Setup: Homogenates are incubated with radiolabeled substrate ([125I]-rT3 for DIO1, [125I]-T4 for DIO2/DIO3) in the presence of cofactors (5-20 mM dithiothreitol) and potential inhibitors (1 mM PTU for DIO1 specificity).
- Reaction Termination: After appropriate incubation time (30-60 minutes at 37°C), reactions are stopped by adding ice-cold ethanol.
- Product Separation: Deiodinated products are separated from substrate using HPLC or paper chromatography.
- Quantification: Radioactivity in product fractions is measured, and enzyme activity is calculated as pmol of substrate deiodinated per mg protein per minute [16] [17].
Structural Biology Approaches
Cryo-EM Structure Determination:
- Protein Engineering: MCT8 or OATP1C1 is engineered with N-terminal FLAG tag and C-terminal ALFA tag to facilitate purification and improve particle orientation.
- Expression and Purification: Proteins are overexpressed in HeLa cells, solubilized in detergent (e.g., glyco-diosgenin), and purified using anti-FLAG affinity chromatography.
- Complex Formation: Purified transporters are complexed with anti-ALFA nanobody and reconstituted in amphipols to improve stability and distribution.
- Grid Preparation: Samples are applied to cryo-EM grids, vitrified using liquid ethane, and screened for optimal ice thickness and particle distribution.
- Data Collection: High-resolution movies are collected using modern cryo-EM systems (e.g., Titan Krios) with dose-fractionation mode.
- Image Processing: Motion-corrected micrographs undergo particle picking, 2D classification, ab initio reconstruction, and nonuniform refinement to generate high-resolution density maps.
- Model Building: Atomic models are built and refined into cryo-EM maps using iterative cycles of manual building in Coot and refinement in Phenix [15] [14].
Table 4: Research Reagent Solutions for Thyroid Hormone Transport and Metabolism Studies
| Reagent/Category | Specific Examples | Function/Application |
|---|---|---|
| Cell Lines | HeLa, HEK293, JEG-3 | Heterologous expression systems for transporter and deiodinase studies |
| Expression Vectors | pcDNA3.1, pEGFP vectors | Mammalian expression of tagged transporters (FLAG, ALFA tags) |
| Radiolabeled Compounds | [125I]-T4, [125I]-T3, [125I]-rT3 | Quantitative transport and enzyme activity measurements |
| Chemical Inhibitors | Silychristin (MCT8-specific), PTU (DIO1 inhibitor) | Mechanistic studies and pathway dissection |
| Antibodies | Anti-FLAG, Anti-HA, Na+/K+-ATPase | Protein detection, localization, and purification |
| Structural Biology Tools | Anti-ALFA nanobody, Amphipols | Cryo-EM sample preparation and structure determination |
| Analytical Instruments | Gamma counters, HPLC systems, Cryo-EM systems | Quantitative analysis and structural characterization |
Integrated Pathway and Experimental Workflow
Diagram 1: Integrated experimental workflow for studying thyroid hormone transporters and deiodinases, showing the parallel approaches in transport studies, structural biology, and enzyme characterization that converge to provide comprehensive mechanistic insights.
Diagram 2: Integrated pathway of thyroid hormone transport and metabolism, illustrating how transporters and deiodinases coordinate to regulate the cellular availability of active T3 for metabolic regulation.
The intricate interplay between thyroid hormone transporters and deiodinases represents a sophisticated regulatory system that tailors thyroid hormone action at the tissue level. This prereceptor control mechanism enables individual tissues to fine-tune their metabolic response according to local physiological demands, providing a crucial interface between systemic thyroid status and cellular metabolism. For researchers investigating basal metabolic rate, this system explains how tissues can exhibit varying degrees of metabolic responsiveness to similar circulating hormone levels and offers potential targets for metabolic interventions.
Recent structural breakthroughs in understanding MCT8 and OATP1C1 function provide unprecedented opportunities for rational drug design. The discovery of allosteric regulatory sites on these transporters, coupled with detailed mechanistic insights into deiodinase regulation, opens new avenues for developing tissue-selective thyroid hormone analogs and modulators. Future research directions should focus on elucidating the complete network of thyroid hormone transporters, understanding their regulation in metabolic diseases, and developing targeted therapies that can selectively modulate thyroid hormone action in specific tissues to optimize metabolic outcomes without disrupting systemic homeostasis.
Thyroid hormones (THs), primarily 3,5,3′-triiodothyronine (T3) and thyroxine (T4), are essential regulators of development, growth, and metabolism in nearly all vertebrate tissues [18]. The genomic actions of thyroid hormones, classified as Type 1 signaling, are mediated by nuclear thyroid hormone receptors (TRs) that function as ligand-dependent transcription factors [18]. These receptors modulate transcription by binding to specific DNA sequences called thyroid hormone response elements (TREs) in the regulatory regions of target genes [19]. The intricate balance between thyroid hormone production, cellular uptake, receptor expression, and chromatin interactions constitutes a critical regulatory system that maintains metabolic homeostasis. Dysregulation of this pathway underpins several human diseases, including metabolic disorders, cardiovascular disease, and various cancers [18] [20]. Understanding the molecular mechanisms of thyroid hormone genomic signaling provides crucial insights into their fundamental role in regulating basal metabolic rate and energy expenditure, with significant implications for therapeutic development in metabolic diseases.
Thyroid Hormone Receptors (TRα and TRβ): Structure, Isoforms, and Localization
Receptor Subtypes and Structural Characteristics
The thyroid hormone receptors, TRα and TRβ, are members of the nuclear receptor superfamily encoded by separate genes: THRA (chromosome 17) and THRB (chromosome 3) in humans [21]. These genes generate multiple protein isoforms through alternative splicing, with TRα1, TRβ1, and TRβ2 representing the primary T3-binding variants [18] [21]. All functional TR isoforms share a conserved modular structure containing:
- DNA-binding domain (DBD): Highly conserved central domain featuring two zinc fingers that mediate sequence-specific recognition of and binding to TREs
- Ligand-binding domain (LBD): C-terminal domain that binds thyroid hormone with high affinity, with T3 binding TRs with approximately 10-fold higher affinity than T4 [20]
- Activation function domains: AF-1 domain in the N-terminal region and AF-2 domain within the LBD, which undergo conformational changes upon ligand binding to facilitate cofactor interactions [21]
Table 1: Major Thyroid Hormone Receptor Isoforms and Their Characteristics
| Isoform | Gene | Tissue Distribution | Primary Functions |
|---|---|---|---|
| TRα1 | THRA | Heart, brain, bone, skeletal muscle | Cardiovascular function, neuronal development, skeletal maintenance |
| TRβ1 | THRB | Liver, kidney, brain | Hepatic lipid metabolism, cholesterol regulation, metabolic rate |
| TRβ2 | THRB | Pituitary gland, hypothalamus | Negative feedback in HPT axis, TSH regulation |
Subcellular Localization and Dynamics
Although primarily nuclear proteins, TRα1 and TRβ1 exhibit remarkable dynamism, shuttling rapidly between the nucleus and cytoplasm through specific nuclear localization signals (NLS) and nuclear export signals (NES) that interact with importins and exportins [18]. This continuous nucleocytoplasmic trafficking represents a critical control point for modulating thyroid hormone-responsive gene expression [18]. Recent research has also identified enigmatic cytoplasmic functions for certain TR variants and mitochondrial targeting sequences that expand the diversity of cellular responses to thyroid hormone [18]. The distribution of specific TR isoforms varies significantly between tissues and species, with TRα predominating in cardiovascular and central nervous systems, while TRβ is prevalent in metabolic tissues such as liver, contributing to the tissue-specific effects of thyroid hormones [21].
Thyroid Hormone Response Elements (TREs): Architecture and Recognition
Structural Diversity of TREs
Thyroid hormone response elements are specific DNA sequences located in the regulatory regions of target genes that serve as binding platforms for TRs. The canonical TRE consists of two core recognition motifs (typically AGGTCA or variants) arranged as direct repeats with a 4-base pair spacer (DR4) [22] [23]. However, natural TREs display considerable structural diversity, with variations in half-site sequence, orientation, and spacing contributing to functional specificity [19].
Table 2: Common Thyroid Hormone Response Element Configurations
| TRE Type | Arrangement | Core Sequence | Preference |
|---|---|---|---|
| Direct Repeat (DR4) | AGGTCA(nnnn)AGGTCA | Direct repeat with 4bp spacer | Strong TR/RXR heterodimer binding |
| Palindromic (TREpal) | AGGTCATGACCT | Inverted palindrome | TR homodimer and heterodimer binding |
| Inverted Palindrome | TCAGGTCATGACCTGA | Inverted repeat with spacer | Variable TR/RXR binding |
| Single Half-site | (A/G)GGTCA | Single motif with flanking sequences | Often requires accessory factors |
TR-RXR Heterodimerization and Sequence-Specific Binding
TRs typically bind to TREs as heterodimers with retinoid X receptors (RXRs), with RXR occupying the upstream half-site in a typical DR4 arrangement [19] [24]. However, the requirement for RXR heterodimerization varies considerably depending on TRE sequence characteristics. When the upstream half-site contains TA or TG 5' to the core hexamer, TR homodimers can bind effectively with relative independence from RXR, while TREs with different upstream sequences show greater RXR dependence [19] [24]. This sequence-dependent variation in receptor binding requirements adds a significant layer of regulatory complexity to thyroid hormone signaling, allowing for fine-tuned gene-specific responses.
Mechanisms of Transcriptional Regulation
The Bimodal Switch Model and Beyond
The classical model of TR function depicts a bimodal switch where unliganded TR represses transcription through stable chromatin binding and recruitment of corepressor complexes, while hormone binding induces a conformational change that releases corepressors and recruits coactivators to activate transcription [23] [21]. However, recent genomic studies have revealed a more dynamic and nuanced picture:
- Ligand-dependent receptor recruitment: Chromatin immunoprecipitation sequencing (ChIP-seq) studies demonstrate considerable hormone-induced TR recruitment to chromatin associated with chromatin remodeling and activated gene transcription, challenging the model of constitutive TR binding [23]
- Dynamic chromatin interactions: Genome-wide footprinting analyses provide little evidence for stable TR footprints both in the absence and presence of hormone, suggesting that TR engagement with chromatin is highly dynamic rather than static [23]
- Persistent binding sites: A significant subset of TRβ binding sites in pituitary chromatin maintains receptor occupancy regardless of T3 levels, and these sites show the most pronounced T3-dependent histone modifications and chromatin opening [22]
Chromatin Remodeling and Enhancer Activation
Thyroid hormone signaling induces significant chromatin remodeling at regulatory regions, as evidenced by genome-wide mapping of DNase I hypersensitive sites (DHS) and histone modifications. In liver tissue, T3 treatment results in thousands of regions with altered chromatin accessibility, with approximately 31% of differentially regulated DHSs being either formed or erased de novo as a consequence of T3 treatment [23]. These T3-remodelled regions are primarily located within intronic and intergenic regions and frequently correspond to active enhancers marked by increased H3K27 acetylation and H3K4 monomethylation [22]. Notably, T3 primarily increases rather than depletes these active histone marks at TR-bound distal sites, with minimal changes at promoter-proximal regions [22].
Diagram Title: TR Transcriptional Switch Mechanism
Experimental Analysis of Genomic Signaling
Key Methodologies and Workflows
Investigation of thyroid hormone genomic signaling employs sophisticated genomic and molecular biology techniques that have revealed the complex dynamics of TR-chromatin interactions:
- Chromatin Affinity Purification Sequencing (ChAP-seq): Using biotinylated TRβ expressed from the endogenous locus in mice, this approach identifies specific receptor binding sites in tissues such as pituitary and cerebral cortex with high specificity and low background [22]
- DNase I Hypersensitivity Sequencing (DNase-seq): Maps chromatin accessibility changes in response to T3 treatment, identifying thousands of regions with altered accessibility in liver tissue under hypothyroid versus hyperthyroid conditions [23]
- Chromatin Immunoprecipitation Sequencing (ChIP-seq): For endogenous TR and histone modifications (H3K27ac, H3K4me1), revealing hormone-dependent changes in enhancer activity and receptor occupancy [22] [23]
- Integrated genomic analysis: Combining TR binding data with chromatin accessibility and histone modification maps to define functional enhancers and their association with T3-regulated genes [22]
Diagram Title: Genomic Analysis Workflow
Research Reagent Solutions
Table 3: Essential Research Reagents for Thyroid Hormone Genomic Signaling Studies
| Reagent/Cell System | Function/Application | Key Characteristics |
|---|---|---|
| ThrbHAB/HAB;Rosa26BirA/BirA mice | In vivo TRβ chromatin binding studies | Endogenously biotinylated TRβ for high-affinity purification; normal physiology |
| S. cerevisiae reporter system | TRE functional analysis | Lacks endogenous nuclear receptors; manipulable for TR/RXR expression |
| Anti-TRβ antibody (C1) | ChIP-seq against endogenous TR | Recognizes both TRβ and TRα; validated in TR double KO background |
| TR double knockout mice | Control for ChIP-seq specificity | Eliminates background from non-specific antibody binding |
| Methimazole (MMI)/PTU models | Established hypothyroid conditions | Blocks thyroid hormone synthesis; creates baseline for T3 responses |
| T3 treatment protocols | Hyperthyroid conditions | Acute or chronic T3 administration; reveals ligand-dependent effects |
Connection to Basal Metabolic Rate Regulation
The genomic actions of thyroid hormones through TRα and TRβ directly regulate basal metabolic rate (BMR) by controlling the expression of genes involved in mitochondrial biogenesis, thermogenesis, and substrate metabolism [20] [25]. Even within the euthyroid range, subtle variations in thyroid hormone levels associate with measurable differences in BMR, with free T3 showing a stronger correlation with metabolic rate than TSH or free T4 [25]. The TRβ isoform appears particularly important for metabolic regulation, as evidenced by the development of selective TRβ agonists that lower cholesterol and triglycerides without adverse cardiac effects [21]. Genomic studies reveal that TRβ binding sites in metabolic tissues are enriched near genes involved in hormonal responses and metabolic functions, providing a direct molecular link between receptor-chromatin interactions and metabolic control [22]. The poised receptor-enhancer complexes that maintain TR binding regardless of T3 levels may facilitate adjustable metabolic responses to fluctuating hormone levels, representing a genomic basis for metabolic adaptation [22].
The classical genomic actions of thyroid hormones (TH), primarily mediated by nuclear thyroid hormone receptors (TRs) that modulate gene transcription, have been well-established in the context of basal metabolic rate (BMR) regulation. However, emerging research has revealed that TH also initiates rapid signaling events through extranuclear pathways that significantly contribute to metabolic processes. These non-genomic actions occur too rapidly to involve changes in gene expression and are primarily initiated at the plasma membrane and within the cytoplasm [26]. The integral membrane protein integrin αvβ3 serves as a critical cell surface receptor for these non-genomic actions, recognizing both thyroxine (T4) and triiodothyronine (T3) with discrete affinities [27] [26]. This whitepaper examines the molecular mechanisms of integrin αvβ3-mediated thyroid hormone signaling and its implications for metabolic research and therapeutic development.
The significance of these non-genomic pathways extends to fundamental metabolic processes. While the genomic actions of TH primarily regulate long-term adaptive thermogenesis through nuclear receptor-mediated transcription, the non-genomic pathways contribute to more immediate metabolic responses [28] [26]. These rapid signaling events modulate cellular energy expenditure, mitochondrial function, and substrate utilization through mechanisms that operate independently of nuclear TR activation. Understanding these dual mechanisms provides a more comprehensive framework for investigating thyroid hormone regulation of basal metabolic rate and developing targeted therapeutic interventions for metabolic disorders.
Molecular Mechanisms of Integrin αvβ3-Mediated Thyroid Hormone Signaling
Receptor Recognition and Hormone Binding
Integrin αvβ3 possesses distinct binding sites for thyroid hormones on its extracellular domain [26]. The principal ligand for this receptor is L-thyroxine (T4), which binds at physiological concentrations, while T3 demonstrates approximately tenfold lower affinity and typically requires supraphysiological concentrations to initiate signaling [27]. The hormone recognition site overlaps with or is adjacent to the Arg-Gly-Asp (RGD) recognition sequence on the integrin, which explains why RGD peptides can effectively block thyroid hormone binding and subsequent ERK1/2 activation [27]. This receptor is highly expressed in rapidly dividing cell types, including tumor cells and proliferating endothelial cells, but is present at lower levels in normal, non-malignant cells [29].
Following hormone binding, integrin αvβ3 undergoes conformational changes that trigger its internalization through caveolin-dependent mechanisms [27]. During this process, the integrin heterodimer disassociates, allowing the monomeric αv subunit—but not β3—to translocate to the nucleus in complex with phosphorylated ERK1/2 [27]. This complex then associates with transcriptional coactivators (p300, STAT1) and corepressors (NCoR, SMRT) to regulate gene expression through a non-classical mechanism that does not involve direct thyroid hormone receptor binding to DNA [27].
Downstream Signal Transduction Pathways
The binding of thyroid hormones to integrin αvβ3 activates several key intracellular signaling cascades that mediate the hormone's rapid effects. The table below summarizes the primary signaling pathways and their functional consequences in target cells:
Table 1: Key Signaling Pathways Activated by Thyroid Hormone Binding to Integrin αvβ3
| Signaling Pathway | Key Components | Biological Consequences | Research Context |
|---|---|---|---|
| ERK1/2 Pathway | ERK1/2, FAK, Src | Cell proliferation, gene expression regulation, dendritogenesis | Cancer cell proliferation, neuronal development [27] [30] |
| PI3K/Akt Pathway | PI3K, Akt, mTOR | Anti-apoptosis, cell survival, metabolic regulation | Cancer cell survival, radioresistance [31] [32] |
| Cytoskeletal Regulation | F-actin, p190 RhoGEF | Actin reorganization, neurite outgrowth, cell migration | Neuronal development, brain morphogenesis [30] [26] |
The extracellular signal-regulated kinase 1/2 (ERK1/2) pathway represents a major signaling route initiated by thyroid hormone binding to integrin αvβ3 [27]. Activation occurs through focal adhesion kinase (FAK), a non-receptor tyrosine kinase that connects integrin activation to downstream signaling events [27] [30]. Phosphorylated ERK1/2 then translocates to the nucleus where it modulates transcriptional activity through phosphorylation of coactivators and corepressors [27]. In cancer models, this pathway promotes cell proliferation and contributes to chemoresistance, particularly in colorectal carcinoma with Ras mutations [27].
The phosphatidylinositol 3-kinase (PI3K) pathway represents another critical signaling route, though interestingly, T3 appears to be more effective than T4 in activating this particular pathway [27]. PI3K activation leads to Akt phosphorylation, which subsequently promotes cell survival through inhibition of apoptotic mechanisms [32]. This pathway contributes to the anti-apoptotic effects of thyroid hormone in various cancer models and supports tumor cell survival under stress conditions.
Additionally, thyroid hormone binding to integrin αvβ3 regulates the state of the actin cytoskeleton through rapid mechanisms that involve both T4 and reverse T3 (rT3), but not T3 [26]. This action is particularly important in neural cells, where adequate polymerization of actin (F-actin) is essential for normal dendritogenesis and neurite outgrowth during development [30] [26]. The cytoskeletal effects manifest within minutes of hormone exposure and do not require changes in actin mRNA abundance, confirming their non-genomic nature [26].
Quantitative Data and Experimental Findings
Research across multiple model systems has generated quantitative data characterizing the molecular and cellular consequences of thyroid hormone signaling through integrin αvβ3. The following table summarizes key experimental findings from recent studies:
Table 2: Quantitative Experimental Findings in Integrin αvβ3-Mediated Thyroid Hormone Signaling
| Experimental System | Hormone Concentration | Key Findings | Reference |
|---|---|---|---|
| Cerebellar Purkinje Cells | 10 nM T3, T4, or rT3 | Significant augmentation of dendrite arborization; suppressed by LM609 (integrin αvβ3 antagonist) and TR knockdown | [30] |
| Neuro-2A Clonal Cells | 10 nM T3, T4, or rT3 | Induction of neurite growth; reduced by LM609 and TRα knockdown; increased phosphorylation of FAK, Akt, ERK1/2 | [30] |
| T-cell Lymphoma Models | Physiological concentrations | Promoted TCL proliferation and VEGF-driven angiogenesis; inhibition of integrin αvβ3 decreased tumor growth and angiogenesis | [32] |
| Colorectal Cancer Cells | Physiological T4 | Induced proliferation via ERK1/2; tetrac and NDAT blocked proliferation and overcome chemoresistance in Ras-mutant cells | [27] |
| Various Cancer Cell Lines | Physiological T4 | Stimulation of tumor cell proliferation, anti-apoptosis, radioresistance; differential regulation of specific genes | [26] [29] |
These quantitative findings demonstrate that thyroid hormones at physiological concentrations (typically 10 nM in experimental systems) can elicit significant cellular responses through integrin αvβ3-mediated signaling. The effects are consistently observed across diverse cell types, including neurons, immune cells, and various cancer models, highlighting the broad relevance of this pathway.
Experimental Protocols and Methodologies
Investigating Integrin αvβ3-Mediated Neuritogenesis
The role of integrin αvβ3 in thyroid hormone-induced neuritogenesis has been systematically investigated using primary cerebellar cultures and neuronal cell lines [30]. The following protocol represents a standardized approach for assessing these effects:
Cell Culture Preparation:
- Primary cerebellar cultures are prepared from postnatal day 0 C57BL/6 mice through enzymatic digestion with papain dilution buffer (0.2 unit/mL papain, 0.02 mg/mL DNase I, 0.2 mg/mL L-cysteine, 5 mg/mL glucose, and 0.2 mg/mL bovine serum albumin in PBS) [30].
- Dissociated cells are resuspended in cerebellar culture medium (DMEM/F12 containing 1% penicillin-streptomycin, 3.9 mM glutamine, 2.1 mg/mL glucose, 30 nM sodium selenite, 20 μg/mL insulin, and 200 μg/mL transferrin) [30].
- Cells are plated at a density of 3×10^5 cells/0.3 mL in poly-L-lysine-coated chamber slides and maintained at 37°C in a 5% CO2 incubator.
Hormone Treatment and Pharmacological Inhibition:
- At 16-24 hours after plating, thyroid hormones (T3, T4, or rT3) are added to the culture medium at a concentration of 10 nM [30].
- For inhibition studies, the integrin αvβ3 antagonist LM609 (monoclonal antibody) is applied concurrently with hormone treatment.
- For gene knockdown approaches, TRα and TRβ expression is reduced using specific siRNAs or shRNAs to distinguish receptor-dependent and independent effects.
Assessment and Analysis:
- After 17 days in culture, cells are fixed with 4% paraformaldehyde and processed for immunohistochemistry [30].
- Dendritic arborization and neurite outgrowth are quantified using morphological analysis with specific markers for neuronal cells (e.g., calbindin for Purkinje cells).
- Phosphorylation of signaling components (FAK, Akt, ERK1/2) is assessed by Western blotting or immunocytochemistry.
- Actin cytoskeleton reorganization is evaluated using F-actin staining with phalloidin conjugates, and synapsin-1 localization is examined as a marker of synaptic differentiation.
Evaluating Cancer Cell Proliferation and Signaling
The proliferative effects of thyroid hormone via integrin αvβ3 have been extensively characterized in cancer models using the following methodological approach:
Cell Culture and Treatment:
- Human cancer cell lines (e.g., breast cancer, colorectal cancer, glioblastoma) are maintained in appropriate culture media [27] [29].
- Cells are treated with physiological concentrations of T4 (0.1-10 nM) or T3 (1-100 nM) for varying time periods (minutes to days) to assess both rapid signaling and long-term proliferation [27].
- For antagonist studies, tetraiodothyroacetic acid (tetrac) or its nanoparticle derivative (NDAT) is applied at concentrations ranging from 1-10 μM to block the hormone-integrin interaction [27].
Signal Transduction Analysis:
- Following hormone treatment (typically 5-30 minutes for initial signaling events), cells are lysed and protein extracts are analyzed by Western blotting for phosphorylated ERK1/2, FAK, and Akt [27] [30].
- Integrin internalization is tracked using fluorescently labeled antibodies or integrin-GFP constructs through live-cell imaging and immunofluorescence [27].
- Gene expression changes are assessed by RT-PCR or RNA sequencing for known target genes such as HIF-1α, COX-2, and ER-α [27].
Functional Assays:
- Cell proliferation is quantified using MTT assays, BrdU incorporation, or direct cell counting over 3-7 days [27] [29].
- Apoptosis resistance is evaluated through Annexin V staining and caspase activity assays in the presence of chemotherapeutic agents [32].
- Angiogenic potential is assessed by measuring VEGF production (ELISA) and in vitro tube formation assays using endothelial cells [32].
Visualization of Signaling Pathways
The following diagrams illustrate the key molecular events in integrin αvβ3-mediated thyroid hormone signaling, created using Graphviz DOT language with specified color palette compliance.
Diagram 1: Integrin αvβ3-mediated thyroid hormone signaling pathway
Diagram 2: Experimental workflow for investigating non-genomic TH actions
The Scientist's Toolkit: Essential Research Reagents
The following table compiles key reagents and their applications for investigating integrin αvβ3-mediated thyroid hormone signaling:
Table 3: Essential Research Reagents for Investigating Integrin αvβ3-Mediated Thyroid Hormone Signaling
| Reagent Category | Specific Examples | Research Application | Mechanism of Action |
|---|---|---|---|
| Hormone Preparations | T4 (Thyroxine), T3 (Triiodothyronine), rT3 (Reverse T3) | Control treatments; concentration-response studies | Natural ligands with differential affinity for integrin αvβ3 [27] [30] |
| Receptor Antagonists | Tetrac (Tetraiodothyroacetic acid), NDAT (Nanoparticle-conjugated Tetrac) | Block specific hormone-integrin interaction; cancer therapeutic studies | Competes with thyroid hormones for integrin binding site [27] [29] |
| Integrin Inhibitors | LM609 (monoclonal antibody), RGD peptides, Cilengitide | Specific blockade of integrin αvβ3 function | Binds extracellular domain preventing ligand interaction [27] [30] |
| Signaling Inhibitors | FAK inhibitors (PF-573228), MEK/ERK inhibitors (U0126), PI3K inhibitors (LY294002) | Pathway dissection; determination of signaling mechanisms | Blocks specific kinase activities in downstream pathways [27] [30] |
| Molecular Biology Tools | siRNAs against TRα, TRβ, integrin subunits; Plasmid constructs | Gene function studies; receptor dependence assessment | Selective knockdown or overexpression of target genes [30] |
| Detection Reagents | Phospho-specific antibodies (pERK, pAkt, pFAK), F-actin probes (Phalloidin) | Signal transduction monitoring; cytoskeletal changes | Visualizes and quantifies pathway activation and morphological effects [30] |
These research tools enable comprehensive investigation of the molecular mechanisms underlying integrin αvβ3-mediated thyroid hormone signaling. The availability of specific antagonists like tetrac and NDAT provides particularly valuable approaches for discriminating between genomic and non-genomic actions of thyroid hormones [27] [29].
The recognition of integrin αvβ3 as a functional receptor for thyroid hormones has substantially expanded our understanding of thyroid hormone action beyond classical genomic mechanisms. These non-genomic pathways mediate rapid signaling events that contribute to fundamental cellular processes including proliferation, survival, metabolism, and development. The implications for basal metabolic rate research are particularly significant, as these rapid mechanisms may work in concert with genomic actions to fine-tune metabolic regulation.
From a therapeutic perspective, the integrin αvβ3 receptor represents a promising target for drug development, particularly in oncology where thyroid hormone signaling promotes tumor progression and chemoresistance [27] [29]. Tetrac-based therapeutics that specifically target the hormone-integrin interaction offer a novel approach for disrupting these pathways without affecting genomic thyroid hormone functions. Further research elucidating the crosstalk between integrin-mediated signaling and traditional nuclear pathways will continue to enhance our understanding of thyroid hormone physiology and its relationship to metabolic regulation in health and disease.
Thyroid hormones, triiodothyronine (T3) and thyroxine (T4), are principal regulators of energy homeostasis and basal metabolic rate (BMR). They exert profound direct metabolic effects by modulating fundamental cellular processes, including mitochondrial biogenesis, oxidative phosphorylation, and ion gradient maintenance. This review details the molecular mechanisms through which T3 and T3 regulate mitochondrial mass and function and control the activity of Na+/K+ ATPase, the major energy-consuming process in cells. Understanding these pathways is critical for research and drug development targeting metabolic diseases, aging, and endocrine disorders.
Regulation of Mitochondrial Biogenesis and Respiration
Transcriptional Control of Mitochondrial Biogenesis
Mitochondrial biogenesis is the growth and division of pre-existing mitochondria, a process requiring coordinated expression of both nuclear and mitochondrial genomes [33]. Thyroid hormones are master regulators of this process, primarily through the activation of a well-defined transcriptional cascade.
- Master Regulator PGC-1α: Peroxisome proliferator-activated receptor-γ coactivator-1α (PGC-1α) is the central regulator of mitochondrial biogenesis [33] [34]. It acts as a co-transcriptional regulator, interacting with and co-activating multiple transcription factors.
- Nuclear Respiratory Factors (NRFs): PGC-1α activates nuclear respiratory factor 1 (NRF-1) and NRF-2 [33] [35]. These transcription factors control the expression of nuclear genes encoding all electron transport chain (ETC) subunits and key factors for mitochondrial DNA (mtDNA) transcription and replication [35].
- Mitochondrial Transcription Factor A (TFAM): NRF-1 directly activates the expression of TFAM, the final effector that drives mtDNA transcription and replication [35] [34]. Increased TFAM is a hallmark of mitochondrial biogenesis.
Table 1: Key Proteins in the Mitochondrial Biogenesis Transcriptional Cascade
| Protein | Function | Role in Biogenesis |
|---|---|---|
| PGC-1α | Transcriptional coactivator | Master regulator; integrates signaling pathways and activates NRFs [33] [34] |
| NRF-1 | Transcription factor | Activates expression of ETC genes, TFAM, TFB1M, and TFB2M [35] |
| NRF-2 (GABPA) | Transcription factor | Regulates expression of nuclear-encoded ETC subunits and TOMM20 [35] |
| TFAM | mtDNA binding protein | Essential for mtDNA transcription and replication; packages mtDNA [35] [34] |
Thyroid Hormone Signaling to Mitochondrial Biogenesis
Thyroid hormones stimulate mitochondrial biogenesis primarily by upregulating the expression and activity of PGC-1α [2]. The interaction between T3 and its nuclear receptors leads to the activation of the PGC-1α cascade, resulting in an increased number of mitochondria and elevated oxidative phosphorylation capacity [34]. This direct genomic action is a key mechanism for increasing the cell's capacity for ATP production and overall metabolic rate.
Upstream Signaling Pathways
Several upstream signaling pathways converge on PGC-1α to regulate mitochondrial biogenesis in response to energy demand and cellular stress.
- AMPK Pathway: AMP-activated protein kinase (AMPK) acts as a cellular energy sensor. Upon activation by an increased AMP/ATP ratio, it directly phosphorylates and activates PGC-1α [33]. Chronic AMPK activation upregulates PGC-1α expression and induces mitochondrial biogenesis [33].
- CaMK Pathway: An increase in intracellular Ca²⁺ activates Ca²+/calmodulin-dependent protein kinase (CaMK), which in turn activates PGC-1α expression via the transcription factor CREB [35].
- p38 MAPK Pathway: The p38 mitogen-activated protein kinase (p38 MAPK) regulates PGC-1α both by activating its transcription (via MEF2 and ATF2) and through post-translational phosphorylation that enhances its activity [35].
- Sirtuins and cGMP: SIRT1 deacetylates and activates PGC-1α [35]. Nitric oxide (NO) production leads to increased cGMP, which also promotes mitochondrial biogenesis [35].
The following diagram illustrates the core transcriptional cascade and the key upstream signaling pathways that regulate mitochondrial biogenesis.
Quantitative Effects on Respiration and Metabolic Rate
Thyroid hormones significantly increase cellular oxygen consumption and basal metabolic rate. This is quantitatively demonstrated through metabolic flux analyses.
- Oxygen Consumption Rate (OCR): Studies using Seahorse metabolic flux analyzers show that cellular models with impaired thyroid-hormone-like signaling (e.g., loss of Na/K-ATPase α1/Src interaction) exhibit significantly reduced basal and maximal OCR, along with a ~65% reduction in spare respiratory capacity [36].
- In Vivo Correlations: In free-ranging birds, circulating T3 levels positively correlate with resting metabolic rate (RMR), establishing a direct link between thyroid hormone levels and whole-animal energy expenditure [37].
Table 2: Quantitative Metabolic Parameters Influenced by Thyroid Hormone Signaling
| Metabolic Parameter | Measurement Technique | Effect of Enhanced Thyroid Hormone Signaling |
|---|---|---|
| Basal Oxygen Consumption Rate (OCR) | Seahorse Mitochondrial Stress Test | Increased [36] |
| Maximal OCR | Seahorse Mitochondrial Stress Test | Increased [36] |
| Spare Respiratory Capacity | Seahorse Mitochondrial Stress Test | Increased (~65% higher in functional models) [36] |
| Resting Metabolic Rate (RMR) | Respirometry (whole organism) | Positively correlated with T3 levels [37] |
Regulation of Na+/K+ ATPase Activity
Mechanism of Na+/K+ ATPase Stimulation by Thyroid Hormone
The Na+/K+ ATPase is a critical P-type ATPase that maintains transmembrane Na+ and K+ gradients, consuming a substantial portion of cellular ATP. Thyroid hormones directly and rapidly stimulate its activity.
- Stimulation of Activity: Physiological concentrations of T3 (as low as 10⁻⁹ M) significantly increase the hydrolytic activity of Na+/K+ ATPase in alveolar epithelial cells, with peak effects (up to 2-fold increase) observed within hours [38].
- Non-Transcriptional Mechanism: This stimulation is T3-specific (reverse T3 has no effect) and is not blocked by the transcription inhibitor actinomycin D. No changes in Na+/K+ ATPase mRNA or total protein levels are detected, ruling out a genomic mechanism in the short term [38].
- Membrane Insertion: The upregulation occurs via translocation of existing Na+/K+ ATPase α1- and β1-subunit proteins to the plasma membrane. This process is abolished by brefeldin A, an inhibitor of protein trafficking from the Golgi apparatus [38].
Signaling and Redox Regulation of Na+/K+ ATPase
Beyond direct hormonal control, Na+/K+ ATPase activity is finely tuned by redox-sensitive mechanisms, allowing it to function as an "oxygen sensor" and adjust its ATP consumption to metabolic supply [39].
- Redox-Sensitive Thiols: Regulatory thiol groups on all three subunits of the Na+/K+ ATPase are targets for reversible modifications, including S-glutathionylation and S-nitrosylation, which directly modulate pump activity [39].
- ROS and RNS as Messengers: Reactive oxygen species (ROS) like H₂O₂ and reactive nitrogen species (RNS) like nitric oxide (NO) act as signaling messengers that modify these thiols, adjusting pump activity to cellular metabolic conditions, particularly during hypoxia [39].
- Signaling Platform: The Na+/K+ ATPase, especially the α1 isoform, also serves as a signaling scaffold. Its interaction with Src kinase regulates processes like metabolic reserve and flexibility. Disruption of this interaction in cell models leads to a complete loss of metabolic reserve and increased reliance on glycolysis [36].
The diagram below integrates the rapid, non-genomic stimulation of the Na+/K+ ATPase by T3 with the redox-sensitive regulatory network that allows it to adapt to the cell's metabolic state.
The Scientist's Toolkit: Key Experimental Reagents & Methodologies
Research Reagent Solutions
Table 3: Essential Reagents and Materials for Investigating Thyroid Metabolic Effects
| Reagent/Material | Function/Application | Key Use in Research |
|---|---|---|
| Seahorse XF Analyzer | Real-time measurement of OCR and ECAR in live cells. | Quantifying mitochondrial function (basal/maximal respiration, spare capacity) and glycolytic rate in response to T3/T4 [36]. |
| 2-Deoxy-D-Glucose (2-DG) | Competitive glycolytic inhibitor. | Assessing metabolic flexibility and reliance on glycolysis in cell models [36]. |
| pNaKtide | Cell-permeable peptide inhibitor of NKA α1/Src interaction. | Probing the role of NKA α1-specific signaling in metabolic regulation and insulin resistance [36]. |
| AICAR | AMPK agonist. | Experimentally activating the AMPK pathway to study its role in PGC-1α activation and mitochondrial biogenesis [33]. |
| Brefeldin A | Inhibitor of protein transport from Golgi. | Differentiating between transcriptional and post-translational (e.g., membrane insertion) mechanisms, as used in T3-Na+/K+ ATPase studies [38]. |
| Actinomycin D | Transcription inhibitor. | Determining if effects of a stimulus (e.g., T3) are mediated through gene transcription or non-genomic pathways [38]. |
Detailed Experimental Protocol: Mitochondrial Stress Test
The Seahorse XF Analyzer is a key technology for assessing the direct effects of thyroid hormones on cellular metabolism.
Objective: To determine the effect of T3/T4 treatment on mitochondrial function in cultured cells.
Methodology:
- Cell Culture: Seed cells (e.g., primary myocytes, hepatocytes, or cell lines like C2C12 or L6) in XF microplates.
- Treatment: Incubate cells with physiological (nM) or pharmacological (µM) concentrations of T3 or T4 for a defined period (e.g., 6-24 hours). Include vehicle-only controls.
- Assay Medium: Prior to the assay, replace medium with XF assay medium (bicarbonate-free, pH 7.4) supplemented with glucose, glutamine, and sodium pyruvate. Incubate for 1 hour in a non-CO₂ incubator.
- Mitochondrial Stress Test: Sequentially inject modulators into the cell culture and measure OCR in real-time:
- Oligomycin: ATP synthase inhibitor; reveals ATP-linked respiration.
- FCCP: Mitochondrial uncoupler; reveals maximal respiratory capacity.
- Rotenone & Antimycin A: Complex I and III inhibitors; reveal non-mitochondrial respiration.
- Data Analysis: Calculate key parameters from the OCR profile: Basal Respiration, ATP Production, Proton Leak, Maximal Respiration, and Spare Respiratory Capacity [36].
Detailed Experimental Protocol: Na+/K+ ATPase Activity and Membrane Insertion
This protocol, adapted from studies on alveolar cells, details how to investigate the non-genomic effects of T3 on Na+/K+ ATPase [38].
Objective: To assess rapid, non-transcriptional stimulation of Na+/K+ ATPase activity and plasma membrane insertion by T3.
Methodology:
- Cell Treatment: Treat cells (e.g., primary alveolar epithelial cells or relevant cell lines) with physiological concentrations of T3 (10⁻⁹ M to 10⁻⁷ M) for short durations (30 minutes to 6 hours). Include controls with reverse T3 to confirm specificity.
- Inhibition Controls: Pre-treat parallel samples with Actinomycin D (to block transcription) or Brefeldin A (to disrupt Golgi trafficking).
- Na+/K+ ATPase Activity Assay: Measure hydrolytic activity in cell homogenates by quantifying the release of inorganic phosphate (Pi) from ATP in the presence and absence of ouabain (a specific NKA inhibitor). Ouabain-sensitive ATPase activity represents Na+/K+ ATPase activity.
- Surface Biotinylation: To quantify membrane insertion, label cell surface proteins with a membrane-impermeable biotin reagent. Isolate biotinylated proteins using streptavidin beads and detect the levels of Na+/K+ ATPase α1- and β1-subunits via Western blotting. Compare to total cellular protein levels.
- Data Interpretation: A rapid increase in ouabain-sensitive ATPase activity and biotinylated α1/β1 subunits, which is insensitive to Actinomycin D but blocked by Brefeldin A, confirms a non-genomic, translocation-mediated mechanism [38].
From Mechanism to Therapy: Research Models and Drug Development Strategies
In Vitro and Animal Models for Studying TH-Mediated Metabolic Regulation
Thyroid hormones (THs), triiodothyronine (T3) and thyroxine (T4), are fundamental regulators of basal metabolic rate, energy expenditure, and thermogenesis [11]. Research into their mechanisms requires robust experimental models that accurately replicate their complex physiological roles. This guide details established and emerging in vitro and animal models, providing methodologies and quantitative data to inform the study of TH-mediated metabolic regulation.
Thyroid Hormone Signaling and Metabolic Pathways
Thyroid hormones regulate metabolism through genomic and non-genomic pathways. The primary genomic pathway involves hormone transport, receptor binding, and regulation of gene expression. The diagram below illustrates the core signaling pathway of thyroid hormones in a target cell, from cellular entry to genomic effects.
Key In Vitro Models and Applications
In vitro systems provide controlled environments for dissecting molecular mechanisms of TH action.
Primary Hepatocyte Models
Primary hepatocytes from humans and rodents are a cornerstone model for studying TH metabolism, particularly glucuronidation, a key metabolic pathway.
Detailed Experimental Protocol: Primary Hepatocyte Culture for T4 Metabolism Studies [40]
- Cell Culture System: Utilize a 2D-sandwich (2Dsw) culture configuration. Isolate and plate primary hepatocytes (e.g., from Wistar rats or human donors) on collagen-coated plates. After cell attachment, overlay with a second layer of collagen to maintain hepatic polarity and function.
- Test Substance Exposure: Prepare stock solutions of nuclear receptor activators (e.g., Phenobarbital (PB), Rifampicin (RIF), β-naphthoflavone (BNF)) in DMSO. Expose hepatocytes to these compounds at various concentrations (e.g., 10-1000 µM). Include a vehicle control (DMSO only).
- T4 Metabolism Assay: On culture day 7 or 8, add a physiological concentration of L-Thyroxine (T4) (e.g., 1 µM) to the medium. Incubate for 24 hours.
- Sample Collection and Analysis:
- Medium: Collect culture medium at specific time points (e.g., 4, 8, 24h). Analyze for T4 and its metabolites (T4-glucuronide (T4-G), T4-sulfate (T4-S)) using Liquid Chromatography-Tandem Mass Spectrometry (LC-MS/MS).
- Cells: Harvest cells for RNA extraction. Perform reverse transcription quantitative real-time PCR (RT-qPCR) to analyze gene expression of enzymes like UDP-glucuronosyltransferase (UGT) isoforms and iodothyronine deiodinase type I (DIO1).
- Data Interpretation: Quantify the rate of T4 disappearance and metabolite formation. Correlate these changes with the expression profiles of metabolizing enzymes to identify specific pathways affected by test compounds.
Table 1: Species-Specific Differences in T4 Metabolism in Hepatocytes [40]
| Nuclear Receptor Activator | Species | Key Effect on T4 Metabolism | Implicated Mechanism |
|---|---|---|---|
| Phenobarbital (PB) | Rat (Wistar) | Markedly accelerated T4 depletion | Strong induction of T4-glucuronidation |
| Phenobarbital (PB) | Human | Minimal to no effect on T4 depletion | Lack of significant UGT induction |
| Rifampicin (RIF) | Human | Significant reduction in T4 half-life | Induction of T4-glucuronidating UGTs |
| β-naphthoflavone (BNF) | Rat (Wistar) | Increased T4 metabolism | Induction of Phase I and II enzymes |
Adipocyte Cell Models and the "Browning" Process
White and brown adipocyte cell lines are vital for investigating TH's role in energy expenditure and the "browning" of white adipose tissue—the acquisition of energy-dissipating, brown fat-like characteristics [11].
Detailed Experimental Protocol: Investigating Adipocyte Browning In Vitro [11]
- Cell Line Selection: Use pre-adipocyte cell lines such as 3T3-L1 (mouse, for white adipocytes) or primary precursors from brown adipose tissue.
- Differentiation and Treatment:
- Differentiate pre-adipocytes into mature adipocytes using standard hormonal cocktails (insulin, dexamethasone, IBMX).
- Treat mature adipocytes with physiological to supraphysiological concentrations of T3 (e.g., 1-100 nM) for several days (e.g., 4-7 days) to stimulate the browning process.
- Endpoint Analysis:
- Gene Expression: Analyze mRNA levels of brown/beige fat markers (e.g., UCP1, CIDEA, PGC1α) and TH-target genes via RT-qPCR.
- Protein Analysis: Confirm UCP1 protein upregulation using western blotting or immunofluorescence.
- Functional Assays: Measure cellular oxygen consumption rate (OCR) using a Seahorse Analyzer to confirm enhanced thermogenic capacity.
Key Animal Models and Applications
Animal models are essential for studying the integrated physiology of THs in metabolism, thermogenesis, and energy balance.
Standard Rodent Models (Mice and Rats)
Mice (Mus musculus), particularly C57BL/6J, and Wistar rats are the most common models due to their well-characterized physiology and genetic tractability [40] [41].
Detailed Experimental Protocol: Inducing and Characterizing Thyroid Dysfunction [11]
- Model Induction:
- Hypothyroidism: Administer 0.05% w/w propylthiouracil (PTU) or 0.1% w/w methimazole in drinking water for 4-6 weeks. PTU inhibits thyroperoxidase (TPO), blocking TH synthesis.
- Hyperthyroidism: Administer T4 (e.g., 10-20 µg/100g body weight) via daily intraperitoneal injection or subcutaneous slow-release pellets for 2-3 weeks.
- Phenotypic Validation:
- Serum Analysis: Measure serum TSH, T4, and T3 levels by ELISA to confirm thyroid status.
- Metabolic Phenotyping: Monitor body weight, food intake, and measure resting energy expenditure (indirect calorimetry).
- Body Composition: Use MRI/MRS to quantify fat and lean mass non-invasively [42].
- Tissue Analysis: Post-sacrifice, analyze tissues (BAT, liver, muscle) for gene expression, histology (e.g., BAT lipid droplet size), and metabolite levels.
African Mole-Rats: A Model of Metabolic Adaptation
African mole-rats (Fukomys anselli, Heterocephalus glaber) represent a unique model of naturally evolved low basal metabolism, offering insights into TH adaptations [41].
Key Characteristics and Protocol [41] These rodents exhibit a unique TH phenotype with extremely low serum T4 but rodent-typical T3 levels, challenging the conventional mammalian pattern. To study them:
- Animals: House under species-specific conditions (e.g., high humidity for naked mole-rats).
- Serum TH Quantification: Use validated ELISA kits for total T4 (TT4) and total T3 (TT3), ensuring specificity via spike-and-recovery experiments.
- Tissue Molecular Analysis: Examine thyroid glands histologically for follicle number/size and perform gene expression analyses (e.g., deiodinases, TH transporters) in metabolic tissues.
Table 2: Metabolic and Thyroid Hormone Profiles in Animal Models [11] [41]
| Animal Model | Resting Metabolic Rate | Core Body Temperature | Serum T4 Level | Serum T3 Level | Key Research Application |
|---|---|---|---|---|---|
| Standard Mouse/Rat | Standard | Standard (~37°C) | Standard | Standard | Gold standard for mechanistic studies and drug testing. |
| Hypothyroid Mouse/Rat | Decreased | Decreased | Very Low | Low | Modeling hypometabolic state, weight gain, lipid disorders. |
| Hyperthyroid Mouse/Rat | Increased | Increased | High | High | Modeling hypermetabolism, weight loss, catabolism. |
| Ansell's Mole-Rat | Low | Low | Exceptionally Low | Standard | Natural model of low metabolism and unique TH system regulation. |
| Naked Mole-Rat | Low | Variable / Low | Low | Standard | Natural model of metabolic adaptation, hypoxia tolerance. |
The Scientist's Toolkit: Essential Research Reagents and Materials
This table compiles key reagents and tools for studying TH-mediated metabolic regulation.
Table 3: Key Research Reagent Solutions for TH-Metabolism Studies
| Reagent / Material | Function / Application | Example Use Case |
|---|---|---|
| Primary Hepatocytes (Human/Rat) | In vitro model for hepatic TH metabolism, glucuronidation, and toxicology studies. | Assessing species-specific differences in T4 metabolism induced by drugs [40]. |
| T3 / T4 (for treatment) | To induce hyperthyroid conditions or physiological stimulation in vitro and in vivo. | Adding T3 to adipocyte cultures to stimulate UCP1 expression and browning [11]. |
| Propylthiouracil (PTU) | Chemical inhibitor of thyroperoxidase (TPO); induces hypothyroidism in vivo. | Administering PTU in drinking water to create a hypothyroid rodent model [11]. |
| Validated ELISA Kits | Quantification of total or free T4, T3, and TSH levels in serum and culture media. | Measuring hormone levels to validate thyroid status in experimental animals [41]. |
| LC-MS/MS | Gold-standard analytical technique for precise quantification of THs and their metabolites. | Measuring T4, T4-glucuronide, and T4-sulfate in hepatocyte culture medium [40]. |
| MRS (Magnetic Resonance Spectroscopy) | Non-invasive method to quantify ectopic lipids, glycogen, and energy metabolites in live animals/humans. | Tracking hepatic lipid content and fatty acid composition in response to TH status [42]. |
| Seahorse Analyzer | Real-time measurement of cellular metabolic fluxes (OCR, ECAR). | Confirming increased mitochondrial respiration in T3-treated brown adipocytes [11]. |
Advanced and Emerging Research Techniques
Non-Invasive Metabolic Phenotyping with MRS
Magnetic Resonance Spectroscopy (MRS) allows for non-invasive, longitudinal investigation of metabolism in live animals and humans, providing a powerful tool for monitoring interventions [42].
- ¹H-MRS: The gold-standard for quantifying ectopic lipid depots in liver and muscle. It can differentiate intramyocellular lipids (IMCL) from extramyocellular lipids (EMCL) and, with advanced processing, characterize fatty acid composition (SFA, MUFA, PUFA) to infer de novo lipogenesis [42].
- ³¹P-MRS: Used to investigate energy metabolism by quantifying high-energy metabolites like adenosine triphosphate (ATP) and creatine phosphate (PCr) [42].
- ¹³C-MRS and Deuterium MRS: Enable tracer studies to track metabolic fluxes. For example, incorporating ¹³C-labeled fatty acids into a meal allows tracking of meal-derived lipid storage in the liver [42].
Exploring the Gut-Thyroid Axis
Emerging research highlights the gut microbiota's role in thyroid hormone metabolism, opening new avenues for investigation [43].
Mechanisms and Research Approaches [43]
- Molecular Mimicry: Specific bacterial genera (e.g., Lactobacilli, Bifidobacteria) share protein similarities with thyroid proteins (thyroglobulin, TPO), potentially triggering autoimmune reactivity.
- Bacterial Enzymes: The gut microbiome produces enzymes that directly metabolize T3 and T4, influencing systemic hormone availability. Lipopolysaccharides (LPS) can modulate deiodinase activity.
- Iodine Absorption: The microbiota influences the uptake of iodine, a critical component of THs, by modulating the sodium/iodine symporter (NIS).
- Experimental Models: Use germ-free mice, administer specific probiotics (e.g., Bifidobacterium), or induce dysbiosis with antibiotics to study causal relationships between microbial communities and host TH status.
Thyroid hormones (THs), primarily thyroxine (T4) and the biologically active triiodothyronine (T3), are principal regulators of basal metabolic rate (BMR), energy expenditure, and thermogenesis [11] [4]. They exert pleiotropic effects on metabolic tissues, coordinating systemic energy homeostasis by modulating carbohydrate, lipid, and protein metabolism [2] [11]. The physiological effects of THs are mediated through genomic and non-genomic pathways. Genomic actions involve T3 binding to nuclear thyroid hormone receptors (TRα and TRβ), which heterodimerize with the retinoid X receptor (RXR) and bind to thyroid hormone response elements (TREs) in target gene promoters [11]. Key metabolic tissues—the liver, white adipose tissue (WAT), brown adipose tissue (BAT), skeletal muscle, and pancreas—express these receptors and deiodinase enzymes that locally activate or inactivate THs, making them central players in thyroid hormone-mediated metabolic control [11] [44]. This review delineates the specific metabolic functions of these tissues and frames their roles within the context of TH regulation of basal metabolism.
White and Brown Adipose Tissue: Energy Storage and Dissipation
Adipose tissue is a primary target of thyroid hormones and is crucial for whole-body energy balance. Once considered a simple energy storage depot, it is now recognized as a complex endocrine organ [45] [46].
Adipose Tissue Typology and Characteristics
Mammals possess three primary types of adipocytes with distinct functions, morphologies, and regulation [45] [44].
Table 1: Characteristics of White, Brown, and Beige Adipocytes
| Adipocyte Type | Primary Function | Morphology | Key Marker | Mitochondrial Density |
|---|---|---|---|---|
| White (WAT) | Energy storage, Endocrine signaling | Unilocular lipid droplet | Leptin, Adiponectin | Low |
| Brown (BAT) | Adaptive thermogenesis | Multilocular lipid droplets | UCP1 | High |
| Beige/Brite | Inducible thermogenesis within WAT | Multilocular | UCP1, PGC1α | Inducible to High |
White adipocytes are characterized by a large, single lipid droplet and are specialized for storing excess energy as triacylglycerols (TAGs) [45]. They secrete adipokines like leptin and adiponectin, which have systemic effects on energy balance and insulin sensitivity [45]. In contrast, brown adipocytes contain multiple, smaller lipid droplets and a high density of mitochondria, giving the tissue its characteristic color [45]. Their thermogenic capacity is conferred by uncoupling protein 1 (UCP1), a mitochondrial inner membrane protein that short-circuits the proton gradient, dissipating chemical energy as heat [45]. Beige or "brite" (brown-in-white) adipocytes represent a inducible form of thermogenic fat that appears within traditional WAT depots in response to stimuli like cold exposure, exercise, or specific hormones [45] [11]. Beige adipocytes arise from distinct precursors or through the transdifferentiation of existing white adipocytes [45].
Thyroid Hormone Regulation of Adipose Tissue Biology
Thyroid hormones are critical regulators of adipogenesis, lipid metabolism, and thermogenesis in both WAT and BAT.
- Adipogenesis and Gene Expression: T3 regulates the expression of key transcription factors like CCAAT/enhancer-binding proteins (C/EBPs) and peroxisome proliferator-activated receptor gamma (PPARγ), which are master regulators of adipocyte differentiation [44]. T3 also directly regulates genes involved in lipogenesis (e.g., fatty acid synthase, acetyl-CoA carboxylase) and lipolysis [44].
- Thermogenesis: In BAT, T3 is a potent activator of Ucp1 gene expression [44]. The synergistic action of T3 and noradrenergic signaling from the sympathetic nervous system is required for full adaptive thermogenesis. T3 also promotes mitochondrial biogenesis in brown and beige adipocytes [11] [44].
- The "Browning" of White Fat: T3 and its analogs can induce the "browning" or "beiging" of WAT, whereby white adipocytes acquire a thermogenic, energy-dissipating phenotype [11]. This process involves the upregulation of UCP1 and other BAT-selective genes and is considered a potential therapeutic strategy for obesity and metabolic disease [11].
The local availability of active T3 in adipose tissue is tightly controlled by deiodinases. Type 2 deiodinase (D2) is highly expressed in BAT and is upregulated during adipocyte differentiation and in response to adrenergic stimulation, increasing local T3 production [44]. Conversely, type 3 deiodinase (D3) is activated during proliferation and inactivates T3, providing a fine-tuning mechanism for TH action [44].
Table 2: Key Regulators of Adipose Tissue Thermogenesis
| Regulator | Target Process | Mechanism of Action | Effect on Energy Expenditure |
|---|---|---|---|
| T3 | UCP1 expression, Mitochondrial biogenesis | Genomic action via TR/RXR binding to TREs | Increased |
| Noradrenaline | Lipolysis, D2 expression, UCP1 activation | β-adrenergic receptor signaling | Increased |
| PGC1α | Mitochondriogenesis, UCP1 transcription | Co-activation of transcription factors (TR, PPARγ) | Increased |
| Leptin | Appetite regulation, Sympathetic tone | Action on hypothalamic centers | Indirect increase |
Liver: The Metabolic Powerhouse
The liver is a central organ in intermediary metabolism and a key target for thyroid hormones.
Core Metabolic Functions
The liver maintains energy homeostasis by regulating glucose and lipid metabolism. It stores glucose as glycogen (glycogenesis) and produces new glucose from non-carbohydrate precursors (gluconeogenesis) during fasting [2]. It is also the primary site for de novo lipogenesis (DNL), the synthesis of fatty acids from carbohydrates, and for cholesterol synthesis and metabolism [2] [11]. The liver packages lipids into very-low-density lipoproteins (VLDL) for export to other tissues.
Thyroid Hormone Integration
THs profoundly influence hepatic metabolism. They increase basal metabolic rate and oxygen consumption in the liver [2] [4]. T3 stimulates gluconeogenesis and glycogenolysis, increasing the availability of glucose substrates [11]. Thyroid hormones also regulate lipid metabolism in the liver; hyperthyroidism is associated with reduced cholesterol levels due to increased clearance of low-density lipoproteins (LDL), while hypothyroidism promotes hypercholesterolemia [11]. The liver expresses type 1 deiodinase (D1), which contributes to systemic T3 production by converting circulating T4 to T3 [11].
Skeletal Muscle: Glucose Disposal and Thermogenesis
Skeletal muscle is the major site for insulin-stimulated glucose uptake and disposal and a significant contributor to whole-body thermogenesis.
Metabolic Roles
Postprandial glucose homeostasis is largely determined by skeletal muscle's capacity to take up and oxidize glucose. Muscle also oxidizes fatty acids for energy and serves as a reservoir for amino acids and glycogen.
Thyroid Hormone Integration
THs increase the expression of the glucose transporter GLUT4 and enhance glucose oxidation in skeletal muscle [11]. They also influence muscle fiber type composition, promoting the development of fast-twitch (type II) fibers, which are capable of powerful contractions [2]. Furthermore, skeletal muscle can contribute to thermogenesis through both shivering and non-shivering mechanisms. While it lacks UCP1, skeletal muscle possesses other mechanisms for energy dissipation, such as the sarco/endoplasmic reticulum Ca2+-ATPase (SERCA) pump, whose activity is modulated by THs [2]. Muscle expresses D2, allowing for local conversion of T4 to the active T3, which fine-tunes its metabolic responses [4].
Pancreas: Blood Glucose Homeostasis
The pancreas, specifically the β-cells of the islets of Langerhans, is essential for maintaining normoglycemia through the secretion of insulin.
Metabolic Roles
In response to elevated blood glucose, pancreatic β-cells secrete insulin, which promotes glucose uptake in muscle and adipose tissue, inhibits gluconeogenesis in the liver, and stimulates glycogenesis and lipogenesis.
Thyroid Hormone Integration
Thyroid hormones influence insulin secretion and glycemic control. They can induce proinsulin gene expression via the PI3K-AKT pathway [11]. Both hyper- and hypothyroidism have been associated with insulin resistance, and thyroid dysfunction can impair glucose homeostasis, highlighting the interplay between these endocrine systems [11]. Altered thyroid status is a risk factor for the development of type 2 diabetes (T2D) [11].
Experimental Approaches and Research Toolkit
Understanding tissue-specific metabolism and TH action relies on a suite of well-established experimental models and reagents.
In Vivo and In Vitro Models
- Animal Models: Genetically engineered mouse models are indispensable. For instance, Thrα1E403X/+ heterozygous mice faithfully recapitulate human Resistance to Thyroid Hormone alpha (RTHα), exhibiting delayed growth, neurological deficits, and altered thyroid function tests (increased T3, low T4/T3 ratio) [47]. RXR-γ-deficient mice also display a phenotype of thyroid hormone resistance and increased metabolic rate [48].
- Cell Culture: Murine preadipocyte cell lines (e.g., 3T3-L1, 3T3-F442A) are standard models for studying white adipocyte differentiation [44]. Primary cultures of brown and beige adipocytes are used to investigate thermogenesis.
Key Research Reagents and Assays
Table 3: Essential Research Reagents and Methodologies for Metabolic and Thyroid Research
| Reagent / Assay | Function/Application | Technical Notes |
|---|---|---|
| Free T4 & T3 ELISA | Measures biologically active hormone fractions | More accurate than total hormone assays for assessing metabolic status [37]. |
| TSH Assay | Screening for primary thyroid dysfunction | Used in feedback loop assessment with T4/T3 [2] [4]. |
| Oxygen Consumption Respirometry | Direct measurement of cellular or tissue metabolic rate | Used to assess BMR/RMR and tissue-specific thermogenesis [37]. |
| TRβ-selective agonists (e.g., KB141, MB07811) | Experimental therapeutics to modulate metabolism | Can reduce glycemia and lower cholesterol with reduced cardiac side effects [11]. |
| Deiodinase Inhibitors | To block local T3 production or inactivation | Used to dissect the role of specific deiodinases (D1, D2, D3) [44]. |
| Western Blot / qPCR for Metabolic Markers | Analysis of UCP1, PGC1α, PPARγ, etc. | Standard for evaluating thermogenic activation and adipogenesis [45] [44]. |
Experimental Protocol: Measuring Resting Metabolic Rate (RMR) and Correlation with Thyroid Hormones
A field-based approach for measuring RMR and its correlation with thyroid hormones in animal models involves the following steps [37]:
- Animal Preparation: Capture free-ranging subjects and ensure they are post-absorptive (fasted for a sufficient duration based on species).
- RMR Measurement: Use open-flow respirometry in a thermoneutral chamber to measure oxygen consumption (O₂) and carbon dioxide production (CO₂) over a defined period (e.g., 4 hours). The chamber temperature must be within the species' thermoneutral zone to obtain a resting measurement.
- Blood Sampling: Collect a blood sample immediately after the metabolic measurement.
- Hormone Analysis: Use commercial immunoassays (e.g., ELISA) to measure plasma levels of free T3 and free T4 from the blood sample.
- Data Analysis: Perform correlation analysis between the RMR value (derived from gas exchange) and the circulating free T3 levels. Studies in birds have shown that RMR correlates with T3, but not with T4 or daily energy expenditure (DEE), suggesting T3 is a better proxy for resting metabolism [37].
Signaling Pathway Visualizations
Thyroid Hormone Synthesis and Regulation
T3 Genomic Action and Thermogenesis in Brown Adipocyte
The liver, white and brown adipose tissue, skeletal muscle, and pancreas perform non-redundant, specialized metabolic functions that are intricately coordinated by thyroid hormones. WAT and BAT act as complementary organs for energy storage and dissipation, respectively, with THs being a critical driver of adipocyte differentiation, lipid flux, and the browning process. The liver, muscle, and pancreas integrate TH signals to regulate systemic glucose and lipid homeostasis. The development of sophisticated experimental models, including tissue-specific TR knockout mice and RTHα models, coupled with standardized assays for metabolic phenotyping, continues to elucidate the complex mechanisms underlying TH-mediated metabolic control. A deep understanding of these tissue-specific roles, framed within the context of thyroid physiology, is fundamental for developing novel therapeutic strategies for obesity, type 2 diabetes, and related metabolic disorders.
The hypothalamic-pituitary-thyroid (HPT) axis serves as the master regulator of thyroid hormone (TH) production, exerting profound influence on basal metabolic rate (BMR) and systemic energy homeostasis. Current therapeutic strategies targeting this axis primarily involve hormone replacement and suppression therapies. However, emerging research reveals significant limitations in these approaches, particularly their inability to restore tissue-specific thyroid hormone sensitivity and address the nuances of peripheral TH metabolism. This whitepaper synthesizes current evidence on HPT axis-targeted therapies, highlighting the disconnect between standard thyroid function tests and metabolic outcomes. We examine novel therapeutic directions and provide detailed experimental methodologies for evaluating metabolic parameters in thyroid research, offering drug development professionals a comprehensive resource for advancing metabolic management strategies.
The hypothalamic-pituitary-thyroid axis regulates the synthesis and secretion of thyroid hormones, which are essential modulators of basal metabolic rate, thermogenesis, and substrate metabolism [49] [11]. Thyrotropin-releasing hormone (TRH) from the hypothalamus stimulates pituitary secretion of thyroid-stimulating hormone (TSH), which in turn stimulates thyroid production of thyroxine (T4) and triiodothyronine (T3) [50]. This system is maintained through negative feedback loops, where circulating TH levels modulate TRH and TSH secretion [49].
The critical role of TH in metabolic regulation is mediated through both genomic and non-genomic mechanisms. Genomically, T3 binds to nuclear thyroid receptors (TRα and TRβ), forming heterodimers with retinoid X receptors to modulate gene transcription involved in metabolic processes [11] [50]. Non-genomic actions occur through interactions with cell membrane receptors and cytoplasmic signaling proteins, enabling rapid modulation of cellular processes [11]. Through these mechanisms, TH influences fundamental metabolic parameters including BMR, which can vary significantly even among euthyroid individuals [25].
Current Therapeutic Approaches Targeting the HPT Axis
Conventional Pharmacotherapies
Table 1: Current Pharmacological Approaches Targeting the HPT Axis
| Therapy Class | Representative Agents | Primary Mechanism | Key Metabolic Impacts | Clinical Considerations |
|---|---|---|---|---|
| Hormone Replacement | Levothyroxine (LT4) | Synthetic T4 replacement; normalizes TSH | Increases BMR; reduces cholesterol; may modestly improve weight parameters [51] | Standard care for hypothyroidism; limited impact on tissue T3 levels |
| Combination Therapy | LT4 + Liothyronine (T3) | Direct T4 and T3 replacement | Theoretical improvement in metabolic parameters; evidence remains inconclusive | Limited robust clinical trial support; risk of supraphysiological T3 levels |
| TSH Suppression Therapy | Supraphysiological LT4 | Suppresses TSH via negative feedback | Potential for increased BMR; catabolic effects | Cardiovascular risks (atrial fibrillation, LVH); bone mineral density concerns |
| TH Analogues | Resmetirom, Eprotirome | Selective TRβ agonism | Hepatic lipid reduction; improved lipid profile; potential glucose benefits | Tissue-specific action; avoids extrahepatic adverse effects |
Current therapeutic strategies primarily target different levels of the HPT axis. Hormone replacement with levothyroxine (LT4) remains the cornerstone for treating hypothyroidism, aiming to restore physiological TH levels and normalize TSH [51]. While effective at correcting thyroid function tests, LT4 monotherapy demonstrates limitations in fully resolving metabolic abnormalities in some patients, potentially due to inadequate restoration of tissue T3 levels [51] [52].
For resistant cases, combination therapy with LT4 and liothyronine (synthetic T3) has been explored to address potential conversion impairments, though meta-analyses show inconsistent metabolic benefits [51]. At the other extreme, supraphysiological LT4 doses to suppress TSH are employed in thyroid cancer management but carry significant cardiometabolic risks, including increased heart rate, atrial fibrillation risk, and left ventricular hypertrophy [49].
Emerging selective thyroid hormone receptor agonists represent a promising avenue for targeting metabolic parameters while minimizing adverse effects. These agents preferentially activate TRβ receptors abundant in the liver, promoting lipid metabolism and reducing cholesterol with potentially reduced cardiac side effects [11].
Non-Pharmacological Interventions
Table 2: Non-Pharmacological Interventions with HPT Axis Implications
| Intervention | Mechanism | Metabolic Outcomes | Evidence Status |
|---|---|---|---|
| Bariatric Surgery | Weight loss; altered gut anatomy affecting absorption | Normalization of TSH; improved insulin sensitivity; requires LT4 dose adjustment [51] | Established for severe obesity with thyroid dysfunction |
| Mediterranean Diet | Anti-inflammatory effects; improved insulin sensitivity | Supports lipid control and glycemic parameters; may modulate HPT setpoint [50] | Observational support; limited randomized trials |
| Structured Exercise | Modulation of deiodinase activity; improved tissue sensitivity | Enhanced cardiovascular health; potential optimization of tissue TH action [50] | Preliminary evidence in RTH syndromes; requires validation |
| Temperature Adaptation | Physiological adjustment to environmental demands | Altered TSH setpoint with seasonal variation [53] | Epidemiological observations; clinical significance uncertain |
Non-pharmacological approaches demonstrate significant interactions with the HPT axis, particularly through weight modification. Bariatric surgery frequently normalizes elevated TSH levels in obese patients, independent of LT4 therapy, suggesting a bidirectional relationship between adiposity and HPT axis function [51]. Dietary interventions, particularly the Mediterranean diet, show promise in supporting metabolic parameters in conditions like resistance to thyroid hormone beta (RTHβ), potentially through anti-inflammatory mechanisms and improved insulin sensitivity [50].
Physical activity modulates tissue-specific thyroid hormone sensitivity, with aerobic exercise demonstrating particular benefits for cardiovascular parameters in RTH syndromes [50]. Environmental temperature also influences HPT axis setpoints, with cold exposure increasing TSH secretion as an adaptive thermogenic response [53]. These non-pharmacological approaches highlight the integration of the HPT axis with broader physiological and environmental factors in metabolic regulation.
Limitations of Current Therapeutic Paradigms
Tissue-Specific Limitations and Sensitivity Disorders
A fundamental limitation of current HPT-axis therapies lies in their focus on circulating hormone levels rather than tissue-specific hormone action. Inherited disorders of thyroid hormone transport, metabolism, and receptor function illustrate this challenge. Monocarboxylate transporter 8 (MCT8) deficiency impairs neuronal T3 uptake, causing severe neurological defects despite normal circulating TH levels [50]. Similarly, resistance to thyroid hormone (RTH) syndromes from TRα or TRβ mutations creates tissue-specific hypothyroidism or hyperthyroidism despite abnormal TSH levels [50].
Even in the general population, impaired sensitivity to thyroid hormones within the reference range associates with metabolic syndrome severity. A cross-sectional study of 17,272 euthyroid adults demonstrated that various indices of thyroid hormone sensitivity (TFQI, PTFQI, TSHI, TT4RI) positively correlated with metabolic syndrome risk and severity [54]. This continuum of tissue responsiveness remains undetectable by standard thyroid function tests and unaddressed by current therapies.
The Conversion Dilemma: Beyond TSH Normalization
The peripheral conversion of T4 to active T3 represents another critical limitation in current therapeutic approaches. Approximately 80% of circulating T3 derives from peripheral deiodination rather than direct thyroid secretion [11]. This conversion is regulated by tissue-specific deiodinases (DIO1, DIO2, DIO3) whose activity varies significantly among individuals and is influenced by factors including illness, nutrients, and medications [11].
LT4 monotherapy assumes intact peripheral conversion capacity, which may not reflect individual patient physiology. This is particularly relevant given the association between the FT3/FT4 ratio (a marker of conversion efficiency) and metabolic syndrome, even in euthyroid individuals [54]. The inadequacy of TSH as the sole treatment target is further highlighted by the "rebound effect" of hypothalamic-pituitary thyrotropic activity, where the TSH response to hypothyroidism varies by age, BMI, and prior LT4 dosage [52].
Experimental Methodologies for Metabolic Assessment
Protocol 1: Basal Metabolic Rate Measurement via Indirect Calorimetry
Background: BMR represents the energy expenditure required to maintain basic physiological functions at rest and is a primary endpoint for assessing thyroid hormone metabolic effects [25]. Thyroid hormones significantly influence BMR through mitochondrial biogenesis, Na+/K+ ATPase activity, and thermogenesis [49] [11].
Methodology Details:
- Participant Preparation: Overnight fast (12 hours), abstinence from caffeine, alcohol, and strenuous exercise for 24 hours prior to testing [25].
- Equipment: Metabolic cart with paramagnetic O2 analyzer and infrared CO2 analyzer (e.g., COSMED Quark RMR) [25].
- Testing Conditions: Quiet, temperature-controlled room (22-24°C); participant resting supine for 30 minutes prior to measurement [25].
- Measurement Protocol: 30-minute testing period with first 5 minutes excluded for apparatus acclimatization; breath-by-breath data collection with steady-state criteria of <10% coefficient of variation for both VO2 and VCO2 [25].
- Data Analysis: Weir equation derivation of energy expenditure (kcal/day) from oxygen consumption (VO2) and carbon dioxide production (VCO2) [25].
Applications: This methodology enables precise quantification of thyroid hormone effects on energy expenditure, particularly relevant for evaluating tissue-specific thyroid hormone action and the metabolic efficacy of TH analogues [25].
Protocol 2: Thyroid Hormone Sensitivity Indices Calculation
Background: Conventional thyroid function tests (TSH, FT4, FT3) may not adequately reflect tissue thyroid hormone action, particularly in resistance syndromes or metabolic disorders [54]. Sensitivity indices provide integrated measures of HPT axis feedback integrity.
Calculation Methodologies:
- Thyroid Feedback Quantile-Based Index (TFQI): Non-parametric index derived from quantiles of TSH and FT4, calculated as TFQI = F(FT4) - F⁻¹(TSH), where F represents empirical cumulative distribution [54].
- TSH Index (TSHI): Logarithmically transformed index: TSHI = lnTSH + 0.1345 × FT4 [54].
- Thyrotroph T4 Resistance Index (TT4RI): TT4RI = FT4 × TSH [54].
- FT3/FT4 Ratio: Marker of peripheral deiodinase activity; calculated as FT3 (pg/mL) / FT4 (ng/dL) [54].
Implementation: These indices utilize standard thyroid function tests but provide enhanced sensitivity for detecting subtle HPT axis disruptions. In a study of 17,272 euthyroid adults, each standard deviation increase in TFQI was associated with a 20% increased metabolic syndrome risk (OR=1.20, 95% CI: 1.15-1.25) [54].
The Scientist's Toolkit: Essential Research Reagents
Table 3: Essential Research Reagents for HPT Axis and Metabolic Studies
| Reagent/Category | Specific Examples | Research Application | Technical Notes |
|---|---|---|---|
| Hormone Assays | Electrochemiluminescence immunoassays (Cobas e411, Mindray BS-480) | Quantification of TSH, FT3, FT4 | Standardized platforms; essential for calculating sensitivity indices [55] [54] |
| Metabolic Phenotyping | Indirect calorimetry systems (COSMED Quark RMR) | Precise BMR measurement | Gold standard for energy expenditure; requires strict protocol adherence [25] |
| Body Composition Analyzers | Bioelectrical impedance analysis (Tanita SC 330ST) | Fat mass, muscle mass, visceral fat assessment | Complementary to hormone measurements; reveals tissue-specific effects [55] |
| Specialized Indices | TFQI, PTFQI, TSHI, TT4RI calculation algorithms | Quantifying thyroid hormone resistance | Software implementation required for large-scale studies [54] |
| Environmental Controls | Temperature monitoring systems | Accounting for seasonal TSH variation | Often overlooked confounder in longitudinal studies [53] |
The therapeutic targeting of the HPT axis for metabolic management is evolving beyond TSH-normalization toward tissue-specific approaches. Future directions include the development of selective thyroid hormone receptor modulators with improved tissue specificity, personalized dosing strategies that incorporate conversion efficiency metrics, and integration of thyroid hormone sensitivity indices into clinical trial design.
The relationship between thyroid function and metabolic regulation extends across a continuum, with variations within the reference range influencing metabolic parameters including basal metabolic rate, body composition, and cardiovascular risk factors [55] [25] [54]. Advanced assessment methodologies, including indirect calorimetry for BMR measurement and sophisticated sensitivity indices, provide the necessary tools to evaluate these subtleties in both basic research and clinical trial settings.
For drug development professionals, acknowledging the limitations of current HPT-axis targeting approaches is essential for designing next-generation therapies. Success will require addressing tissue-specific hormone action, peripheral conversion variability, and the complex interplay between thyroid function and metabolic homeostasis across diverse patient populations.
Thyroid hormones (THs), primarily 3,3′,5,-triiodo-L-thyronine (T3) and thyroxine (T4), are fundamental regulators of basal metabolic rate, growth, and development [56]. Their effects are mediated through two primary thyroid hormone receptor (TR) isoforms, TRα and TRβ, which exhibit distinct tissue distribution and physiological functions [56]. The therapeutic potential of thyroid hormones for metabolic disorders has long been recognized, particularly for their potent cholesterol- and triglyceride-lowering effects [57]. However, the deleterious extra-hepatic effects of thyrotoxicosis, mediated largely by TRα in the heart, bone, and muscle, have precluded their broad therapeutic use [56]. This review details the rigorous development of TRβ-selective agonists, a class of drugs designed to harness the beneficial metabolic effects of thyroid hormone action in the liver while minimizing harmful side effects. We explore the preclinical and clinical journey of these selective thyromimetics, their mechanisms of action, detailed experimental protocols for their evaluation, and their promising application in treating metabolic diseases such as dyslipidemia and metabolic dysfunction-associated steatotopic liver disease (MASLD).
Thyroid hormones are tyrosine-based molecules rich in iodine, with T4 being the primary hormone produced by the thyroid gland [56]. Through the action of deiodinase enzymes (D1 and D2), T4 is converted to the biologically active T3, which exhibits higher affinity for thyroid hormone receptors [56]. The classic genomic actions of THs are mediated by their nuclear receptors, TRα and TRβ, which function as ligand-activated transcription factors [56]. These receptors bind to specific thyroid hormone response elements (TREs) in the regulatory regions of target genes, recruiting co-activators and co-repressors to modulate transcriptional activity [56].
The genes THRA (chromosome 17) and THRB (chromosome 3) encode TRα and TRβ receptors in humans, with the distribution of specific isoforms varying between tissues [56]. TRα is the predominant isoform expressed in the heart, brain, and bone, whereas TRβ is highly expressed in the liver, kidneys, and pituitary gland [56]. This differential expression provides the fundamental rationale for developing TRβ-selective agonists; targeting the β-isoform should yield beneficial hepatic metabolic effects while circumventing adverse effects on cardiovascular and skeletal systems mediated through TRα.
The Rationale for TRβ-Selective Agonism in Metabolic Disease
In the liver, activation of TRβ regulates critical metabolic pathways. It increases energy expenditure through effects on mitochondrial biogenesis and ATP-consuming metabolic cycles, and directly modulates lipid metabolism by enhancing cholesterol serum clearance via low-density lipoprotein (LDL) receptor upregulation, and regulating key enzymes including 3-hydroxy-3-methylglutaryl-coenzyme A reductase (cholesterol biosynthesis) and cholesterol 7α-hydroxylase (CYP7A1, bile acid synthesis) [56]. Preclinical studies in TRβ knockout mice have definitively established that T3 administration cannot modulate CYP7A1 or cholesterol levels in the absence of TRβ, underscoring the crucial and specific role of this receptor isoform in hepatic lipid regulation [56].
The clinical observation that patients with hyperthyroidism exhibit significant reductions in body weight and serum cholesterol further supports the therapeutic potential of thyroid hormone signaling for metabolic disorders [56]. However, the accompanying tachycardia, muscle wasting, bone loss, and other thyrotoxic effects present a formidable safety barrier [57]. Consequently, the primary objective in developing TRβ-selective agonists has been to uncouple the beneficial hepatic and CNS actions from deleterious effects on heart, muscle, and bone.
Evolution of TRβ-Selective Agonists: From Preclinical to Clinical Candidates
The development of TRβ-selective agonists has progressed through several generations, with increasing sophistication in achieving selectivity and tissue-specific targeting.
First-Generation Agonists
Sobetirome (GC-1) and Eprotirome (KB2115) were the first TRβ-selective thyromimetics. Sobetirome represented a significant structural departure from native thyronines, lacking halogens, the biaryl ether oxygen, and the amino-acidic side chain [56]. It demonstrated a 10-fold lower affinity for THRα than T3 without significant loss of affinity to THRβ [58]. Despite promising preclinical data showing efficacy against hypercholesterolemia and non-alcoholic steatohepatitis (NASH), both compounds were halted after Phase 1 and Phase 2-3 clinical trials, respectively, due to the onset of unwanted side-effects [56].
Contemporary Clinical-Stage Agonists
Table 1: Contemporary TRβ-Selective Agonists in Clinical Development
| Compound | Developer | Mechanism | Clinical Stage | Key Efficacy Findings | Safety Profile |
|---|---|---|---|---|---|
| Resmetirom (MGL-3196) | Madrigal Pharmaceuticals | Oral, selective TRβ agonist | Phase 3 | Significant reduction in liver fat (MRI-PDFF); LDL-C reduction (20-25%); NASH resolution (69% vs 29% placebo) [59] | Generally well-tolerated; GI events (diarrhea, nausea) ≥10% vs placebo [59] |
| VK2809 | Viking Therapeutics | Oral, liver-targeted TRβ agonist prodrug | Phase 2b | Statistically significant LDL-C reduction (20+%); liver fat reduction (54-60%); 51% fibrosis improvement [60] | No SAEs reported; excellent GI tolerability; minimal thyroid axis disruption [60] |
| ZTA-261 | Research compound | High THRβ selectivity (modified GC-1/GC-24) | Preclinical | Effective reduction of serum/liver lipids; reduced body fat in HFD mice [58] | Significantly lower bone, cardiac, and hepatotoxicity vs GC-1 [58] |
Structural Optimization Strategies
Recent advances have focused on enhancing safety through two primary strategies: improving TRβ vs. TRα selectivity and increasing liver-specific distribution through prodrug approaches [61]. VK2809 employs a HepDirect prodrug technology that enables liver-targeted delivery, thereby reducing extra-hepatic exposure [60]. ZTA-261 was developed through modification of existing agonists GC-1 and GC-24, achieving higher THRβ selectivity than its predecessors through a highly congested diarylmethane structure [58].
Experimental Protocols for Evaluating TRβ-Selective Agonists
In Vitro Receptor Binding and Selectivity Assessment
Objective: To determine the binding affinity and selectivity of novel compounds for human TRβ versus TRα.
Methodology (as detailed for ZTA-261 evaluation) [58]:
- Receptor Preparation: Full-length human THRα and THRβ coding sequences are cloned into expression vectors (pTNT). Receptors are synthesized using an in vitro transcription/translation system (TNT T7 Quick Coupled Transcription/Translation kit).
- Competitive Binding Assay:
- Incubate 2 μL of in vitro translation mixture with 0.5 nM [125I]-T3 and serially diluted competitors (T3 or test compounds, 10^-5 to 10^-11 M) in E400 buffer.
- Reaction mixture is incubated overnight at 4°C.
- Samples are filtered through nitrocellulose membrane using dot-blot apparatus.
- Membranes are washed, air-dried, and exposed to imaging plate for 4 hours.
- Radioactive signals are quantified using phosphoimager and analyzed with appropriate software.
- Data Analysis: IC50 values are calculated by fitting dose-response data to a log(inhibitor) vs. response model. Selectivity ratio is determined as IC50(THRα)/IC50(THRβ).
In Vivo Efficacy and Safety Evaluation
Objective: To assess metabolic efficacy and potential toxicity of TRβ agonists in animal models of metabolic disease.
Methodology (adapted from ZTA-261 and VK2809 studies) [58] [60]:
- Animal Model: Male C57BL/6J mice are fed a high-fat diet (60% kcal from fat) for 8 weeks to induce obesity.
- Treatment Groups: Animals are randomized to receive vehicle, T3 (0.1 or 1 μmol/kg/day), reference compound (GC-1, 0.1 or 1 μmol/kg/day), or test compound at equivalent doses via intraperitoneal injection or oral gavage.
- Efficacy Endpoints (measured after 4-12 weeks):
- Body weight and visceral adipose tissue mass
- Serum lipids (total cholesterol, triglycerides, LDL-C)
- Liver lipid content (histological assessment or biochemical quantification)
- Expression of TH-induced and lipid metabolism-related genes in liver
- Safety Endpoints:
- Serum alanine aminotransferase (ALT) for hepatotoxicity
- Heart weight and histological examination for cardiac hypertrophy
- Bone density and microstructure analysis
- Thyroid hormone axis parameters (TSH, T4, T3)
Diagram 1: Mechanism of Action of Liver-Targeted TRβ-Selective Agonists. TRβ agonists activate hepatic receptors, leading to transcription of genes involved in lipid metabolism.
Clinical Trial Outcomes and Validation
Recent clinical trials have provided compelling evidence for the efficacy of TRβ-selective agonists in human metabolic disease.
Resmetirom in MASLD/NASH
A 2024 systematic review and meta-analysis of randomized controlled trials evaluated Resmetirom in MASLD treatment [59]. The analysis included 2,234 participants across three clinical trials and demonstrated:
Table 2: Efficacy Outcomes of Resmetirom in MASLD/MASH Treatment
| Parameter | Dose | Duration | Result | Statistical Significance |
|---|---|---|---|---|
| Liver Fat (MRI-PDFF) | 80 mg | 12-16 weeks | SMD -30.92 (95% CI -36.44 to -25.40) | p < 0.00001 |
| Liver Fat (MRI-PDFF) | 80 mg | 36-52 weeks | SMD -27.74 (95% CI -32.05 to -23.42) | p < 0.00001 |
| Liver Fat (MRI-PDFF) | 100 mg | 12-16 weeks | SMD -36.89 (95% CI -40.73 to -33.05) | p < 0.00001 |
| LDL Cholesterol | 80-100 mg | 36-52 weeks | 20-25% reduction | p < 0.01 |
| NASH Resolution | 80-100 mg | 52 weeks | 69% vs 29% (placebo) | p < 0.0001 |
| Fibrosis Improvement | 80-100 mg | 52 weeks | 51% vs 34% (placebo) | p = 0.03 |
Resmetirom treatment also significantly reduced triglycerides, lipoprotein(a), apolipoprotein B, and liver enzymes (ALT, AST) [59]. Safety analysis revealed no major differences in overall treatment-emergent adverse events compared to placebo, though gastrointestinal events (diarrhea and nausea) occurred in ≥10% of Resmetirom-treated patients [59].
VK2809 in NASH
The Phase 2b VOYAGE study evaluated VK2809 in biopsy-confirmed NASH patients with fibrosis [60]. At 52 weeks:
- 63% to 75% of VK2809-treated patients achieved NASH resolution compared with 29% for placebo (p<0.05)
- 44% to 57% showed improvement in fibrosis with no worsening of NASH compared with 34% for placebo (p<0.05 for specific doses)
- Significant reductions in LDL-C (20-25%), apolipoprotein B, and lipoprotein(a) were maintained through 52 weeks
- Excellent gastrointestinal tolerability with minimal differences in nausea, diarrhea, or vomiting compared to placebo [60]
Diagram 2: TRβ-Selective Agonist Development Workflow. The multidisciplinary approach integrates in vitro profiling, in vivo efficacy and safety assessment, and clinical validation.
The Scientist's Toolkit: Essential Research Reagents and Methods
Table 3: Key Research Reagents for TRβ Agonist Development
| Reagent/Assay | Function | Example Protocol/Application |
|---|---|---|
| Human THRα/β Expression Vectors | Source of recombinant receptors for binding studies | Clone full-length human THRA/THRB into pTNT vector; express via in vitro translation [58] |
| [*125I]-T3 Competitive Binding Assay | Measure compound affinity for TR isoforms | Incubate test compounds with receptors and [*125I]-T3; filter through nitrocellulose; quantify displacement [58] |
| Diet-Induced Obesity Models | In vivo efficacy assessment | C57BL/6J mice fed high-fat diet (60% kcal fat) for 8+ weeks; administer test compounds 4-12 weeks [58] |
| MRI-PDFF (Proton Density Fat Fraction) | Quantitative liver fat measurement in clinical trials | Non-invasive imaging endpoint; primary outcome in Phase 2 trials [59] |
| Metabolic Gene Expression Panels | Mechanism of action studies | Quantify expression of TH-responsive genes (LDLR, CYP7A1, SREBP) in liver tissue [58] |
| Liver Histology (NAS Score) | Gold standard for NASH assessment | Biopsy evaluation of steatosis, inflammation, ballooning; key regulatory endpoint [60] |
The development of TRβ-selective agonists represents a compelling example of rational drug design grounded in nuclear receptor pharmacology. By leveraging the distinct tissue distribution and functions of TR isoforms, researchers have successfully engineered compounds that retain the beneficial metabolic effects of thyroid hormones while minimizing extra-hepatic toxicity. The consistent demonstration of efficacy in reducing liver fat, improving serum lipid profiles, and resolving NASH across multiple clinical candidates validates TRβ as a therapeutic target for metabolic diseases.
Future directions in this field include:
- Combination therapies with other metabolic agents (e.g., GLP-1 receptor agonists, FGF21 analogs)
- Expansion into additional indications including neurodegenerative diseases where remyelination may be promoted by TRβ activation [56]
- Further refinement of tissue selectivity through advanced prodrug technologies and novel chemical entities
The promising clinical results from Resmetirom and VK2809 suggest that after decades of research, TRβ-selective agonists may soon become an important therapeutic option for patients with MASLD/MASH and associated metabolic disorders, fulfilling the long-standing promise of thyroid hormone mimetics in metabolic disease therapy.
Thyroid hormones are master regulators of energy expenditure and basal metabolic rate (BMR). While the roles of T3 and T4 are well-established, recent investigation has focused on endogenous metabolites, particularly 3,5-diiodo-L-thyronine (3,5-T2), as potential therapeutic agents for metabolic diseases. This whitepaper synthesizes current evidence on 3,5-T2's mechanisms, efficacy, and safety profile in preclinical models of obesity and non-alcoholic fatty liver disease (NAFLD). We examine its dual genomic and non-genomic actions, summarize quantitative outcomes from key studies, detail experimental methodologies, and address controversies in the field. The analysis indicates that 3,5-T2 exerts potent anti-steatotic and insulin-sensitizing effects primarily through mitochondrial targeting, though species-specific responses and potential cardiac effects necessitate further investigation before clinical translation.
Thyroid hormones, particularly triiodothyronine (T3) and thyroxine (T4), are fundamental regulators of mammalian energy homeostasis, thermogenesis, and basal metabolic rate [20]. Their canonical genomic actions mediated through nuclear thyroid hormone receptors (TRα and TRβ) regulate transcription of genes involved in oxidative phosphorylation, substrate metabolism, and mitochondrial biogenesis [20]. Even within the euthyroid range, variations in thyroid hormone levels correlate with metabolic rate alterations, with free T3 demonstrating particularly strong association with BMR independent of age, sex, and body composition [25]. Beyond these established pathways, thyroid hormone metabolites have emerged as significant bioactive molecules with distinct properties.
Among these metabolites, 3,5-diiodo-L-thyronine (3,5-T2) has garnered significant research interest due to its potent metabolic effects without inducing overt thyrotoxicosis [62] [63]. First identified in the 1970s as an endogenous metabolite in human serum, 3,5-T2 demonstrates unique properties distinct from T3 [63] [64]. Early clinical observations from the 1930s documented that 3,5-T2 administration relieved myxedema symptoms without causing tachycardia or other characteristic hyperthyroid side effects [63]. Contemporary research has refocused on 3,5-T2 as a potential therapeutic agent for obesity-related metabolic disorders, particularly hepatic steatosis and insulin resistance [62] [65].
Mechanisms of Action: Genomic and Non-Genomic Pathways
3,5-T2 exerts its metabolic effects through both canonical thyroid hormone receptor-mediated pathways and distinctive non-genomic mechanisms, with particular emphasis on mitochondrial targets.
Non-Genomic Mitochondrial Actions
The most characterized mechanism of 3,5-T2 involves direct mitochondrial actions that enhance energy expenditure:
Respiration and Substrate Oxidation: 3,5-T2 rapidly stimulates hepatic oxygen consumption and fatty acid β-oxidation [63] [65]. This effect occurs within minutes, suggesting direct interaction with mitochondrial complexes rather than transcriptional activation.
Uncoupling and Redox Modulation: Treatment enhances mitochondrial uncoupling and modifies the cellular redox state, increasing cytosolic NADH/NAD⁺ ratio while decreasing mitochondrial NADH/NAD⁺ ratio, thereby optimizing substrate oxidation [62].
Phosphate Potential Regulation: 3,5-T2 decreases mitochondrial phosphate potential (ATP/ADP ratio) while increasing cytosolic ATP/ADP ratio, indicating enhanced mitochondrial metabolic efficiency and energy transfer [62].
Genomic and Nuclear Receptor Interactions
Despite its primary mitochondrial localization, 3,5-T2 demonstrates some nuclear activity:
Receptor Binding Affinity: 3,5-T2 exhibits at least 100-fold lower affinity for nuclear thyroid hormone receptors compared to T3 [66]. However, at higher concentrations, it can activate TRβ-mediated transcription.
Gene Expression Modulation: In various models, 3,5-T2 administration modifies expression of genes involved in lipid oxidation, storage, and export, though specific transcriptional targets vary significantly between studies and species [66].
The following diagram illustrates the integrated mechanisms of 3,5-T2 action:
Quantitative Outcomes in Preclinical Models
Research across multiple animal models demonstrates consistent metabolic benefits of 3,5-T2 administration, though with some contradictory findings.
Anti-Obesity and Adipose Tissue Effects
Table 1: Effects of 3,5-T2 on Adipose Tissue and Body Composition in Preclinical Models
| Model | Dose & Duration | Body Weight/Composition | Adipose Tissue Effects | Reference |
|---|---|---|---|---|
| P. obesus (gerbils) | 25 µg/100g BW/day for 5 weeks | Reduced body weight gain | ↓ Visceral adipose tissue mass, ↑ Brown adipose tissue | [62] |
| Male Wistar rats | 250 µg/kg/day for 4 weeks | Reduced metabolic efficiency | ↓ Retroperitoneal fat mass, improved glucose tolerance | [65] [67] |
| Male Wistar rats (long-term HFD) | Daily injection for 4 weeks (last 4 of 14 weeks) | Not reported | ↓ Macrophage infiltration, ↓ Pro-inflammatory cytokines, improved adipose tissue inflammation | [67] |
Hepatic Steatosis and Metabolic Parameters
Table 2: Effects of 3,5-T2 on Hepatic Steatosis and Metabolic Parameters
| Parameter | P. obesus Model [62] | Wistar Rat Model [65] | Sprague Dawley Rats [66] |
|---|---|---|---|
| Hepatic Lipid Content | Reversed liver steatosis | Reduced pre-existing fat accumulation | No significant effect |
| Glucose Metabolism | Attenuated hyperglycemia, prevented insulin resistance | Not reported | No improvement in whole-body insulin sensitivity |
| Lipid Metabolism | Improved dyslipidemia | Reduced hyperlipidemia | No effect on plasma fatty acids |
| Mitochondrial Function | Enhanced respiration capacity, increased ketogenesis | Uncoupling of mitochondrial respiration | Not assessed |
| Hepatic Insulin Signaling | Not assessed | Not assessed | Improved Akt phosphorylation (2.5-fold) |
Experimental Protocols and Methodologies
In Vivo Dosing and Administration
Standardized protocols for 3,5-T2 administration have been established across multiple rodent studies:
Animal Models: Research primarily utilizes male Wistar rats, Sprague-Dawley rats, and Psammomys obesus gerbils maintained at thermoneutrality (28°C) to minimize cold-induced thermogenesis [62] [65] [67].
Dosing Protocols: Effective doses range from 25-250 µg/kg body weight/day administered via subcutaneous pellet implantation or intraperitoneal injection for 4-10 weeks [62] [66] [67]. The subcutaneous pellet method provides continuous release, mimicking endogenous secretion patterns.
Dietary Induction: Metabolic syndrome is typically induced using high-fat diets (HFD) containing 27-59% fat calories for 4-14 weeks before and/or during 3,5-T2 treatment [66] [67].
Control Groups: Properly designed studies include multiple control groups: (1) normal diet controls, (2) HFD controls, and (3) HFD with vehicle controls to distinguish diet versus treatment effects [62].
The experimental workflow for in vivo investigation of 3,5-T2 is summarized below:
In Vitro Hepatocyte Studies
Isolated hepatocyte systems allow precise investigation of 3,5-T2 mechanisms:
Hepatocyte Isolation: Hepatocytes are isolated via collagenase perfusion from treated animals or naive controls followed by plating in appropriate media [62].
3,5-T2 Incubation: Freshly isolated hepatocytes are incubated with 3,5-T2 at concentrations ranging from 10⁻⁹ M to 10⁻⁶ M for acute exposure studies [62].
Functional Assays: Key measurements include oxygen consumption using Clark-type electrodes, glucose output, ketone body production, and substrate oxidation rates [62].
Metabolite Profiling: Assessment of glycolytic/gluconeogenic intermediates (phosphoenolpyruvate, glucose-6-phosphate), redox states (NADH/NAD⁺ ratios), and energy charge (ATP/ADP ratios) provide mechanistic insights [62].
The Scientist's Toolkit: Essential Research Reagents
Table 3: Key Reagents and Resources for 3,5-T2 Research
| Reagent/Resource | Specifications | Research Application | Example Sources |
|---|---|---|---|
| 3,5-T2 Compound | >95% purity, soluble in NaOH-neutralized PBS | In vivo administration and in vitro treatments | Sigma-Aldrich [66] [67] |
| Animal Models | Male Wistar rats, Sprague-Dawley rats, P. obesus gerbils | In vivo metabolic studies | Charles River, Harlan Laboratories [62] [66] |
| High-Fat Diets | 27-59% fat calories, safflower or lard-based | Induction of obesity and hepatic steatosis | Dyets, Inc. [66] |
| Metabolic Cages | Indirect calorimetry systems | Measurement of oxygen consumption, RER, energy expenditure | Columbus Instruments, Sable Systems [62] |
| CLIA/Kits | Chemiluminescence immunoassays, ELISA kits | Measurement of 3,5-T2, cytokines, hormones | Commercial custom assays [64] [67] |
| Mitochondrial Respirometry | Oxygraph systems with substrate/inhibitor suites | Assessment of mitochondrial function | Oroboros Instruments [62] |
Safety Considerations and Controversies
The therapeutic promise of 3,5-T2 must be balanced against important safety concerns and contradictory findings:
Cardiac Effects: Although 3,5-T2 was initially considered free of cardiac thyrotoxicity, studies report suppressed TSH, increased heart rate, and cardiomegaly at higher doses (250 µg/kg/day), indicating potential TRβ-mediated effects [64] [66].
HPT Axis Suppression: 3,5-T2 administration suppresses the hypothalamic-pituitary-thyroid axis, reducing circulating T4 and T3 levels, which may limit long-term therapeutic utility [64] [67].
Contradictory Efficacy Data: While most studies demonstrate anti-steatotic effects, some report no improvement in hepatic lipid content or whole-body insulin sensitivity, potentially reflecting model-specific differences (e.g., Sprague-Dawley vs. Wistar rats) or variations in HFD composition [66].
Analytical Challenges: Reliable 3,5-T2 measurement remains problematic, with significant variability between immunoassays and mass spectrometry methods, complicating dose-response assessment and pharmacokinetic studies [64].
3,5-T2 represents a promising thyroid hormone metabolite with potent anti-obesity and anti-steatotic activities in preclinical models. Its primary mechanisms involve mitochondrial targeting that enhances hepatic fat oxidation and energy expenditure, largely independent of nuclear receptor activation. However, translation to clinical applications requires resolution of key challenges:
Immediate research priorities include standardized pharmacokinetic and safety profiling across species, development of tissue-specific delivery systems to minimize extrahepatic exposure, and identification of the precise mitochondrial molecular targets. Technical advancements in analytical methods for reliable 3,5-T2 quantification are essential for dose optimization. The conflicting data between research groups highlights the need for standardized protocols and reproducible model systems.
While 3,5-T2 cannot replace established medical treatments for obesity and NAFLD, it offers a novel therapeutic strategy targeting mitochondrial energy metabolism. Future work should focus on developing synthetic analogues that retain 3,5-T2's beneficial metabolic effects while eliminating HPT axis suppression and cardiac actions, potentially yielding safer therapeutic candidates for metabolic syndrome.
Navigating Clinical Complexities: Thyroid Dysfunction in Metabolic Disease
Thyroid hormones (THs), principally thyroxine (T4) and triiodothyronine (T3), are fundamental to the control of the body's basal metabolic rate (BMR) and energy homeostasis [2] [4]. They act as key nuclear hormone regulators, influencing the transcription of genes involved in macronutrient metabolism, thermogenesis, and oxygen consumption [2]. The hypothalamic-pituitary-thyroid (HPT) axis maintains TH balance through a classic negative feedback loop: the hypothalamus releases thyrotropin-releasing hormone (TRH), which stimulates the pituitary to secrete thyroid-stimulating hormone (TSH), which in turn prompts the thyroid gland to produce T4 and T3 [2] [4]. The physiological effects of T4, which is largely a prohormone, are mediated through its conversion to the active form, T3, by tissue-specific deiodinase enzymes [2]. Hypothyroidism, characterized by a deficiency of THs, disrupts this delicate balance and presents a dual clinical challenge by concurrently driving pathophysiological processes that lead to both weight gain and dyslipidemia [68] [69] [70]. This whitepaper details the mechanistic links between hypothyroidism and these metabolic disturbances, framing them within the context of disrupted BMR regulation for a research-focused audience.
Molecular Mechanisms Linking Hypothyroidism to Weight Gain and Dyslipidemia
Genomic and Non-Genomic Actions of Thyroid Hormones
The metabolic effects of THs are primarily mediated through genomic pathways involving nuclear thyroid hormone receptors (THRs), which function as ligand-activated transcription factors [2] [70]. THRs exist in two main forms, THR-α and THR-β, with THR-β being the predominant isoform in the liver and a critical regulator of cholesterol and lipid metabolism [70]. Upon binding to T3, these receptors heterodimerize with the retinoid X receptor (RXR) and regulate the expression of target genes by binding to thyroid hormone response elements (TREs) in their promoter regions [68]. Key metabolic genes activated by T3 include those encoding for the low-density lipoprotein receptor (LDLR), carnitine palmitoyltransferase 1α (CPT1A)—a rate-limiting enzyme in fatty acid β-oxidation—and several lipogenic enzymes such as acetyl-CoA carboxylase (ACC) and fatty acid synthase (FAS) [68] [70]. Hypothyroidism, therefore, results in a coordinated downregulation of genes essential for lipid catabolism and clearance.
In addition to these genomic actions, THs also exert rapid, non-genomic effects at the cellular level, influencing signaling pathways in the cytoplasm, plasma membrane, and mitochondria [49]. These effects can activate secondary messenger systems and modulate the activity of key metabolic enzymes, further contributing to the fine-tuning of metabolic rate.
Disruption of Lipid Homeostasis in Hypothyroidism
The dyslipidemia observed in hypothyroidism is a direct consequence of disrupted TH signaling, affecting all phases of lipid metabolism. The table below summarizes the key alterations.
Table 1: Impact of Hypothyroidism on Key Pathways of Lipid Metabolism
| Metabolic Process | Molecular Target/Pathway | Effect in Hypothyroidism | Net Pathophysiological Outcome |
|---|---|---|---|
| Cholesterol Synthesis | HMG-CoA Reductase (HMGCR) [68] | Downregulated via reduced SREBP2 [68] | Hepatic cholesterol synthesis |
| Cholesterol Absorption | Niemann-Pick C1-like 1 (NPC1L1) [68] | Upregulated [68] | Intestinal cholesterol absorption |
| LDL Clearance | Hepatic LDL Receptor (LDLR) [68] | Downregulated [68] [70] | Plasma LDL-C clearance |
| Fatty Acid Oxidation | Carnitine Palmitoyltransferase 1α (CPT1A) [68] | Inhibited [68] [70] | Hepatic β-oxidation, VLDL secretion |
| Lipoprotein Lipase (LPL) | LPL Activity [70] | Reduced [70] | Triglyceride-rich lipoprotein clearance |
| Bile Acid Synthesis | Cholesterol 7α-hydroxylase (CYP7A1) [68] | Inhibited by TSH [68] | Cholesterol excretion |
The net effect of these changes is a profound accumulation of atherogenic lipoproteins, notably elevated total cholesterol (TC) and low-density lipoprotein cholesterol (LDL-C) [68] [69] [70]. Triglyceride (TG) levels are also frequently elevated due to reduced clearance [68] [70]. Notably, the ratio of apolipoprotein B (ApoB) to apolipoprotein A (ApoA)-containing lipoproteins is consistently higher in hypothyroidism, indicating a more atherogenic lipid profile [68].
The Independent Role of TSH in Metabolic Dysregulation
Emerging research underscores that thyroid-stimulating hormone (TSH) exerts independent effects on lipid metabolism beyond its role in regulating TH synthesis [68] [71]. The TSH receptor (TSHR) is expressed on hepatocytes and adipocytes [68]. Binding of TSH to hepatic TSHR activates the cAMP/PKA/CREB signaling pathway, leading to the upregulation of HMGCR and increased cholesterol synthesis [68]. Furthermore, TSH can inhibit the phosphorylation and activation of AMPK, a key cellular energy sensor, thereby promoting anabolic processes like cholesterol and lipid synthesis [71]. In adipose tissue, TSH stimulates lipolysis by increasing the phosphorylation of perilipin and hormone-sensitive lipase (HSL), elevating circulating free fatty acids (FFA) that contribute to VLDL production in the liver [68]. This direct action of TSH helps explain the strong positive correlation observed between serum TSH levels and concentrations of total-C and LDL-C, even in subclinical hypothyroidism where TH levels may be within the normal range [68] [71].
Mechanisms of Weight Gain and Reduced Energy Expenditure
Weight gain in hypothyroidism is primarily driven by a decreased basal metabolic rate (BMR) [4] [72]. THs are pivotal stimulators of mitochondrial biogenesis and oxidative phosphorylation. A deficiency leads to reduced oxygen consumption and energy expenditure, shifting the body's energy balance towards storage [2] [72]. This is compounded by:
- Reduced Thermogenesis: THs are essential for adaptive thermogenesis in brown adipose tissue (BAT). Hypothyroidism impairs this process, reducing heat production and further lowering energy expenditure [2] [70].
- Altered Substrate Utilization: The decrease in fatty acid β-oxidation, mediated by reduced CPT1A activity, limits the ability to use lipids as an energy source [68] [70].
- Fluid Retention and Fat Accumulation: Weight gain is partially attributable to fluid retention (myxedema) and an increase in fat mass due to the overall slowing of metabolic processes [4] [72].
Diagram: Molecular Interplay Between Hypothyroidism, Weight Gain, and Dyslipidemia
Quantitative Data Synthesis: Clinical and Pre-clinical Evidence
The association between hypothyroidism and adverse lipid profiles is well-established in clinical studies. The following table synthesizes key quantitative findings from observational studies and meta-analyses.
Table 2: Summary of Quantitative Lipid Profile Changes in Hypothyroidism
| Parameter | Change in Hypothyroidism vs. Euthyroid | Key Contextual Findings |
|---|---|---|
| Total Cholesterol (TC) | Consistently Elevated [68] [69] | Prevalence of overt hypothyroidism in hypercholesterolemic patients is ~4.3% [68]. |
| LDL-C | Consistently Elevated [68] [69] | Positive correlation with serum TSH levels [68] [71]. Elevation more pronounced with TSH >10 mIU/L [68]. |
| Triglycerides (TG) | Elevated [68] [69] | Associated with postprandial hypertriglyceridemia and reduced lipoprotein lipase activity [68] [70]. |
| HDL-C | Inconsistent Changes [68] | HDL function may be impaired; ApoB/ApoA1 ratio is consistently higher [68]. |
| Blood Pressure | Diastolic BP Elevated [69] | Meta-analysis shows LT4 treatment reduces BP by -4.0/-2.1 mmHg (SBP/DBP) in SCH [69]. |
The efficacy of levothyroxine (LT4) replacement therapy in reversing dyslipidemia provides further evidence of the causal link. Meta-analyses of randomized controlled trials demonstrate that LT4 treatment in subclinical hypothyroidism leads to significant reductions in total-C and LDL-C [69]. The improvement in lipid parameters is more pronounced in patients with overt hypothyroidism compared to subclinical disease [68] [69].
Experimental Models and Methodologies
In Vitro Model: Human Preadipocyte Differentiation and TSH Challenge
Objective: To investigate the direct, TH-independent effects of TSH on cholesterol biosynthesis in human adipocytes [71].
Protocol:
- Cell Culture: Isolate human subcutaneous preadipocytes from subjects with obesity (commercially available, e.g., Zen-Bio). Culture in preadipocyte medium until confluence (Day 0).
- Differentiation: Induce differentiation at confluence using a differentiation cocktail containing insulin, dexamethasone, isobutylmethylxanthine, and a PPAR-γ agonist (e.g., rosiglitazone). Maintain cells in this medium for 7 days.
- Maturation: Replace differentiation medium with adipocyte medium for an additional 7 days. Mature adipocytes, characterized by rounded cells with large lipid droplets, are ready for experimentation by Day 14.
- Treatment: Challenge mature adipocytes with recombinant human TSH (α/β subunit). A typical experiment includes a dose-response (e.g., 0.1, 1, 10 mU/mL) and time-course (e.g., 6, 12, 24 hours) design.
- Analysis:
- Gene Expression: Harvest cells for RNA extraction. Perform quantitative RT-PCR to measure mRNA levels of target genes: HMGCR (cholesterol synthesis), TSHB (paracrine TSH), and LDLR.
- Lipidomics: Extract lipids and analyze via mass spectrometry to profile specific lipid species, such as cholesteryl esters and sphingolipids [71].
In Vivo Model: Diet-Induced Obesity and TSHR Knockout
Objective: To establish the role of hepatic TSH signaling in systemic cholesterol metabolism in an obese mouse model [68] [71].
Protocol:
- Animal Models: Utilize liver-specific Tshr knockout (KO) mice and wild-type (WT) littermate controls.
- Dietary Intervention: At 3 weeks of age, divide mice into two dietary groups:
- Normocaloric diet (control, ~25% calories from fat).
- Hypercaloric high-fat diet (HFD) (~60% calories from fat) for 6 months to induce obesity and dyslipidemia.
- Monitoring: Monitor body weight and food intake weekly.
- Terminal Analysis: Euthanize mice in an unfed state. Collect blood and tissues (serum, liver, subcutaneous adipose tissue).
- Serum Analysis: Measure circulating total cholesterol, LDL-C, and TSH levels.
- Tissue Analysis: Isolve RNA from liver and adipose tissue. Quantify expression of Tshb, Hmgcr, Srebp2, and Cyp7a1 via qRT-PCR. Correlate adipose tissue Tshb mRNA levels with circulating cholesterol [71].
Human Intervention Study: Statin Effects on Adipose TSHB mRNA
Objective: To assess the bidirectional relationship between cholesterol metabolism and local TSHB expression in human adipose tissue [71].
Protocol:
- Cohort Design: A longitudinal intervention study in human participants.
- Participants: Recruit euthyroid subjects with dyslipidemia, requiring statin therapy.
- Baseline Sampling: Prior to intervention, perform a subcutaneous adipose tissue biopsy. Collect fasting blood for serum lipid profiling (total-C, LDL-C) and TSH.
- Intervention: Administer simvastatin (20 mg once daily) for a 6-month period.
- Endpoint Sampling: After 6 months, repeat the adipose tissue biopsy and blood sampling.
- Analysis:
- Primary Outcome: Change in adipose tissue TSHB mRNA levels from baseline to 6 months, measured by qRT-PCR.
- Secondary Outcomes: Correlation between the reduction in LDL-C and the reduction in TSHB mRNA.
- In vitro validation: Treat human adipocytes with excess cholesterol to investigate if it upregulates TSHB mRNA [71].
Diagram: Experimental Workflow for Human Adipose Tissue Biopsy Intervention Study
The Scientist's Toolkit: Essential Research Reagents and Models
Table 3: Key Reagents and Models for Investigating Hypothyroidism and Metabolism
| Tool / Reagent | Function / Application | Example Use in Research |
|---|---|---|
| Recombinant Human TSH | To directly stimulate TSHR in vitro, independent of endogenous TH feedback. | Studying TSHR-mediated cAMP/PKA signaling and HMGCR upregulation in hepatocytes [68] [71]. |
| Human Preadipocytes | In vitro model for studying adipocyte differentiation and metabolic function. | Investigating the paracrine role of locally produced TSHβ in adipose tissue and its response to cholesterol [71]. |
| Liver-Specific TSHR KO Mice | In vivo model to dissect the TH-independent effects of hepatic TSH signaling. | Establishing the causal role of hepatic TSHR in regulating serum LDL-C levels [68] [71]. |
| HMGCR Activity Assays | To directly measure the activity of the rate-limiting enzyme in cholesterol synthesis. | Quantifying the impact of TSH vs. T3 on de novo cholesterol biosynthesis in liver homogenates [68]. |
| Lipidomic Profiling (LC-MS) | High-throughput identification and quantification of lipid species. | Discovering associations between adipose TSHB mRNA and specific cholesterol esters and sphingolipids [71]. |
| THR-β Selective Agonists | Pharmacological tools to activate THR-β-mediated pathways with minimal cardiac (THR-α) effects. | Evaluating efficacy in reducing hepatic steatosis and dyslipidemia in preclinical models of NAFLD [70]. |
Hypothyroidism presents a clear model of disrupted metabolic homeostasis, driven by a deficiency in T3 and T4 that directly lowers the BMR and is compounded by the independent actions of elevated TSH on lipid synthesis and mobilization. The convergence of these pathways explains the clinical dual challenge of weight gain and profound dyslipidemia. For researchers and drug development professionals, this mechanistic understanding opens avenues for targeted therapies. The development of THR-β selective agonists represents a promising strategy to harness the beneficial hepatic and metabolic effects of TH signaling—such as promoting LDL-C clearance and fatty acid oxidation—while avoiding deleterious thyrotoxic effects on the heart and bone mediated by THR-α [70]. Future research should focus on further elucidating the paracrine actions of TSH in adipose tissue, the cross-talk between TH signaling and other nuclear receptors (e.g., PPARs, LXR), and validating the efficacy of novel therapeutics in well-defined patient populations, including those with subclinical hypothyroidism and NAFLD.
Thyroid hormones (THs), primarily triiodothyronine (T3) and thyroxine (T4), serve as master regulators of energy homeostasis, exerting profound effects on basal metabolic rate (BMR) and substrate metabolism. In hyperthyroidism, the excessive production of these hormones triggers a systemic hypermetabolic state characterized by paradoxical catabolic processes that simultaneously increase energy expenditure while degrading metabolic reserves. This whitepaper examines the molecular mechanisms through which thyroid hormones dysregulate metabolic pathways, leading to accelerated catabolism in adipose tissue, skeletal muscle, and liver. Through synthesis of recent clinical evidence and experimental findings, we delineate the pathophysiological basis for the catabolic paradox in hyperthyroidism and its implications for therapeutic intervention.
Thyroid hormones are essential determinants of basal metabolic rate (BMR) through their actions on nuclear receptors that regulate gene networks controlling energy expenditure, thermogenesis, and substrate metabolism [73]. The hypothalamic-pituitary-thyroid (HPT) axis maintains circulating levels of THs, with thyrotropin-releasing hormone (TRH) from the hypothalamus stimulating thyroid-stimulating hormone (TSH) secretion from the pituitary, which in turn regulates thyroid hormone synthesis and release [74]. The thyroid gland secretes predominantly T4, with most biologically active T3 generated in peripheral tissues via deiodinase enzymes [75] [76].
In hyperthyroidism, characterized by suppressed TSH and elevated T3 and/or T4 levels, a hypermetabolic state emerges with increased resting energy expenditure, weight loss, reduced cholesterol levels, and accelerated substrate turnover [11] [77] [20]. This review explores the paradoxical catabolism in hyperthyroidism wherein increased energy expenditure coincides with breakdown of metabolic reserves, framing this understanding within broader research on thyroid hormones' role in BMR regulation.
Molecular Mechanisms of Thyroid Hormone Action
Genomic and Non-Genomic Signaling Pathways
Thyroid hormones exert their effects through genomic and non-genomic mechanisms. The genomic pathway involves binding of T3 to nuclear thyroid hormone receptors (TRs) α and β, which heterodimerize with retinoid X receptor (RXR) and regulate transcription of target genes by binding to thyroid hormone response elements (TREs) [73] [76]. TRs recruit coactivator complexes with histone acetyltransferase activity in the presence of T3, or corepressor complexes with histone deacetylase activity in its absence, thus modulating chromatin structure and gene expression [73].
Non-genomic actions occur at the plasma membrane and cytoplasm, involving activation of signal transduction systems including mitogen-activated protein kinase (MAPK) and phosphoinositide 3-kinase (PI3K) pathways [76]. These rapid effects complement the genomic actions to coordinate metabolic regulation.
Table 1: Components of Thyroid Hormone Signaling and Metabolic Regulation
| Component | Type | Function in TH Signaling | Metabolic Role |
|---|---|---|---|
| TRα1 | Nuclear receptor | Predominantly expressed in brain, heart, skeletal muscle | Regulates cardiac pacemaking, muscle function |
| TRβ1 | Nuclear receptor | Widely expressed; major liver isoform | Mediates cholesterol lowering, metabolic effects |
| DIO1 | Deiodinase enzyme | T4 to T3 conversion (liver, kidney) | Systemic T3 production, clearance of rT3 |
| DIO2 | Deiodinase enzyme | T4 to T3 conversion (CNS, BAT, pituitary) | Local T3 production, thermogenesis |
| DIO3 | Deiodinase enzyme | Inactivates T3 and T4 | TH inactivation during development, illness |
| MCT8 | TH transporter | Cellular uptake of THs, especially neurons | Neuronal development, TH metabolism |
Intracellular Regulation of Thyroid Hormone Availability
The intracellular availability of thyroid hormones is precisely regulated by deiodinase enzymes that activate or inactivate THs in a tissue-specific manner. Type 1 and type 2 deiodinases (D1 and D2) convert the prohormone T4 to active T3, while type 3 deiodinase (D3) inactivates T3 and T4 [75]. This cell-autonomous regulation allows tissues to control local thyroid hormone activity without altering systemic hormone levels.
In the liver, D1 contributes to plasma T3 homeostasis, while transient D2 expression during neonatal development programs metabolic gene expression affecting future susceptibility to obesity and hepatic steatosis [75]. Brown adipose tissue (BAT) expresses D2, which is critical for thermogenesis through uncoupling protein 1 (UCP1) activation [11] [20].
Diagram 1: Thyroid hormone signaling and metabolic regulation pathway. MCT8: monocarboxylate transporter 8; OATP1C1: organic anion-transporting polypeptide 1C1; TR: thyroid hormone receptor; RXR: retinoid X receptor; TRE: thyroid hormone response element.
Metabolic Dysregulation in Hyperthyroidism: The Catabolic Paradox
Systemic Hypermetabolism and Energy Balance
Hyperthyroidism induces a hypermetabolic state characterized by increased resting energy expenditure (REE), reduced cholesterol levels, increased lipolysis, and gluconeogenesis [11] [20]. This state represents a metabolic paradox where anabolic and catabolic pathways are simultaneously activated, creating futile cycles that increase oxygen consumption and energy expenditure without productive energy storage [75].
Clinical manifestations include weight loss despite increased appetite, heat intolerance, tachycardia, and increased cardiac output [77]. A recent meta-analysis demonstrated that increasing TSH concentration (indicating hypothyroidism) was associated with weight gain, while increasing FT4 values were associated with weight loss, confirming the role of thyroid hormones in energy balance [11].
Tissue-Specific Catabolic Processes
Adipose Tissue: Lipid Mobilization and Thermogenesis
Thyroid hormones stimulate lipolysis in white adipose tissue (WAT) through multiple mechanisms, including increased expression of hormone-sensitive lipase and enhanced sensitivity to catecholamines [11] [20]. This results in increased circulating free fatty acids (FFAs) that serve as substrates for energy production and heat generation.
In brown adipose tissue (BAT), T3 regulates thermogenesis through induction of uncoupling protein 1 (UCP1), which uncouples mitochondrial respiration from ATP production, thereby dissipating energy as heat [11] [20]. THs also promote the "browning" of white adipocytes, wherein white adipocytes acquire thermogenic characteristics of brown adipocytes, further enhancing energy expenditure [11] [20].
Table 2: Metabolic Alterations in Hyperthyroidism by Tissue Type
| Tissue | Primary Catabolic Processes | Key Mediators | Functional Consequences |
|---|---|---|---|
| White Adipose Tissue | Lipolysis ↑, Lipogenesis ↓ | HSL ↑, β-adrenergic sensitivity ↑ | FFA ↑, Glycerol ↑, Weight loss |
| Brown Adipose Tissue | Thermogenesis ↑, "Browning" ↑ | UCP1 ↑, DIO2 ↑ | Energy expenditure ↑, Heat production ↑ |
| Liver | Gluconeogenesis ↑, Glycogenolysis ↑, Fatty acid oxidation ↑ | PEPCK ↑, Glucose-6-phosphatase ↑, CPT1 ↑ | Hepatic glucose output ↑, Ketogenesis ↑ |
| Skeletal Muscle | Protein catabolism ↑, Proteolysis ↑, Thermogenesis ↑ | Proteasome activity ↑, UCP3 ↑ | Muscle wasting, Weakness, REE ↑ |
| Pancreas | β-cell apoptosis ↑ (severe), Insulin secretion ↓ (late) | Mafa ↓, DIO3 ↓ | Glucose intolerance ↑, Diabetes risk ↑ |
Skeletal Muscle: Protein Catabolism
Hyperthyroidism increases protein turnover with a net catabolic effect, leading to muscle wasting and weakness [77] [78]. This occurs through upregulation of proteolytic systems including the ubiquitin-proteasome pathway and increased mitochondrial uncoupling protein 3 (UCP3) expression, which contributes to energy dissipation as heat [75].
The combination of increased protein catabolism and energy inefficiency contributes significantly to the weight loss and fatigue characteristic of thyrotoxicosis.
Hepatic Metabolism: Substrate Cycling
The liver responds to thyroid hormone excess with increased gluconeogenesis, glycogenolysis, and fatty acid β-oxidation [75] [79]. T3 regulates key enzymes including phosphoenolpyruvate carboxykinase (PEPCK) and glucose-6-phosphatase that enhance hepatic glucose output [75]. Simultaneously, carnitine palmitoyltransferase 1 (CPT1) expression increases, driving fatty acid oxidation and contributing to the lipid-lowering effects of hyperthyroidism [79].
Metabolomic studies of patients with Graves' disease reveal elevated levels of palmitic acid (C16:0) and oleic acid (C18:1) in the hyperthyroid state, which decrease after methimazole treatment, reflecting altered lipid metabolism [79]. Pathway analysis indicates that hyperthyroidism significantly affects aminoacyl-tRNA biosynthesis and branched-chain amino acid metabolism [79].
Experimental Models and Research Methodologies
Clinical Assessment of Thyroid Status and Metabolic Parameters
Research on hyperthyroidism and metabolic dysregulation employs standardized methodologies for assessing thyroid status and metabolic parameters:
Thyroid Function Testing: Electrochemiluminescence assays for TSH, FT3, and FT4 provide precise measurement of thyroid hormones [55]. TSH serves as the most sensitive indicator of thyroid status at the hypothalamic-pituitary level, while peripheral tissue responses are better reflected by FT3 and FT4 levels [73].
Body Composition Analysis: Bioelectrical impedance analysis (BIA) using devices such as the Tanita SC 330ST body analyzer allows assessment of body composition parameters including fat mass, fat-free mass, muscle mass, and basal metabolic rate [55]. This methodology provides detailed metabolic phenotyping essential for understanding thyroid-related metabolic changes.
Metabolomic Profiling: Liquid chromatography-mass spectrometry (LC-MS) enables untargeted analysis of plasma metabolites, revealing global metabolic alterations in hyperthyroidism [79]. Sample preparation involves metabolite extraction with methanol/water mixtures, followed by separation on specialized columns (Discovery HS-F5-3 for polar metabolites, Luna HILIC for acylcarnitines) and detection using multiple reaction monitoring (MRM) for enhanced sensitivity [79].
Experimental Models for Investigating Thyroid Hormone Action
Animal Models: TR isoform-specific knockout mice (TRαKO, TRβKO) reveal distinct metabolic roles for each receptor isoform [76]. Tissue-specific knockout models (e.g., Alb-D2KO with hepatocyte-specific D2 inactivation) demonstrate how local thyroid hormone action affects systemic metabolism [75].
Cellular Models: GH3 cells (pituitary tumor cell line) express TRH receptors and are used to study TRH receptor-mediated signaling, including calcium mobilization and inositol phosphate production [74].
Diagram 2: Experimental workflow for investigating metabolic dysregulation in hyperthyroidism. LC-MS/MS: liquid chromatography-tandem mass spectrometry; RAI: radioactive iodine ablation.
Research Reagent Solutions for Thyroid-Metabolism Studies
Table 3: Essential Research Reagents for Investigating Thyroid-Related Metabolic Dysregulation
| Reagent/Category | Specific Examples | Research Application | Key Findings Enabled |
|---|---|---|---|
| TH Signaling Modulators | TRβ-selective agonists (GC-1, KB141), MCT8 inhibitors, Deiodinase inhibitors | Receptor-specific actions, Transport studies | Tissue-specific metabolic effects, Separating central vs peripheral actions |
| Metabolic Assays | Free fatty acid quantification kits, Acylcarnitine profiling panels, UCP1 antibodies | Lipid metabolism assessment, Thermogenesis measurement | Lipolysis rates, Brown fat activation, Mitochondrial uncoupling |
| Molecular Biology Tools | TRα/TRβ siRNA, TRE-luciferase reporters, TRH-R expression constructs | Gene regulation studies, Receptor signaling | Transcriptional regulation mechanisms, Receptor trafficking |
| Animal Models | TRαKO/TRβKO mice, MCT8-deficient mice, DIO2 knockout models | Tissue-specific TH action, Transport pathophysiology | Metabolic programming effects, Neuronal vs peripheral TH actions |
| Analytical Platforms | LC-MS/MS systems, Bioelectrical impedance analyzers, CLIA-based hormone assays | Metabolomic profiling, Body composition, Hormone measurement | Global metabolic alterations, Tissue composition changes, Hormone correlations |
Implications for Drug Development and Therapeutic Strategies
Understanding the molecular basis of thyroid hormone-induced catabolism provides opportunities for targeted therapeutic interventions. TRβ-selective agonists like GC-1 and KB141 show promise for managing metabolic disorders by lowering cholesterol and reducing body weight without cardiotoxic effects associated with TRα activation [76].
Additionally, the metabolite diiodothyropropionic acid (DITPA) bypasses MCT8 transporter defects and represents a potential therapy for patients with MCT8 mutations [76]. For conventional hyperthyroidism management, antithyroid drugs (methimazole, propylthiouracil), radioactive iodine ablation, and thyroidectomy represent first-line treatments, with methimazole effectively reversing the catabolic metabolomic profile in Graves' disease patients [77] [79].
Hyperthyroidism represents a state of pathological metabolic acceleration wherein thyroid hormones override normal regulatory mechanisms to activate simultaneous catabolic and energy-dissipating pathways. The resulting paradox of increased energy expenditure coupled with tissue wasting stems from thyroid hormone actions across multiple tissues, including adipose tissue, skeletal muscle, and liver. Advanced research methodologies, including metabolomic profiling and tissue-specific receptor modulators, continue to unravel the complexity of these regulatory networks. This understanding not only illuminates the pathophysiological basis of hyperthyroid catabolism but also informs the development of targeted therapies for metabolic disorders that exploit selective aspects of thyroid hormone signaling.
Subclinical Thyroid Dysfunction and its Significant Association with Metabolic Syndrome
This whitepaper examines the significant association between subclinical thyroid dysfunction and metabolic syndrome (MetS), framed within the broader context of thyroid hormone regulation of basal metabolic rate. Subclinical hypothyroidism (SCH), characterized by elevated thyroid-stimulating hormone (TSH) with normal thyroxine (T4) and triiodothyronine (T3) levels, demonstrates a robust epidemiological link with MetS, creating a synergistic risk profile for cardiovascular disease and type 2 diabetes. Through analysis of current literature and experimental data, this review elucidates the pathophysiological mechanisms by which subtle thyroid abnormalities disrupt lipid metabolism, glucose homeostasis, and cardiovascular function. The clinical implications for researchers and drug development professionals include the need for targeted screening protocols and novel therapeutic approaches that address the interconnected nature of these endocrine-metabolic disorders.
Thyroid hormones (THs), primarily thyroxine (T4) and triiodothyronine (T3), serve as fundamental regulators of basal metabolic rate, energy homeostasis, and substrate metabolism across virtually all organ systems [2]. Their genomic and non-genomic actions modulate carbohydrate metabolism, lipid synthesis and degradation, and cardiovascular function. The hypothalamic-pituitary-thyroid axis maintains precise control over thyroid hormone secretion through sophisticated feedback mechanisms [2]. Metabolic syndrome represents a constellation of cardiometabolic risk factors—including central obesity, dyslipidemia, hypertension, and hyperglycemia—that collectively increase susceptibility to atherosclerotic cardiovascular disease and diabetes mellitus [80] [81].
Subclinical thyroid dysfunction occupies an intermediate position in the thyroid disease spectrum, characterized by abnormal TSH levels despite normal circulating T3 and T4 concentrations [82]. While traditionally considered a laboratory finding with limited clinical significance, emerging evidence establishes subclinical hypothyroidism as an independent risk factor for metabolic derangements [83] [84]. This whitepaper synthesizes current understanding of the epidemiological association and pathophysiological mechanisms linking subclinical thyroid dysfunction with MetS, with particular emphasis on implications for future research and therapeutic development.
Epidemiological Evidence: Prevalence and Association
Quantitative Evidence of Association
Multiple cross-sectional studies demonstrate a significantly higher prevalence of subclinical hypothyroidism in MetS populations compared to the general population. The table below summarizes key findings from recent studies across diverse geographical regions.
Table 1: Prevalence of Subclinical Hypothyroidism in Metabolic Syndrome Populations
| Study Population | Sample Size | SCH Prevalence | Overall Thyroid Dysfunction in MetS | Key Associations |
|---|---|---|---|---|
| Metabolic Syndrome Patients (Gujarat, India) [80] | 80 | 18.8% | 23.7% | Significantly higher HDL and TSH in SCH group |
| Metabolic Syndrome Patients (Nepal) [83] | 169 | 26.6% | 31.9% | Significant association with waist circumference and HDL cholesterol |
| Chinese Population (TIDE study) [84] | 62,408 | 13.67% (of total population) | Not specified | Stronger association in women, especially postmenopausal |
| Healthy Chinese Adults [85] | 28,568 | 11.10% (of total population) | Not specified | Higher detection rate in females (13.54%) vs males (7.95%) |
Demographic Variations
The association between subclinical hypothyroidism and MetS demonstrates significant demographic variation. Multiple studies consistently report a higher prevalence of SCH in women compared to men [85]. The large-scale Chinese study (n=62,408) found that women with subclinical and overt hypothyroidism had significantly higher body mass index, waist circumference, systolic and diastolic blood pressure, and triglyceride levels compared to euthyroid women [84]. This relationship appears modulated by menopausal status, with postmenopausal women exhibiting particularly strong associations between thyroid dysfunction and metabolic parameters [84].
Age represents another significant modifying factor, with SCH prevalence increasing with advancing age [85]. However, the cardiovascular implications of this relationship may be less pronounced in older adults due to age-related adjustments in hypothalamic-pituitary-thyroid axis set points [82].
Pathophysiological Mechanisms
Thyroid Hormone Regulation of Metabolism
Thyroid hormones exert profound influence on metabolic processes through both genomic and non-genomic mechanisms. The genomic effects are mediated primarily through nuclear thyroid hormone receptors (THR) that regulate gene transcription [81]. The non-genomic effects occur rapidly at the cellular level, influencing membrane transport and mitochondrial function [86].
Table 2: Metabolic Effects of Thyroid Hormones
| Metabolic Process | Thyroid Hormone Effects | Molecular Mechanisms |
|---|---|---|
| Basal Metabolic Rate | Increases oxygen consumption, respiration rate, and body temperature [2] | Upregulation of Na+/K+ ATPase expression; mitochondrial biogenesis and uncoupling |
| Carbohydrate Metabolism | Stimulates glucose oxidation, gluconeogenesis, glycogen synthesis [2] | Enhanced expression of gluconeogenic enzymes; modulation of insulin sensitivity |
| Lipid Metabolism | Dual effects: stimulates both lipogenesis and lipolysis [2] [81] | Regulation of SREBP2, PCSK9, HMGCR; activation of hormone-sensitive lipase |
| Cardiovascular Function | Increases heart rate, contractility, cardiac output [2] | Permissive effect on catecholamines; direct chronotropic and inotropic actions |
Mechanisms Linking SCH with MetS Components
Dyslipidemia
SCH disrupts lipid homeostasis through multiple pathways. Elevated TSH stimulates hepatic expression of 3-hydroxy-3-methylglutaryl-CoA reductase (HMGCR), the rate-limiting enzyme in cholesterol biosynthesis [82]. Concurrently, TSH activation of the cAMP-PKA-CREB pathway upregulates proprotein convertase subtilisin/kexin type 9 (PCSK9), which promotes degradation of low-density lipoprotein receptors (LDL-R), impairing LDL clearance and contributing to hypercholesterolemia [82]. This mechanistic understanding is supported by clinical observations of elevated LDL levels in SCH patients independent of thyroid hormone levels [82].
Insulin Resistance and Glucose Intolerance
Thyroid hormones play crucial roles in maintaining glucose homeostasis. Both overt and subclinical hypothyroidism associate with insulin resistance, potentially through decreased expression of glucose transporters and disruption of insulin signaling pathways [81] [86]. The central sympathetic outflow regulated by thyroid hormones significantly influences hepatic gluconeogenesis, with SCH potentially altering this regulatory axis [81].
Hypertension and Cardiovascular Dysfunction
SCH contributes to elevated blood pressure through multiple mechanisms, including enhanced peripheral vascular resistance, endothelial dysfunction, and altered sympathetic nervous system activity [81] [82]. Thyroid hormones normally promote vasodilation through both endothelium-dependent and independent mechanisms. In SCH, this vasodilatory effect is diminished, contributing to hypertension [82].
Central Obesity and Adipocyte Dysfunction
The relationship between SCH and adiposity is bidirectional. Thyroid hormones regulate adipocyte differentiation, lipid storage, and lipolysis. SCH is associated with increased waist circumference and body mass index, potentially through reduced thermogenesis and metabolic rate [83] [84]. Conversely, adipose tissue-derived hormones and cytokines may affect thyroid function, creating a vicious cycle [86].
Diagram 1: Pathophysiological Pathways Linking SCH with MetS
Experimental Methodologies and Research Approaches
Standardized Diagnostic Criteria
Research in this field requires precise application of standardized diagnostic criteria for both subclinical thyroid dysfunction and metabolic syndrome.
Table 3: Standard Diagnostic Criteria for SCH and MetS in Research Settings
| Condition | Diagnostic Criteria | Commonly Used Guidelines |
|---|---|---|
| Subclinical Hypothyroidism | Elevated TSH (>4.2 mIU/L typically) with normal free T4 and T3 levels [83] [85] | American Thyroid Association, European Thyroid Association |
| Metabolic Syndrome | Presence of ≥3 of: 1) Abdominal obesity, 2) Hypertriglyceridemia, 3) Low HDL-C, 4) Hypertension, 5) Hyperglycemia [80] [85] | NCEP ATP III, IDF, Chinese Diabetes Society |
Detailed Experimental Protocol for Clinical Studies
The following methodology represents a synthesized approach from multiple cited studies [80] [83] [84]:
Study Population Selection:
- Recruit participants aged ≥18 years from general population or clinical settings
- Apply exclusion criteria: history of thyroid disease, thyroid medication use, pregnancy, severe systemic illness, corticosteroid use
- Obtain ethical approval and informed consent
Anthropometric Measurements:
- Measure height and weight to calculate body mass index (BMI)
- Determine waist circumference at midpoint between lowest rib and iliac crest
- Measure blood pressure in seated position after 5 minutes rest
Laboratory Assessments:
- Collect venous blood after 10-14 hour fast
- Analyze fasting blood glucose, triglycerides, HDL-C using automated biochemical analyzers
- Measure TSH, free T3, free T4 using electrochemiluminescence immunoassays (e.g., Roche Cobas systems)
- Consider additional parameters: LDL-C, total cholesterol, HbA1c, thyroid antibodies
Statistical Analysis:
- Compare continuous variables using t-tests or ANOVA
- Analyze categorical variables using chi-square tests
- Perform correlation analyses between thyroid parameters and MetS components
- Conduct multivariate logistic regression to adjust for confounders
Diagram 2: Experimental Workflow for SCH-MetS Studies
The Scientist's Toolkit: Research Reagent Solutions
Table 4: Essential Research Reagents and Materials for SCH-MetS Investigations
| Reagent/Instrument | Specific Example | Research Application | Key Function |
|---|---|---|---|
| Electrochemiluminescence Immunoassay System | Cobas e601/e602 (Roche) [85] | Quantification of TSH, fT3, fT4, TPO-Ab, Tg-Ab | High-sensitivity measurement of thyroid parameters |
| Automated Biochemical Analyzer | Cobas c701 (Roche) [85] | Analysis of glucose, lipids, liver enzymes | Precise metabolic parameter quantification |
| Thyroid Hormone Assay Kits | VIDAS (biomerieux) [83] | Free T3, free T4, TSH measurement | Standardized thyroid function assessment |
| B-mode Ultrasound System | Not specified [82] | Carotid intima-media thickness (C-IMT) measurement | Atherosclerosis risk assessment |
| Oxidative Stress Biomarkers | 8-iso-PGF2α, HODEs, HETEs [82] | Lipid peroxidation quantification | Oxidative stress evaluation in SCH |
| Glucose Homeostasis Assays | HOMA-IR, OGTT [84] [86] | Insulin resistance assessment | Evaluation of glucose metabolism |
Research Gaps and Future Directions
Despite compelling evidence linking SCH with MetS, several knowledge gaps persist. The causal relationship between these conditions remains incompletely understood, with potential bidirectional influences [86]. Large-scale longitudinal studies controlling for confounding variables are needed to establish temporality and causality [82] [86].
Future research should integrate multidimensional biomarkers beyond TSH, including oxidative stress indicators, vascular elasticity measures, and thyroid antibody status [82]. The therapeutic implications of treating SCH in MetS patients require clarification through randomized controlled trials, particularly regarding levothyroxine intervention effects on metabolic parameters and cardiovascular outcomes [82].
From a drug development perspective, novel approaches targeting the intersection of thyroid dysfunction and metabolic disorders may include TSH receptor modulators, tissue-specific thyroid hormone analogs, and interventions that address the inflammatory components common to both conditions.
Subclinical hypothyroidism demonstrates a significant association with metabolic syndrome through multiple interconnected pathophysiological pathways affecting lipid metabolism, glucose homeostasis, cardiovascular function, and adipose tissue biology. The epidemiological evidence consistently shows elevated SCH prevalence in MetS populations across diverse demographic groups. Understanding these relationships within the broader context of thyroid hormone regulation of basal metabolic rate provides crucial insights for researchers and drug development professionals. Future investigations should prioritize elucidating causal mechanisms and developing targeted interventions that address the synergistic risks posed by the co-occurrence of these conditions.
Resistance to Thyroid Hormone (RTH) represents a complex endocrine disorder characterized by reduced tissue responsiveness to thyroid hormones, primarily caused by mutations in thyroid hormone receptor genes. This whitepaper examines RTH through the lens of RXR-gamma biology and its critical partnership with thyroid hormone receptors in regulating metabolic processes. Within the context of basal metabolic rate research, we synthesize evidence from clinical cases, molecular studies, and genetic analyses to elucidate the pathogenic mechanisms underlying RTH. The intricate interplay between thyroid hormone receptors and RXR-gamma reveals a sophisticated regulatory system whose disruption has profound implications for metabolic homeostasis, cardiovascular function, and therapeutic development. This analysis provides researchers and drug development professionals with a comprehensive framework for understanding RTH pathophysiology and identifies promising avenues for targeted interventions.
Thyroid hormones (THs), primarily thyroxine (T4) and triiodothyronine (T3), serve as master regulators of energy expenditure, thermogenesis, and basal metabolic rate (BMR) through their actions on multiple target tissues including brain, adipose tissue, skeletal muscle, liver, and pancreas [11]. The intact hypothalamic-pituitary-thyroid (HPT) axis maintains circulating TH levels under physiological conditions, with hyperthyroidism producing a hypermetabolic state characterized by increased resting energy expenditure, weight loss, reduced cholesterol levels, increased lipolysis, and gluconeogenesis, while hypothyroidism promotes a hypometabolic condition with opposite effects [11]. At the molecular level, thyroid hormones regulate BMR through both genomic and non-genomic mechanisms. The genomic effects are mediated by nuclear thyroid hormone receptors (TRs) TRα and TRβ, which heterodimerize with retinoid X receptors (RXRs) and bind to thyroid hormone response elements (TREs) in target gene promoters [11]. The RXR-retinoid X receptor gamma (RXRγ), encoded by the RXRG gene on chromosome 1q23.3 in humans, serves as an essential heterodimeric partner for TRs, with the TR/RXR heterodimer traditionally classified as "non-permissive" [87] [88]. However, emerging evidence challenges this conventional view and suggests more complex regulatory interactions that have significant implications for understanding RTH pathophysiology and its metabolic consequences.
Molecular Mechanisms of Thyroid Hormone Action and RXR Partnership
Genomic Signaling Through TR/RXR Heterodimers
The genomic actions of thyroid hormones begin with cellular uptake of free T4 and T3 via specific membrane transporters including monocarboxylate transporter 8 or 10 (MCT8 or MCT10), followed by intracellular conversion of T4 to active T3 by deiodinases DIO1 and DIO2 [11]. T3 then translocates to the nucleus and binds with high affinity to TRα and TRβ, inducing conformational changes that facilitate heterodimerization with RXR (primarily RXRγ in specific tissues) [11]. This TR/RXR complex recruits coactivators and binds to TREs, regulating transcription of genes involved in metabolic regulation. The RXRG gene encodes the RXRγ protein, which contains several functional domains: an N-terminal A/B domain, a DNA-binding domain (DBD) with two C4-type zinc fingers, a hinge region, and a C-terminal ligand-binding domain (LBD) [88]. RXRγ expression shows a relatively restricted pattern, predominantly in muscle, specific brain regions, and pituitary tissue, suggesting tissue-specific functions in thyroid hormone signaling [88] [89].
Table 1: Components of Thyroid Hormone Signaling Machinery
| Component | Type | Function in TH Signaling | Tissue Expression |
|---|---|---|---|
| TRα (THRA) | Nuclear receptor | Binds T3, regulates gene transcription | Widely expressed |
| TRβ (THRB) | Nuclear receptor | Binds T3, regulates gene transcription | Liver, heart, pituitary |
| RXRγ (RXRG) | Nuclear receptor | TR heterodimerization partner | Muscle, brain, pituitary |
| MCT8 (SLC16A2) | Transporter | Cellular uptake of TH | Multiple tissues |
| DIO1 | Deiodinase | Converts T4 to T3 | Liver, kidney, thyroid |
| DIO2 | Deiodinase | Converts T4 to T3 | Brain, pituitary, muscle |
| Integrin αvβ3 | Membrane receptor | Non-genomic TH signaling | Upregulated in cancer |
Reevaluating the TR/RXR Heterodimer Paradigm
The conventional model positions RXR as a "silent partner" in TR/RXR heterodimers, unable to bind ligand and solely facilitating DNA binding [87]. However, functional evidence from derepression assay systems challenges this model. When RXR's ligand-binding domain (LBD) is bound by its natural ligand 9-cis-retinoic acid, it can induce conformational changes in TR that lead to dissociation of corepressors, even in the absence of T3 [87]. This ligand-dependent activity of RXR modulates unliganded TR-mediated repression and enhances T3-mediated activation, revealing an unexpected aspect of cross-regulation between TR and RXR [87]. This revised understanding has significant implications for RTH, as mutations affecting the TR-RXR interaction interface could disrupt this delicate regulatory balance and contribute to hormone resistance independent of TR mutations themselves.
Diagram 1: Thyroid Hormone Signaling Pathways. The genomic pathway (top) involves T3 binding to TR, heterodimerization with RXR, and regulation of gene expression. The non-genomic pathway (bottom) involves TH binding to integrin αvβ3 and activating rapid signaling cascades.
Clinical Spectrum and Genetic Basis of Resistance to Thyroid Hormone
RTH Phenotypes and Cardiovascular Manifestations
RTH typically presents with elevated thyroid hormone levels, nonsuppressed TSH, and variable tissue hyporesponsiveness. A recent multigenerational case study illustrates the severe cardiovascular manifestations that can occur in RTH. A 50-year-old female with a confirmed THRβ mutation (c.1357C>A, p.P453T) presented with recurrent goitre, hypothyroidism, and progressive cardiovascular complications including angina-like symptoms, atrial fibrillation, left heart failure, and severe pulmonary oedema [90]. Her condition progressed to dilated cardiomyopathy with ejection fraction below 30%, refractory to guideline-directed medical therapy, ultimately necessitating orthotopic heart transplantation [90]. Genetic testing confirmed the same mutation in her mother, brother, and two sons, demonstrating autosomal dominant inheritance [90]. This case underscores the potential severity of RTH-related cardiac complications and highlights the importance of cardiological awareness in diagnosing and managing this condition, particularly when thyroid dysfunction accompanies unexplained or treatment-resistant cardiomyopathy.
THRβ Mutations as Primary Genetic Determinants
The majority of RTH cases (85-90%) involve heterozygous mutations in the THRB gene encoding thyroid hormone receptor beta [90]. These mutations typically cluster in two hotspot regions within the ligand-binding domain of TRβ, specifically affecting amino acids encoded by exons 7-10 [90]. The resultant mutant receptors display impaired T3 binding affinity or disrupted cofactor recruitment, acting in a dominant-negative manner to interfere with wild-type receptor function. The specific mutation variant influences disease severity, with some mutations causing complete hormone resistance while others yield partial resistance. The p.P453T mutation identified in the multigenerational case study represents one such variant associated with progressive cardiovascular deterioration [90]. Emerging evidence suggests that modifier genes, including potentially RXRG polymorphisms, may influence phenotypic expression and tissue-specific manifestations of RTH.
Table 2: Characteristics of RTH-Associated THRB Mutations
| Mutation | Domain | Inheritance | Clinical Severity | Key Features |
|---|---|---|---|---|
| p.P453T | LBD | Autosomal dominant | Severe | Dilated cardiomyopathy, refractory heart failure |
| p.R338W | LBD | Autosomal dominant | Moderate to severe | Goiter, tachycardia, growth retardation |
| p.A317T | LBD | Autosomal dominant | Moderate | ADHD, learning disabilities, goiter |
| p.R438H | LBD | Autosomal dominant | Variable | Fatigue, heat intolerance, metabolic alterations |
RXR-Gamma in Thyroid Hormone Resistance: Experimental Evidence
Functional Interactions in TR/RXR Heterodimers
The functional relationship between TR and RXR has been systematically investigated using specialized assay systems. Critical experiments employing Gal4-TR-VP16 (GTV) chimeras have demonstrated that liganded RXR LBD can activate GTV in the presence of 9-cis-RA, indicating dynamic corepressor dissociation [87]. When a point mutation (Leu372Arg) specifically abolishing heterodimerization with RXR is introduced into the GTV chimera (GTV L372R), activation by liganded RXR LBD is prevented, confirming the necessity of direct TR-RXR interaction [87]. Further evidence comes from studies with a hinge region mutant (GTV P158R) that destabilizes TR structure; this mutant can still be activated by cotransfected RXR LBD in the presence of 9-cis-RA, suggesting that RXR ligand binding can modulate TR conformation and corepressor binding independently of TR's structural integrity [87]. These findings fundamentally challenge the traditional "silent partner" model of RXR in TR/RXR heterodimers and suggest that impaired RXR function or disrupted TR-RXR interactions could contribute to thyroid hormone resistance even without TR mutations.
RXRγ Expression and Metabolic Regulation
RXRγ demonstrates specific expression patterns relevant to metabolic processes, with significant expression in heart, adrenal tissue, and muscle [88]. This distribution aligns with key sites of thyroid hormone action on basal metabolic rate, suggesting RXRγ may play specialized roles in metabolic tissues. Research indicates that RXRγ expression is significantly lower in non-small cell lung cancer cells, and proteomic analyses have identified loss of RXRγ during progression of epithelial ovarian cancer, suggesting its potential tumor suppressor functions in certain contexts [88]. While direct evidence linking RXRγ mutations to RTH remains limited, genome-wide association studies have identified RXRG polymorphisms associated with metabolic parameters including low-density lipoprotein cholesterol levels and hypercholesterolemia [88]. Additionally, associations between functional genetic variants in RXRG and susceptibility to type 2 diabetes and gestational diabetes mellitus have been reported, further supporting its metabolic relevance [88].
Methodological Approaches for Investigating RTH Mechanisms
Experimental Models and Assay Systems
The derepression assay system provides a sensitive method for investigating TR/RXR interactions and their disruption in RTH. This approach utilizes Gal4-DNA-binding-domain-TR-ligand-binding-domain-VP16-transactivation-domain (GTV) chimeras that are transcriptionally inactive due to association with cellular corepressors [87]. Cotransfection of RXR LBD in the presence of 9-cis-RA activates the GTV chimera by inducing corepressor dissociation, enabling quantitative assessment of functional TR-RXR interactions [87]. Site-directed mutagenesis of specific residues (e.g., L372R to disrupt heterodimerization or P158R to destabilize TR structure) allows mechanistic dissection of the interaction interfaces [87]. For metabolic assessments, bioelectrical impedance analysis provides comprehensive body composition profiling including fat-free mass, muscle mass, basal metabolic rate, and visceral fat levels, enabling correlation with thyroid hormone parameters [55]. Electrochemiluminescence assays (e.g., Cobas e 411, Mindray BS-480 systems) allow precise quantification of TSH, FT3, and FT4 levels for phenotypic characterization [55].
Diagram 2: Derepression Assay Workflow. Experimental approach for investigating TR/RXR interactions using GTV chimeras, transfection, ligand treatment, and reporter assays to assess corepressor dissociation.
Clinical Assessment and Metabolic Phenotyping
Comprehensive clinical characterization of RTH requires integrated biochemical, cardiovascular, and metabolic assessments. Thyroid hormone profiling should include TSH, FT3, FT4 measurements, with particular attention to the FT3/FT4 ratio as an indicator of tissue-specific deiodinase activity [11]. Echocardiography is essential for detecting RTH-related cardiac manifestations including hypertrophic cardiomyopathy, dilated cardiomyopathy, and systolic dysfunction [90]. Bioelectrical impedance analysis provides detailed body composition parameters including fat-free mass, muscle mass, basal metabolic rate, visceral fat, and metabolic age, enabling correlation with thyroid status [55]. Genetic testing through Sanger or next-generation sequencing of THRB and potentially RXRG identifies causative mutations and informs family screening. In the documented multigenerational case, the combination of progressive cardiac deterioration despite optimal medical therapy and familial clustering of the same THRβ mutation confirmed the diagnosis of RTH with severe cardiovascular manifestations [90].
Metabolic Implications: Connecting RXRγ and RTH to Basal Metabolic Rate
Thyroid hormones precisely regulate basal metabolic rate through multiple mechanisms including mitochondrial biogenesis, thermogenesis, and substrate metabolism. Clinical studies demonstrate that even within the reference range, thyroid hormones significantly associate with body composition and metabolic parameters. In women of reproductive age, TSH shows significant positive associations with fat-free mass, muscle mass, and BMR, while FT3 inversely correlates with metabolic age and visceral fat [55]. These relationships highlight the metabolic relevance of thyroid status even in euthyroid individuals and suggest that disruptions in thyroid signaling—as occurs in RTH—would expectedly alter metabolic homeostasis. The tissue-specific expression of RXRγ in metabolic tissues including muscle and heart positions it as a potential modulator of thyroid hormone effects on BMR [88] [89]. When TR/RXR heterodimer function is impaired through TR mutations (as in classic RTH) or potentially through disrupted RXR function, the genomic actions of thyroid hormones on metabolic gene networks would be compromised, potentially explaining the metabolic heterogeneity observed in RTH patients.
Table 3: Thyroid Hormone Associations with Metabolic Parameters in Euthyroid Women
| Parameter | TSH Correlation | FT3 Correlation | FT4 Correlation | Clinical Significance |
|---|---|---|---|---|
| Fat-free mass | Positive (p<0.05) | Not significant | Weak negative (p<0.05) | Determines resting energy expenditure |
| Muscle mass | Positive (p<0.05) | Not significant | Not significant | Major contributor to BMR |
| Basal metabolic rate | Positive (p<0.05) | Not significant | Not significant | Direct measure of energy expenditure |
| Visceral fat | Not significant | Inverse (p<0.05) | Not significant | Marker of metabolic health |
| Metabolic age | Not significant | Inverse (p<0.05) | Weak negative (p<0.05) | Indicator of physiological vs. chronological age |
Research Toolkit: Essential Reagents and Methodologies
Table 4: Research Reagent Solutions for Investigating RTH Mechanisms
| Reagent/Method | Category | Specific Application | Key Features |
|---|---|---|---|
| Gal4-TR-VP16 (GTV) chimera | Molecular tool | Derepression assays | Contains Gal4 DBD, TR LBD, VP16 AD; measures corepressor binding |
| 9-cis-retinoic acid | RXR ligand | RXR activation studies | Natural RXR ligand; used at 1-10 μM concentration |
| Site-directed mutagenesis kits | Genetic tool | Introducing specific mutations | Creates L372R (heterodimerization-deficient) and P158R (destabilizing) mutants |
| Electrochemiluminescence assays | Diagnostic tool | TSH, FT3, FT4 measurement | Cobas e 411, Mindray BS-480 systems; high sensitivity and precision |
| Bioelectrical impedance analysis | Metabolic assessment | Body composition profiling | Measures fat-free mass, muscle mass, BMR, visceral fat (Tanita SC 330ST) |
| TRβ mutation panels | Genetic testing | THRB mutation detection | Identifies hotspot mutations in exons 7-10 of THRB gene |
| Coactivator/ corepressor assays | Interaction studies | Cofactor recruitment | Measures SRC-1, NCoR, SMRT binding to TR/RXR complexes |
Therapeutic Implications and Future Directions
The revised understanding of TR/RXR heterodimer function opens new therapeutic possibilities for RTH. Rather than focusing exclusively on TR mutations, strategies that target the TR-RXR interaction interface or modulate RXR activity with selective rexinoids might overcome the dominant-negative effects of mutant TRs [87] [89]. The clinical use of RXR-selective ligands (rexinoids) in cancer and metabolic diseases demonstrates their therapeutic potential, though application in RTH remains exploratory [89]. For RTH patients with severe cardiovascular manifestations like the documented case with dilated cardiomyopathy, early aggressive management and consideration of advanced therapies including heart transplantation may be necessary when refractory to conventional approaches [90]. Future research should prioritize developing tissue-selective thyroid hormone analogs and RXR modulators that can bypass defective TR-RXR signaling in specific tissues. Additionally, exploring epigenetic modifications in thyroid hormone resistance represents a promising avenue, as epigenetic mechanisms (DNA methylation, histone modifications) significantly influence thyroid-specific gene expression and may contribute to phenotypic variability in RTH [91]. The integration of multi-omics approaches—genomics, transcriptomics, proteomics—will further elucidate how RXRγ and related nuclear receptor networks modulate thyroid hormone sensitivity and metabolic outcomes in RTH.
Resistance to Thyroid Hormone represents a sophisticated model of endocrine resistance with profound metabolic implications, particularly for basal metabolic rate regulation. The partnership between thyroid hormone receptors and RXRγ constitutes a critical node in thyroid hormone signaling whose disruption contributes to RTH pathophysiology. Evidence challenging the traditional "silent partner" model of RXR in TR/RXR heterodimers suggests more complex regulation than previously appreciated, with ligand-dependent RXR activity modulating TR function through corepressor dissociation. The severe cardiovascular manifestations observed in RTH cases underscore the clinical significance of this condition and necessitate heightened cardiological awareness. Future research integrating genetic, metabolic, and functional approaches will further elucidate how RXRγ deficiency and related nuclear receptor disruptions contribute to thyroid hormone resistance, potentially revealing novel therapeutic targets for this complex disorder. The metabolic dimensions of RTH, particularly its effects on basal metabolic rate and body composition, emphasize the central role of thyroid hormone signaling in human energy homeostasis and the systemic consequences of its disruption.
Thyroid hormones (THs) are essential master regulators of energy expenditure, thermogenesis, and substrate metabolism, exerting profound influence over basal metabolic rate (BMR) and overall energy homeostasis [4] [11]. The thyroid gland secretes thyroxine (T4) and the more biologically active triiodothyronine (T3), which collectively modulate metabolic processes across multiple tissues including liver, skeletal muscle, brown and white adipose tissue [11]. In metabolic patients, the interpretation of thyroid function tests (TFTs)—particularly TSH, FT4, FT3, and the FT3/FT4 ratio—requires special consideration as these parameters reflect not only thyroid gland function but also peripheral hormone metabolism intimately linked to metabolic status. Understanding these nuances is critical for researchers and drug development professionals investigating the intricate relationship between thyroid status and metabolic diseases such as obesity and type 2 diabetes (T2D) [55] [11]. This technical guide provides a comprehensive framework for interpreting TFTs in metabolic research contexts, supported by experimental protocols and analytical methodologies tailored for preclinical and clinical investigations.
Thyroid Physiology and Metabolic Regulation
The Hypothalamic-Pituitary-Thyroid (HPT) Axis
The HPT axis operates as a sophisticated feedback loop system that maintains thyroid hormone levels within a narrow physiological range. The hypothalamus releases thyrotropin-releasing hormone (TRH), which stimulates the pituitary gland to produce thyroid-stimulating hormone (TSH) [4]. TSH then triggers the thyroid gland to produce T4 and T3, with approximately 80% of secreted hormone being T4 and 20% T3 [4]. This system functions similarly to a thermostat: when circulating TH levels decrease, TSH production increases to stimulate thyroid hormone production; when TH levels rise, TSH secretion is suppressed [92] [93]. This delicate balance is frequently altered in metabolic disorders, where the HPT axis set-point may be reset, leading to complex alterations in standard TFT interpretation patterns [11].
Peripheral Activation of Thyroid Hormones
The metabolic activity of thyroid hormones depends significantly on peripheral regulation. T4 is largely considered a pro-hormone, requiring conversion to the biologically active T3 in target tissues by deiodinase enzymes (DIO1 and DIO2) [92] [4]. This conversion occurs primarily in the liver, kidneys, muscles, and adipose tissue [4]. A third deiodinase (DIO3) inactivates T3 and T4 [11]. The FT3/FT4 ratio has emerged as a valuable indicator of peripheral deiodinase activity, providing insights into tissue-level thyroid status beyond central HPT axis function [11]. In metabolic patients, alterations in deiodinase activity can significantly impact actual tissue thyroid status despite seemingly normal circulating hormone levels.
Figure 1: The Hypothalamic-Pituitary-Thyroid (HPT) Axis and Peripheral Hormone Activation. This regulatory system controls thyroid hormone production, secretion, and peripheral activation via deiodinase enzymes. The FT3/FT4 ratio reflects peripheral conversion efficiency.
Genomic and Non-Genomic Mechanisms of Metabolic Regulation
Thyroid hormones regulate metabolic processes through both genomic and non-genomic mechanisms. Genomic actions involve T3 binding to nuclear thyroid hormone receptors (TRs), which then heterodimerize with retinoid X receptors (RXRs) and bind to thyroid response elements (TREs) in target gene promoters [11]. This modulates expression of genes involved in metabolic pathways, including those regulating thermogenesis, lipogenesis, and glucose metabolism. Non-genomic actions occur more rapidly through binding to cell membrane receptors (such as integrins) and cytosolic proteins, affecting signal transduction pathways and cellular functions without directly altering gene expression [11]. These diverse mechanisms allow thyroid hormones to exert comprehensive control over metabolic rate and energy expenditure.
Interpretation of Thyroid Function Tests in Metabolic Patients
Standard Thyroid Function Test Interpretation
In clinical practice, thyroid function is primarily assessed through measurement of TSH, FT4, and FT3. The following table outlines the typical patterns observed in standard thyroid disorders:
Table 1: Standard Interpretation Patterns of Thyroid Function Tests
| Condition | TSH | FT4 | FT3 | Clinical Interpretation |
|---|---|---|---|---|
| Overt Hypothyroidism | High | Low | Normal/Low | Primary thyroid gland failure [92] [93] |
| Subclinical Hypothyroidism | High | Normal | Normal | Compensated thyroid dysfunction [94] [95] |
| Overt Hyperthyroidism | Low | High | High | Excessive thyroid hormone production [92] [93] |
| Subclinical Hyperthyroidism | Low | Normal | Normal | Partial thyroid autonomy [94] [95] |
| Central Hypothyroidism | Low/Normal | Low | Low | Pituitary or hypothalamic dysfunction [92] [94] |
TSH remains the most sensitive initial test for detecting thyroid dysfunction in most circumstances, as it often changes before actual thyroid hormone levels become abnormal [92] [93]. However, this conventional interpretation framework requires significant modification when applied to metabolic patients.
Special Considerations in Metabolic Patients
In individuals with metabolic conditions such as obesity and type 2 diabetes, thyroid function tests frequently display alterations that reflect adaptive metabolic responses rather than primary thyroid pathology:
Table 2: Thyroid Test Alterations in Metabolic Conditions
| Metabolic Condition | Typical TSH Pattern | Typical FT3/FT4 Pattern | Proposed Mechanism |
|---|---|---|---|
| Obesity | Mild elevation within upper reference range [55] [11] | Increased FT3/FT4 ratio [11] | Leptin-mediated TSH stimulation; enhanced peripheral conversion of T4 to T3 [11] |
| Type 2 Diabetes | Variable (often normal or slightly low) [11] | Decreased FT3/FT4 ratio (in advanced disease) [11] | Impaired deiodinase activity; insulin resistance effects on HPT axis [11] |
| Metabolic Syndrome | Tendency toward upper reference range [11] | Context-dependent alterations | Complex interplay of adipokines, inflammatory cytokines, and insulin resistance [11] |
Research indicates that in obesity, TSH shows significant positive associations with fat-free mass, muscle mass, and BMR, while FT3 inversely correlates with metabolic age and visceral fat [55]. These associations persist even when all thyroid parameters remain within population-based reference ranges, highlighting the continuous relationship between thyroid function and metabolic status across the spectrum from health to disease [55] [11].
The FT3/FT4 ratio has gained prominence as a particularly valuable parameter in metabolic research, as it reflects peripheral deiodinase activity and tissue-level thyroid hormone action more accurately than individual hormone measurements [11]. An elevated ratio suggests enhanced conversion of T4 to T3, potentially representing a compensatory mechanism to increase metabolic rate, while a decreased ratio may indicate impaired conversion capacity associated with certain metabolic pathologies.
Experimental Protocols for Thyroid-Metabolic Research
Laboratory Assessment of Thyroid Parameters
Protocol: Comprehensive Thyroid Function Testing in Metabolic Studies
Sample Collection: Collect venous blood samples after an overnight fast (10-12 hours) to minimize diurnal variation effects. TSH secretion follows a circadian rhythm with highest levels typically occurring during late evening and early night hours [11].
Sample Processing: Centrifuge samples at 3600 rpm for 5 minutes for serum separation. Store aliquots at -80°C if not analyzed immediately to preserve hormone stability [55].
Hormone Measurement: Utilize electrochemiluminescence immunoassays (ECLIA) for quantitative determination of TSH, FT4, and FT3 concentrations. Modern automated platforms (e.g., Cobas e 411, Mindray BS-480) provide reliable performance with low interassay coefficients of variation [55].
Quality Control: Implement internal quality control procedures using the Levey-Jennings control chart with Westgard rules to ensure analytical accuracy and reliability [55].
Calculation of FT3/FT4 Ratio: Compute the ratio using molar concentrations: FT3/FT4 ratio = FT3 (pmol/L) / FT4 (pmol/L). This ratio serves as a surrogate marker of peripheral deiodinase activity [11].
Important Methodological Considerations:
- Be aware that biotin supplements can significantly interfere with thyroid immunoassays, producing falsely abnormal results. Recommend discontinuation of biotin for at least 2 days prior to testing [92].
- During pregnancy and with estrogen-containing medications, total T4 and T3 measurements become unreliable due to increased binding proteins; always measure free hormone fractions in these situations [92] [94].
- Establish appropriate reference ranges specific to the population being studied, as "normal" ranges can vary significantly based on age, sex, ethnicity, and metabolic characteristics [94] [95].
Assessment of Metabolic Parameters
Protocol: Body Composition and Basal Metabolic Rate Measurement
Body Composition Analysis: Utilize bioelectrical impedance analysis (BIA) systems (e.g., Tanita SC 330ST) to assess body fat percentage, fat mass, fat-free mass, muscle mass, and visceral fat rating [55]. Ensure measurements are performed under standardized conditions: morning hours after overnight fast, empty bladder, and no strenuous exercise within 24 hours.
Basal Metabolic Rate Measurement:
- Perform indirect calorimetry using metabolic carts to measure resting energy expenditure (REE) under strictly standardized conditions [55] [11].
- Alternatively, calculate BMR using validated equations that incorporate fat-free mass, which shows strong correlation with measured REE and thyroid hormone levels [55].
Statistical Analysis: Employ Pearson's correlation analysis to examine relationships between thyroid parameters (TSH, FT3, FT4, FT3/FT4 ratio) and metabolic variables (BMR, body composition measures, metabolic age) [55]. Interpret correlation coefficients as follows: ±0.11-0.25 (weak), ±0.251-0.60 (moderate), ±0.61-0.80 (strong), ±0.81-1.0 (very strong).
Figure 2: Experimental Workflow for Thyroid-Metabolic Research. Integrated protocol for assessing relationships between thyroid function tests and metabolic parameters including body composition and basal metabolic rate.
The Scientist's Toolkit: Essential Research Reagents and Methodologies
Table 3: Key Research Reagent Solutions for Thyroid-Metabolic Investigations
| Reagent/Resource | Function/Application | Research Utility |
|---|---|---|
| ECLIA Kits (TSH, FT4, FT3) | Quantitative hormone measurement | Standardized assessment of thyroid function parameters [55] |
| Deiodinase Activity Assays | Measurement of DIO1, DIO2, DIO3 activity | Assessment of peripheral thyroid hormone activation/inactivation [11] |
| BIA Systems | Body composition analysis | Evaluation of fat mass, fat-free mass, visceral adiposity [55] |
| Indirect Calorimeters | Measurement of resting energy expenditure | Direct assessment of basal metabolic rate [55] [11] |
| Thyroid Hormone Receptor Ligands | TRα/TRβ-specific agonists/antagonists | Mechanistic studies of thyroid hormone action [11] |
| Animal Models (e.g., DIO mice) | Study of thyroid-metabolic interactions | Preclinical investigation of thyroid function in metabolic disease [11] |
Advanced Analytical Approaches
Machine Learning Applications in Thyroid-Metabolic Research
Advanced computational approaches are increasingly being applied to unravel the complex relationships between thyroid function and metabolic parameters:
Protocol: Machine Learning Analysis of Thyroid-Metabolic Interactions
Data Preprocessing: Handle missing data using appropriate imputation methods. Address class imbalance in thyroid status categories using techniques such as undersampling or oversampling [96] [97].
Feature Selection: Employ hybrid optimization algorithms (e.g., Particle Snake Swarm Optimization) to identify the most informative predictors of thyroid-metabolic relationships from high-dimensional datasets [98] [97].
Model Development: Implement ensemble methods such as Random Forest classifiers, which have demonstrated high accuracy (up to 98.7%) in predicting thyroid dysfunction in metabolic contexts [97].
Model Validation: Utilize k-fold cross-validation (typically k=5 or k=10) to assess model performance and generalizability [96] [97].
Performance Metrics: Evaluate models using comprehensive metrics including accuracy, precision, recall, F1-score, and specificity to ensure balanced performance across different thyroid status categories [97].
These advanced computational approaches can identify complex, non-linear relationships between thyroid parameters and metabolic traits that may not be apparent through conventional statistical analyses.
The interpretation of thyroid function tests in metabolic patients requires a sophisticated understanding that extends beyond conventional diagnostic algorithms. The FT3/FT4 ratio serves as a particularly valuable parameter reflecting peripheral thyroid hormone metabolism that is frequently altered in metabolic disorders. Researchers and drug development professionals should implement comprehensive assessment protocols that integrate traditional thyroid function tests with detailed metabolic phenotyping, including body composition analysis and basal metabolic rate measurement. The growing evidence supporting continuous relationships between thyroid parameters and metabolic traits across the euthyroid range suggests that future therapeutic strategies targeting thyroid hormone signaling may offer promising approaches for managing metabolic diseases, particularly through tissue-selective thyroid hormone receptor modulation that avoids systemic thyrotoxic effects.
Evidence and Evaluation: Corroborating Thyroid Hormone Effects on Human Metabolism
Thyroid hormones, thyroxine (T4) and triiodothyronine (T3), are fundamental regulators of basal metabolic rate, energy expenditure, and overall metabolic homeostasis [11]. They modulate critical processes including lipolysis, gluconeogenesis, and thermogenesis by acting on target tissues such as adipose tissue, liver, and skeletal muscle [11]. This review synthesizes cross-sectional clinical evidence investigating the correlations between thyroid parameters (TSH, T3, T4) and key metabolic indices—body mass index (BMI), waist circumference, and lipid profiles—within euthyroid populations and those with subclinical thyroid dysfunction. Understanding these relationships provides crucial insights for research on metabolic diseases and informs drug development targeting thyroid hormone pathways.
Clinical Data Synthesis: Thyroid-Metabolic Correlations
Cross-sectional studies consistently reveal significant associations between thyroid parameters and metabolic markers, even within the clinically defined euthyroid range.
Basal Metabolic Rate (BMR) and Thyroid Hormones
The most direct evidence of thyroid hormones' role in metabolism comes from studies measuring Basal Metabolic Rate. A 2025 cross-sectional study of 120 euthyroid adults demonstrated a strong, independent association between free T3 and BMR, measured via indirect calorimetry [25].
Table 1: Association between Free T3 Tertiles and Basal Metabolic Rate (BMR) in Euthyroid Adults
| Free T3 Tertile | Free T3 Range (pg/mL) | Mean BMR (kcal/day) ± SD | P-value vs. Tertile 1 |
|---|---|---|---|
| Tertile 1 (Low) | < 3.1 | 1345 ± 108 | (Reference) |
| Tertile 2 (Mid) | 3.1 – 3.7 | 1432 ± 102 | 0.02 |
| Tertile 3 (High) | > 3.7 | 1538 ± 115 | < 0.01 |
Multivariate regression analysis confirmed free T3 as an independent predictor of BMR (β = 0.31, p = 0.005) after adjusting for age, sex, BMI, and physical activity. Free T4 showed a more modest correlation (β = 0.19, p = 0.04), while TSH did not significantly correlate with BMR [25]. This underscores that T3, the biologically active hormone, is the primary driver of metabolic rate variation within the normal physiological range.
Anthropometric Measures (BMI and Waist Circumference) and Thyroid Parameters
Multiple studies indicate a link between thyroid function and adiposity measures. A 2013 cross-sectional study of 56 healthy individuals found gender-specific correlations. In females, T3 showed positive correlations with both BMI and waist circumference [99]. Conversely, a larger study of postmenopausal women found that serum TSH concentration significantly correlated with BMI, waist circumference, and waist-to-hip ratio (WHR) [100]. This suggests that even slight elevations in TSH, within the high-normal or subclinical hypothyroid range, are associated with increased adiposity, particularly central fat deposition.
A meta-analysis (total n = 107,734 for cross-sectional studies) consolidated these findings, concluding that increasing TSH concentration was associated with weight gain, while increasing FT4 values were associated with weight loss [11].
Table 2: Correlations of Thyroid Parameters with Anthropometric and Lipid Measures in Cross-Sectional Studies
| Thyroid Parameter | Anthropometric Correlation | Lipid Profile Correlation | Study Population |
|---|---|---|---|
| TSH (High-Normal) | Positive correlation with BMI, WC, WHR [100] | Positive correlation with TC, LDL-C, TG; Inverse with HDL-C [101] [100] | Postmenopausal women [100] |
| Free T3 | Positive correlation with BMI and WC (in females) [99] | Inverse correlation with HDL (in males) [99] | Healthy adults (n=56) [99] |
| Free T4 | Not specified in results | Positive correlation with LDL [99] | Healthy adults (n=56) [99] |
| T3/T4 Ratio | Determinant of BMI and WC variation [11] | Indicator of peripheral deiodinase activity [11] | Large cohort meta-analysis [11] |
Lipid Profiles and Thyroid Parameters
The connection between thyroid function and lipid metabolism is well-established. Overt hypothyroidism leads to pronounced hypercholesterolemia, primarily due to a reduction in low-density lipoprotein (LDL) receptor activity and decreased catabolism of LDL particles [102]. Cross-sectional evidence shows this relationship extends into the euthyroid and subclinical hypothyroid ranges.
A 2017 study comparing euthyroid individuals with high-normal TSH (2.0-5.5 mIU/L) to those with low-normal TSH (0.3-2.0 mIU/L) found that BMI and LDL-C were significantly higher in the high-TSH group after adjusting for confounders like age, sex, and diet [101]. Another study found TSH levels were positively correlated with total cholesterol and triglycerides, and inversely correlated with HDL-C [100]. The molecular basis for this involves T3's regulation of the sterol regulatory element-binding protein-2 (SREBP-2), which modulates cholesterol biosynthesis and LDL receptor expression [102].
Detailed Experimental Protocols from Key Studies
To facilitate replication and critical evaluation, this section outlines the methodologies of pivotal studies cited in this review.
Protocol 1: BMR and Thyroid Hormone Variability (2025)
This study investigated the association between intra-individual thyroid hormone variability and metabolic rate in euthyroid adults [25].
- Study Design: Cross-sectional observational study.
- Participants: 120 clinically euthyroid adults (aged 20-50 years), with TSH between 0.45–4.5 mIU/L and free T3/T4 within normal range. Exclusion criteria included history of thyroid disease, thyroid-modulating medications, or chronic systemic illness.
- Anthropometric & Clinical Assessment: Height and weight were measured to calculate BMI. Physical activity level was assessed using the International Physical Activity Questionnaire (IPAQ).
- Biochemical Evaluation: Fasting venous blood samples were collected between 8:00 and 10:00 AM. Serum free T3, free T4, and TSH were measured in duplicate using a chemiluminescent immunoassay analyzer (ADVIA Centaur XP, Siemens Healthineers).
- Metabolic Rate Assessment: BMR was measured using indirect calorimetry (COSMED Quark RMR) under standard resting conditions in a thermo-neutral environment. Participants were instructed to abstain from caffeine, alcohol, and vigorous exercise for 24 hours prior. The measurement lasted 30 minutes, with the first 5 minutes excluded for acclimatization.
- Statistical Analysis: Participants were stratified into tertiles based on free T3 and free T4. Pearson correlation and multivariate linear regression were used, adjusting for age, sex, BMI, and physical activity. A p-value <0.05 was considered significant.
Protocol 2: TSH, Lipids, and BMI in Euthyroid Adults (2017)
This study explored the relationship between BMI, waist-to-hip ratio, lipid parameters, and high-normal TSH [101].
- Study Design: Cross-sectional study.
- Participants: 140 euthyroid individuals divided into two groups: a high-TSH group (TSH between 2.0 and 5.5 mIU/L, n=67) and a low-TSH group (TSH between 0.3 and 2.0 mIU/L, n=73).
- Biochemical Analysis: After an overnight fast, total cholesterol, triglyceride (TG), HDL-C, LDL-C, TSH, T4, and T3 were measured. LDL cholesterol was calculated using the Friedewald formula.
- Anthropometric Measurements: Height and weight were measured with a stadiometer to calculate BMI. Waist-to-hip ratio was determined from waist and hip circumference measurements.
- Statistical Analysis: The independent t-test and a general linear model were used, adjusting for age, sex, calorie intake, total fat and carbohydrate intakes, and physical activity.
The Scientist's Toolkit: Research Reagent Solutions
This table details key reagents and tools essential for conducting research in thyroid-metabolic interactions.
Table 3: Essential Research Reagents and Tools for Thyroid-Metabolic Studies
| Reagent / Tool | Specific Example | Function / Application in Research |
|---|---|---|
| Immunoassay Systems | Chemiluminescent Immunoassay Analyzer (e.g., ADVIA Centaur XP) | Quantitative measurement of serum TSH, free T3, free T4 levels with high sensitivity and specificity [25]. |
| Calorimetry Equipment | Indirect Calorimeter (e.g., COSMED Quark RMR) | Gold-standard measurement of Basal Metabolic Rate (BMR) via oxygen consumption and CO2 production [25]. |
| Lipid Profile Assays | Enzymatic Colorimetric Kits (e.g., Cholesterol Esterase, GPO-POD) | Quantitative measurement of total cholesterol, HDL-C, and triglycerides in serum. LDL-C is often calculated [99]. |
| Activity Assessment Tools | International Physical Activity Questionnaire (IPAQ) | Standardized tool to assess and categorize physical activity levels of participants as a covariate in metabolic studies [25]. |
| Cell Culture Models | HepG2 Cell Line | Human hepatoma cell line used to study molecular mechanisms of T3 and T2 on lipid metabolism, SREBP processing, and gene expression [102]. |
Molecular Pathways Linking Thyroid Hormones to Metabolic Control
Thyroid hormones regulate metabolism through genomic and non-genomic pathways. The genomic actions are mediated by thyroid hormone receptors (TRs) binding to thyroid response elements (TREs) in target genes, modulating the expression of key metabolic regulators like SREBP-2 for cholesterol synthesis and ChREBP for lipogenesis [11] [102]. The metabolite 3,5-diiodo-l-thyronine (T2) exerts effects via alternative pathways, potentially involving mitochondrial sirtuin 1 (SIRT1) activation [102].
Figure 1: Thyroid Hormone Metabolic Signaling Pathways. This diagram illustrates the genomic and non-genomic mechanisms through which thyroid hormones T4 and T3 regulate key metabolic processes including lipid synthesis, mobilization, and energy expenditure. Abbreviations: TR: Thyroid Hormone Receptor; TRE: Thyroid Response Element; SREBP-2: Sterol Regulatory Element-Binding Protein 2; LDLR: Low-Density Lipoprotein Receptor; HMGCR: 3-Hydroxy-3-Methylglutaryl-CoA Reductase; ChREBP: Carbohydrate-Response Element-Binding Protein; Ucp1: Uncoupling Protein 1; NEFA: Non-Esterified Fatty Acids; LPL: Lipoprotein Lipase; HL: Hepatic Lipase; CETP: Cholesteryl Ester Transfer Protein.
The following diagram summarizes the integrated experimental workflow for conducting cross-sectional clinical studies in this field, from participant recruitment to data analysis.
Figure 2: Cross-Sectional Study Workflow. A standardized protocol for clinical investigations correlating thyroid parameters with metabolic indices, integrating biochemical, anthropometric, and calorimetric measurements. WHR: Waist-to-Hip Ratio; BMR: Basal Metabolic Rate.
Cross-sectional clinical evidence firmly establishes that thyroid parameters exhibit significant correlations with BMI, waist circumference, and lipid profiles, even within the euthyroid range. Free T3 is a primary driver of basal metabolic rate variation, while TSH levels in the high-normal range are consistently associated with unfavorable lipid profiles and increased adiposity. These findings underscore the role of thyroid hormones as key modulators of human metabolism. The detailed experimental protocols and molecular pathways outlined provide a framework for researchers and drug development professionals to explore therapeutic interventions targeting thyroid hormone signaling for metabolic disorders. Future research should prioritize longitudinal designs to elucidate causality and further investigate the therapeutic potential of thyroid hormone analogues.
Thyroid hormones (THs), primarily thyroxine (T4) and triiodothyronine (T3), are fundamental regulators of energy expenditure and basal metabolic rate (BMR) in humans. Their role extends from cellular metabolism to whole-body energy homeostasis, influencing lipid, carbohydrate, and protein metabolism in peripheral tissues including liver, skeletal muscle, and adipose tissue [11] [75]. The hypothalamic-pituitary-thyroid (HPT) axis maintains circulating TH levels, but intracellular availability of active T3 is precisely controlled in target tissues by deiodinase enzymes (DIO1, DIO2, DIO3), which activate or inactivate THs [75]. This review examines evidence from key interventional studies on the metabolic consequences of both TH administration and suppression, framing them within the context of BMR research. Understanding these interventions provides critical insights for developing therapies targeting metabolic disorders.
Molecular Mechanisms of Thyroid Hormone Action on Metabolism
Genomic and Non-Genomic Signaling Pathways
Thyroid hormones exert their metabolic effects through genomic and non-genomic mechanisms. Genomic actions involve T3 binding to nuclear thyroid hormone receptors (TRα and TRβ), which heterodimerize with retinoid X receptors (RXRs) and regulate transcription of metabolic genes by binding to thyroid hormone response elements (TREs) [11]. Non-genomic actions occur more rapidly through binding to cell membrane receptors such as integrin αvβ3, affecting signal transduction pathways [11]. The intracellular concentration of active T3 is critically regulated by deiodinases: DIO1 and DIO2 convert T4 to active T3, while DIO3 inactivates T3 and T4 [11] [75]. This fine-tuning mechanism enables tissue-specific metabolic regulation without altering systemic TH levels.
Tissue-Specific Metabolic Effects
The metabolic impact of TH varies significantly across tissues, with deiodinases providing cell-autonomous control. In the liver, TH regulates lipid homeostasis, cholesterol synthesis, and bile acid production, primarily through T3-TRβ mediated pathways [75]. In brown adipose tissue (BAT), DIO2-mediated T3 production is crucial for uncoupling protein 1 (UCP1) expression and thermogenesis [11]. Skeletal muscle metabolism is influenced by TH through fiber-type shifting (increasing type II fast-twitch fibers) and regulating glucose uptake [2] [75]. TH also plays a role in pancreatic β-cell development and function, influencing insulin secretion and glucose homeostasis [75]. The diagram below illustrates the core signaling pathway and tissue-specific effects.
Key Interventional Study Designs and Methodologies
Study Populations and Thyroid Status Definitions
Interventional studies on thyroid hormone metabolism have examined distinct population groups with carefully defined thyroid status. Chronic suppression studies typically involve women receiving TSH-suppressive levothyroxine (LT4) doses (>1-2 years) for thyroid cancer management, compared against euthyroid controls on replacement LT4 and healthy untreated controls [103]. Weight-loss intervention studies generally recruit overweight or obese adults (BMI 25-40 kg/m²) with normal baseline thyroid function (TSH 0.1-4.5 mIU/L) [104]. These studies exclude participants with pre-existing thyroid disease, diabetes, cardiovascular conditions, or those using medications affecting thyroid function or weight [104] [103].
Metabolic Assessment Protocols
Comprehensive metabolic phenotyping in these studies employs standardized protocols:
- Resting Energy Expenditure (REE): Measured by indirect calorimetry after 12-hour fast using a ventilated hood system (e.g., VMax Encore 29N), with calculated REE based on the Weir equation [103].
- Body Composition: Assessed via dual-energy X-ray absorptiometry (DEXA) to quantify fat mass, lean body mass, and percentage body fat [104] [103].
- Thyroid Function Tests: Serum TSH, free T3, free T4, total T3, and total T4 measured using electrochemiluminescence immunoassays (e.g., Roche E Modular system) [104].
- Additional Metabolic Parameters: Fasting glucose, insulin, lipids, leptin, and inflammatory markers analyzed from serum samples [104].
- Dietary Intake Assessment: Evaluated through multiple 24-hour food recall interviews using standardized systems like Nutrition Data System for Research (NDSR) [103].
The following diagram illustrates a typical experimental workflow for assessing metabolic outcomes in thyroid hormone intervention studies.
Metabolic Outcomes of Thyroid Hormone Interventions
Thyroid Hormone Suppression Therapy
Studies on long-term TSH-suppressive LT4 therapy reveal complex metabolic effects. One cross-sectional comparison found that women receiving suppressive LT4 doses had 6% higher REE per kilogram lean body mass compared to euthyroid women on replacement LT4 doses, despite comparable body composition across groups [103]. Free T3 levels showed a direct correlation with REE, suggesting that tissue T3 availability significantly influences energy expenditure independent of TSH levels [103]. Interestingly, suppressive therapy did not significantly affect body composition, thermic effect of food, physical activity energy expenditure, or caloric intake compared to control groups [103].
Table 1: Metabolic Parameters in Thyroid Hormone Suppression Studies
| Parameter | LT4 Suppression Group | LT4 Euthyroid Group | Healthy Control Group | Statistical Significance |
|---|---|---|---|---|
| REE/kg LBM | 100% (reference) | 94% | 96% | p = 0.04 |
| Free T3 | 100% (reference) | 90% | 100% | p = 0.007 |
| Body Fat % | No significant difference | No significant difference | No significant difference | p > 0.05 |
| Lean Body Mass | No significant difference | No significant difference | No significant difference | p > 0.05 |
| Thermic Effect of Food | No significant difference | No significant difference | No significant difference | p > 0.05 |
Thyroid Hormones in Diet-Induced Weight Loss
The POUNDS LOST trial provided compelling evidence that baseline thyroid function within normal physiological range predicts weight loss responsiveness. Over 569 overweight/obese participants underwent a 2-year dietary intervention with 750 kcal/day deficit [104]. Higher baseline free T3 and free T4 levels were significantly associated with greater weight loss during the first 6 months, after multivariate adjustments [104]. Participants in the highest tertile of free T3 lost -5.39 ± 0.9 kg compared to -3.87 ± 0.9 kg in the lowest tertile (p-trend = 0.02). Similarly, those in the highest free T4 tertile lost -5.88 ± 0.9 kg versus -4.09 ± 0.9 kg in the lowest tertile (p-trend = 0.004) [104]. Changes in free T3 and total T3 levels positively correlated with changes in body weight, RMR, body fat mass, and metabolic parameters including glucose, insulin, triglycerides, and leptin at 6 and 24 months [104].
Table 2: Thyroid Hormones as Predictors of Weight Loss in the POUNDS LOST Trial
| Thyroid Parameter | Weight Loss in Lowest Tertile (kg) | Weight Loss in Highest Tertile (kg) | P-trend | Associations with Metabolic Parameters |
|---|---|---|---|---|
| Free T3 | -3.87 ± 0.9 | -5.39 ± 0.9 | 0.02 | Positive association with changes in RMR, body fat, glucose, insulin, triglycerides, leptin |
| Free T4 | -4.09 ± 0.9 | -5.88 ± 0.9 | 0.004 | Inverse association with baseline weight and BMI |
| Total T3 | Not significant | Not significant | >0.05 | Positive association with changes in RMR and metabolic parameters |
| TSH | Not significant | Not significant | >0.05 | Not associated with weight loss magnitude |
The Researcher's Toolkit: Essential Reagents and Methodologies
Table 3: Key Research Reagents and Methods for Thyroid Metabolic Studies
| Reagent/Method | Application | Technical Specifications | Representative Use |
|---|---|---|---|
| Electrochemiluminescence Immunoassay | Quantification of TSH, fT3, fT4, total T3, total T4 | Intra-assay CV: 2.1-3.4% (fT3), 3.3-6.6% (fT4); Inter-assay CV: 1.8-5.4% (TSH) | POUNDS LOST trial: Roche E Modular system [104] |
| Indirect Calorimetry | Measurement of resting energy expenditure (REE) | VMax Encore 29N system; REE calculated via Weir equation | LT4 suppression study: REE measured after 12-hour fast [103] |
| Dual X-ray Absorptiometry (DEXA) | Body composition analysis (fat mass, lean mass, bone density) | Hologic QDR 4500A or Discovery A systems | Body composition assessment in multiple trials [104] [103] |
| 24-hour Urine Urea Nitrogen | Estimation of protein oxidation | Jequier equations for macronutrient oxidation | Substrate utilization analysis in LT4 study [103] |
| Actical Accelerometer | Physical activity energy expenditure | 7-day wearing protocol; measures sedentary, light, moderate, vigorous activity | Activity assessment in LT4 suppression research [103] |
Implications for Drug Development and Future Research
The findings from thyroid hormone interventional studies offer promising directions for metabolic drug development. The tissue-specific action of deiodinases presents attractive targets for developing selective TH mimetics that could enhance energy expenditure without systemic thyrotoxic effects [75]. Specifically, DIO2 agonists could potentially increase local T3 production in adipose tissue to promote thermogenesis and lipid oxidation, while DIO1 inhibitors might reduce hepatic glucose production [75]. The correlation between DIO2 gene polymorphisms and metabolic diseases further supports this approach [75].
Future research should address several knowledge gaps: (1) long-term metabolic effects of tissue-specific TH modulation; (2) interaction between TH signaling and other metabolic pathways in different organs; (3) potential synergies between TH-based therapies and existing metabolic drugs; and (4) personalized approaches based on deiodinase polymorphisms and tissue-specific TH sensitivity. Well-designed interventional studies with comprehensive metabolic phenotyping remain essential to translate these findings into clinically viable therapies for obesity and metabolic disorders.
Thyroid hormones (THs), primarily thyroxine (T4) and triiodothyronine (T3), are crucial regulators of development, growth, and metabolism, with particular importance in regulating basal metabolic rate (BMR) [2] [4] [72]. The biological effects of THs are mediated through their nuclear receptors, thyroid hormone receptor α (TRα) and thyroid hormone receptor β (TRβ), which function as ligand-activated transcription factors [2] [20]. These receptors exist as multiple isoforms (TRα1, TRβ1, and TRβ2) encoded by separate genes and display distinct tissue distribution patterns [105]. TRs regulate gene expression through two primary signaling modalities: canonical signaling involves TR binding to thyroid hormone response elements (TREs) in target genes to regulate transcription, while noncanonical signaling activates cytosolic signaling pathways without direct DNA binding [106] [107].
Understanding the tissue-specific functions of TR isoforms has been significantly advanced through the generation and characterization of knockout mouse models. These models have revealed that TRα and TRβ mediate both overlapping and distinct physiological functions, with important implications for metabolic regulation, sensory function, and development [106] [105]. This review synthesizes findings from TR knockout studies to elucidate how tissue-specific TH action through different receptor isoforms contributes to systemic metabolic control, with particular relevance to BMR research.
Methodological Approaches in TR Knockout Research
Genetic Manipulation Strategies
Research on tissue-specific TH action has employed several sophisticated genetic engineering approaches, each designed to address distinct biological questions. The table below summarizes the primary mouse models used in these investigations.
Table 1: Key Genetic Mouse Models in Thyroid Hormone Receptor Research
| Model Type | Genetic Alteration | Primary Functional Consequence | Key Investigative Applications |
|---|---|---|---|
| TRα Knockout (TRαKO) | Complete deletion of TRα | Absence of all TRα-mediated signaling | Assessing total TRα contribution to physiology [106] |
| TRβ Knockout (TRβKO) | Complete deletion of TRβ | Absence of all TRβ-mediated signaling | Determining TRβ-specific functions [106] [105] |
| TRαGS Mutant | Point mutation in DNA-binding domain | Disrupted canonical signaling; intact noncanonical signaling | Dissecting canonical vs. noncanonical TRα actions [106] [107] |
| TRβGS Mutant | Point mutation in DNA-binding domain | Disrupted canonical signaling; intact noncanonical signaling | Dissecting canonical vs. noncanonical TRβ actions [106] |
| Dominant Negative TRβ | Point mutations conferring dominant negative activity | Impaired TRβ function with resistance to thyroid hormone | Modeling Resistance to Thyroid Hormone syndrome [105] |
Phenotypic Assessment Methodologies
Multiparameter phenotyping represents a critical approach in characterizing TR knockout models, providing comprehensive insights into the physiological consequences of receptor disruption. Standardized assessment protocols typically include:
- Metabolic profiling: Measurement of oxygen consumption, respiratory quotient, daily energy expenditure, and resting metabolic rate using indirect calorimetry systems [108]. Basal metabolic rate determination under thermoneutral conditions to minimize thermal stress contributions.
- Body composition analysis: Quantification of fat and lean mass using nuclear magnetic resonance (NMR) or dual-energy X-ray absorptiometry (DEXA) [108].
- Glucose homeostasis assessment: Intraperitoneal glucose and insulin tolerance tests with serial blood glucose measurements [108].
- Thermogenic capacity evaluation: Infrared thermography of brown adipose tissue (BAT) depots, cold challenge tests, and UCP1 expression analysis in BAT and browning-prone white adipose tissue [108].
- Cardiovascular function monitoring: Heart rate measurements, echocardiography, and electrocardiography to assess cardiac thyroid hormone sensitivity [105].
- Sensory function testing: Auditory brainstem response measurements for hearing assessment and visual acuity tests for retinal function [106].
The Scientist's Toolkit: Essential Research Reagents
Table 2: Key Reagents for Investigating Thyroid Hormone Receptor Function
| Research Reagent | Function/Application | Experimental Utility |
|---|---|---|
| T3 (3,3',5-triiodothyronine) | Active thyroid hormone form used for experimental induction of hyperthyroidism | Assessing TH sensitivity, gene expression responses, and metabolic activation [108] |
| TR isoform-specific antibodies | Immunodetection of specific TR proteins in tissues and cells | Western blotting, immunohistochemistry, and immunoprecipitation applications [109] |
| TH response element (TRE) reporters | Plasmid constructs containing TRE sequences linked to reporter genes | Measuring canonical TR signaling activity in vitro [109] |
| Deiodinase inhibitors | Compounds that block conversion of T4 to T3 (e.g., iopanoic acid) | Investigating local TH activation in specific tissues [2] |
| TR isoform-selective agonists | Synthetic compounds with preference for TRα or TRβ (e.g, KB141, MB07811) | Dissecting isoform-specific effects and potential therapeutic applications [105] [20] |
Tissue-Specific Phenotypes of TR Knockout Models
Metabolic Tissues and Energy Homeostasis
The investigation of TR knockout models has revealed striking tissue-specific phenotypes, particularly in metabolic tissues. TRα appears to play a predominant role in muscle metabolism, with TRα knockout mice displaying significant perturbations in this tissue [106]. Additionally, noncanonical TRα action has been demonstrated to improve energy utilization and prevent hyperphagia observed in female TRαKO mice, suggesting important sex-specific effects on energy balance [106].
Brown adipose tissue function is strongly influenced by TR-mediated signaling, with research demonstrating that maternal TRβ activation plays a critical role in programming offspring BAT thermogenesis [108]. Offspring of T3-treated dams exhibited increased interscapular BAT temperature shortly after birth, a phenotype that persisted into adulthood [108]. This BAT programming required intact maternal TRβ signaling, as offspring of TRβ-/- mothers displayed the opposite phenotype despite normal circulating TH levels, highlighting the importance of maternal TRβ signaling in fetal metabolic programming [108].
The role of TRs in white adipose tissue function and the browning process has also been established. THs regulate the gradual acquisition of brown adipocyte characteristics by white adipocytes, a process with potential therapeutic relevance for metabolic diseases [20]. Both TRα and TRβ contribute to this regulation, though their specific roles continue to be elucidated.
Diagram 1: Maternal TRβ signaling programs offspring metabolism. This diagram illustrates how maternal thyroid hormone receptor β activation during gestation programs persistent metabolic phenotypes in offspring through alterations in maternal metabolites, independent of offspring genotype.
Sensory Systems
Sensory systems display remarkable TR isoform specificity, with hearing impairment representing one of the most prominent phenotypes of TRβ knockout mice [106] [105]. The auditory function deficit in TRβKO mice is severe, demonstrating the critical role of TRβ in cochlear development and function. TRα deficiency also affects hearing, though to a lesser extent, suggesting some functional overlap or complementary roles [106].
Visual function is similarly regulated by both TR isoforms, with abnormalities in visual acuity and retinal thickness observed in both TRα and TRβ knockout models [106]. Retinal vascularization defects appear specifically linked to TRα deficiency, as this phenotype is observed in TRαKO but not TRαGS mice, indicating a role for noncanonical TRα signaling in retinal development [106].
Cardiovascular System
The cardiovascular system demonstrates particularly interesting TR isoform specificity. TRα is the predominant isoform in the heart, and TRα knockout mice display significant cardiac phenotypes including reduced heart rate and contractility [2] [105]. This aligns with the clinical observation that patients with Resistance to Thyroid Hormone syndrome (primarily linked to TRβ mutations) often present with tachycardia, suggesting that cardiac TRα remains responsive to thyroid hormone despite defective TRβ signaling [105].
Table 3: Tissue-Specific Phenotypes of TR Knockout Models
| Tissue/System | TRα-Specific Phenotypes | TRβ-Specific Phenotypes | Shared Phenotypes |
|---|---|---|---|
| Metabolic Tissues | Muscle metabolism perturbations [106]; Prevention of hyperphagia in females (noncanonical) [106] | Programming of BAT thermogenesis (maternal) [108] | Regulation of browning in white adipose tissue [20] |
| Sensory Systems | Moderate hearing impact [106]; Reduced retinal vascularization (noncanonical) [106] | Severe hearing impairment [106] [105] | Visual acuity deficits; Reduced retinal thickness [106] |
| Cardiovascular | Bradycardia; Reduced contractility [105] | Tachycardia in RTH syndrome [105] | - |
| Immune System | Altered Treg responses; Inflammatory monocyte regulation [107] | - | - |
| Hematopoietic | Macrocytic anemia (noncanonical) [106] | - | - |
| CNS/Behavior | Increased anxiety-related behavior (noncanonical) [106] | - | - |
Immune System
Recent research has revealed complex roles for TRα signaling in immune regulation, particularly evident during challenge with pathogens such as influenza virus. Mice lacking canonical TRα signaling (TRαGS) demonstrated prolonged survival and reduced disease severity following influenza infection, associated with enhanced anti-inflammatory Treg responses and decreased pro-inflammatory CD4 and CD8 T cell activation [107]. In contrast, complete TRα knockout (TRαKO) resulted in elevated viral titers and increased inflammatory monocyte responses early during infection [107]. These findings demonstrate the nuanced role of TRα in immune regulation, with noncanonical signaling sufficient for certain immunomodulatory functions while complete TRα deficiency impairs antiviral defense.
Canonical versus Noncanonical Signaling in Tissue-Specific Actions
The development of TR mutants with disrupted DNA binding (TRGS models) has enabled researchers to distinguish between canonical and noncanonical TR actions in different tissues. Surprisingly, selective abrogation of canonical TR action often had minimal phenotypic consequences, suggesting that noncanonical signaling can compensate for many TR functions [106].
Several specific phenotypes manifest only in complete knockout models but not in DNA-binding-deficient mutants, indicating their dependence on noncanonical signaling mechanisms. These include macrocytic anemia, reduced retinal vascularization, and increased anxiety-related behavior in TRαKO mice that are not observed in TRαGS animals [106]. Similarly, noncanonical TRα action was sufficient to maintain normal energy utilization and prevent the hyperphagia seen in female TRαKO mice [106].
Diagram 2: Canonical vs. noncanonical TR signaling mechanisms. This diagram contrasts the two primary signaling modalities of thyroid hormone receptors and summarizes phenotypic evidence from knockout studies indicating which signaling pathway mediates specific physiological functions.
Implications for Metabolic Research and Therapeutic Development
The tissue-specific functions of TR isoforms revealed through knockout studies have significant implications for understanding the regulation of basal metabolic rate and developing novel therapeutic approaches for metabolic disorders.
The distinct roles of TRα and TRβ in different metabolic tissues suggest opportunities for developing TR isoform-selective agonists that could target specific metabolic pathways while minimizing side effects. For instance, TRβ-selective agonists might modulate hepatic lipid metabolism without causing cardiotoxicity mediated primarily through TRα [105] [20]. Similarly, the recognition that noncanonical signaling mediates some beneficial metabolic effects suggests additional avenues for therapeutic intervention.
The role of maternal TRβ signaling in programming offspring metabolism highlights the importance of considering developmental exposure to thyroid hormones and other metabolic signals [108]. This fetal programming perspective suggests that early-life interventions targeting the thyroid hormone system might have long-lasting effects on metabolic health.
From a methodological perspective, the phenotypic differences between complete knockout models (TRαKO, TRβKO) and DNA-binding-deficient mutants (TRαGS, TRβGS) underscore the importance of selecting appropriate genetic models to address specific research questions. Investigations of noncanonical signaling require models that specifically disrupt DNA binding while preserving noncanonical functions.
Comparative analysis of TRα and TRβ knockout models has revealed a complex landscape of tissue-specific thyroid hormone action with significant implications for basal metabolic rate regulation. Key lessons from these models include: (1) TRα and TRβ mediate both distinct and overlapping functions in different tissues; (2) noncanonical signaling contributes substantially to the spectrum of physiological TH effects, particularly in metabolic regulation; (3) developmental timing and maternal thyroid status permanently program metabolic phenotypes in offspring through specific TR-dependent mechanisms; and (4) the intricate balance between canonical and noncanonical signaling provides multiple regulatory nodes for fine-tuning tissue-specific metabolic responses.
These insights not only advance our fundamental understanding of thyroid hormone biology but also inform the development of targeted therapeutic strategies for metabolic diseases. Future research should continue to elucidate the molecular mechanisms underlying tissue-specific TR actions and explore the therapeutic potential of selectively modulating these pathways to manage disorders of energy balance and metabolism.
This technical guide delineates the framework for validating the epigenetic and transcriptional alterations induced by triiodothyronine (T3) in human monocytes, contextualized within its established role in regulating basal metabolic rate (BMR). Thyroid hormones are potent modulators of cellular metabolism and immune function. Recent evidence indicates that T3 can instigate epigenetic reprogramming and transcriptional shifts in immune cells, such as monocytes, suggesting a novel mechanism bridging endocrine signaling and immunometabolism. This whitepaper provides an in-depth analysis of the molecular mechanisms, summarizes quantitative omics data, details essential experimental protocols, and catalogues critical reagents for researchers and drug development professionals investigating this cross-disciplinary field.
Thyroid hormones (THs), primarily thyroxine (T4) and the more biologically active triiodothyronine (T3), are fundamental regulators of basal metabolic rate, governing processes such as oxygen consumption, thermogenesis, and carbohydrate and lipid metabolism [2] [11]. Their classical genomic action is mediated by binding to nuclear thyroid hormone receptors (TRs), which function as ligand-activated transcription factors modulating gene expression by binding to thyroid hormone response elements (TREs) in target genes [73]. The basal metabolic rate is largely controlled through the regulation of genes involved in energy expenditure, including mitochondrial enzymes and the Na+/K+ ATPase [2].
Beyond these well-characterized metabolic effects, a growing body of evidence underscores a significant immunomodulatory role for thyroid hormones. Innate immune cells, including monocytes and macrophages, are responsive to T3, which can alter their inflammatory responses and functional phenotypes [110]. These changes are facilitated by epigenetic remodeling—reversible modifications to chromatin structure and DNA that alter gene accessibility without changing the DNA sequence itself. The validation of T3-induced epigenetic and transcriptional changes in monocytes thus provides a critical model for understanding how systemic metabolic signals can directly reprogram innate immune cell function, with implications for conditions ranging from metabolic syndrome to cancer and autoimmune disorders [111] [112].
Molecular Mechanisms of T3 Signaling and Epigenetic Regulation
Genomic and Non-Genomic Thyroid Hormone Signaling
The cellular action of T3 is mediated through a combination of genomic and non-genomic pathways, both contributing to its epigenetic and transcriptional effects.
- Genomic Signaling: The canonical pathway involves the binding of T3 to nuclear thyroid hormone receptors (TRα and TRβ). Ligand-bound TRs heterodimerize with the retinoid X receptor (RXR) and bind to TREs in the regulatory regions of target genes [73] [7]. This recruitment leads to a large complex of coactivators (CoAs) or corepressors (CoRs), which possess histone-modifying enzymes such as histone acetyltransferases (HATs) or histone deacetylases (HDACs), respectively. These enzymes directly alter the local chromatin architecture, facilitating or repressing transcription [73].
- Non-Genomic Signaling: T3 can also initiate rapid signaling cascades by binding to integrin αVβ3 on the cell membrane, activating pathways such as MAPK and ERK1/2 [7]. Additionally, it can induce rapid PI3K signal transduction. These pathways can ultimately influence nuclear transcription factors and epigenetic modifiers, thereby integrating rapid signaling with long-term transcriptional regulation [110].
Linking Mitochondrial Metabolism to Epigenetics
A key mechanism by which T3 may influence the epigenome is through modulating mitochondrial metabolism. T3 is a primary regulator of mitochondrial biogenesis and oxidative phosphorylation (OXPHOS) [11]. Enhanced mitochondrial respiration increases the production of metabolic intermediates like acetyl-CoA, which serves as the essential donor for histone acetylation [112]. By increasing the availability of acetyl-CoA, T3 can promote histone acetylation (e.g., H3K9Ac), leading to a more open chromatin state and increased transcription of genes involved in immune and metabolic processes [112]. This establishes a direct link between T3-induced metabolic shifts and epigenetic reprogramming.
The diagram below illustrates the integrated signaling and epigenetic mechanisms of T3 action in a human monocyte.
Research employing transcriptomic and methylomic profiling of human monocytes has provided quantitative insights into the scope of T3-induced remodeling. The following tables consolidate key findings from a seminal study that treated human monocytes with 5 µM T3 for 4 and 24 hours under resting and LPS-stimulated conditions [110].
Table 1: Transcriptional Changes in Resting Human Monocytes After T3 Exposure (5 µM)
| Gene/Pathway Affected | Regulation Direction | Fold Change | Functional Implication |
|---|---|---|---|
| TLR4 | Upregulated | >1.5 | Enhanced sensitivity to pathogen-associated molecular patterns |
| Monocyte-to-Macrophage Differentiation Genes | Modulated | Limited Set | Potential priming for differentiation |
| Metabolism & Immune Process Genes | Enriched | N/A | Suggests broader metabolic & immunomodulatory reprogramming |
Note: T3 induced a limited but significant transcriptional response in resting monocytes, primarily affecting genes associated with differentiation and immune recognition [110].
Table 2: DNA Methylation Changes in Human Monocytes After T3 Exposure (5 µM)
| Condition | Number of DMPs | Key Observation | Biological Interpretation |
|---|---|---|---|
| Resting Monocytes | Several Hundred | Attenuated differentiation-associated methylation changes | T3 may interfere with standard epigenetic progression |
| LPS-Stimulated Monocytes | Unique Signature | 27% of LPS-induced DMPs were attenuated; unique T3+LPS signature | T3 significantly alters the inflammatory epigenetic program |
| Overlap with DEGs | Minimal | Poor correlation between DMPs and differentially expressed genes | Suggests other epigenetic mechanisms are primary drivers |
Abbreviation: DMPs, Differentially Methylated CpG Probes. The data indicates that T3 exerts a significant effect on the monocyte methylome, particularly in an inflammatory context, and that these DNA methylation changes may operate independently of direct transcriptional changes [110].
Experimental Protocols for Key Methodologies
This section outlines the core methodologies for investigating T3-induced remodeling, based on established in vitro models [110].
Primary Human Monocyte Isolation and Culture
- Source: Human buffy coats obtained from blood banks under ethical approval.
- PBMC Isolation: Dilute buffy coats with PBS and layer over Ficoll-Paque density gradient medium. Centrifuge at 1700 rpm for 25 minutes (brake off) at room temperature. Collect the peripheral blood mononuclear cell (PBMC) layer from the interface.
- Monocyte Isolation: Isolate monocytes from PBMCs using a hyperosmotic Percoll gradient. Resuspend PBMCs and layer over the gradient. Centrifuge at 2350 rpm for 30 minutes (brake off). Collect monocytes from the interphase, wash, and resuspend in RPMI culture medium.
- Seeding and Confirmation: Seed isolated monocytes in 6-well plates at a density of 2 x 10^6 cells/well in RPMI. Allow cells to adhere for 1 hour at 37°C and confirm attachment via light microscopy.
T3 and LPS Stimulation Protocol
- Treatment Preparation:
- T3 Stock: Prepare a 5 mM stock solution of triiodo-L-thyronine (T3) in a suitable solvent (e.g., weak base) and dilute to 5 µM working concentration in RPMI.
- LPS Stock: Prepare a stock of E. coli O55:B5 Lipopolysaccharide (LPS) and dilute to 10 ng/mL working concentration in RPMI.
- Stimulation Regime:
- Aspirate seeding medium from adherent monocytes.
- Apply the following treatments for 4 or 24 hours at 37°C:
- Control: RPMI medium only.
- T3-only: 5 µM T3 in RPMI.
- LPS-only: 10 ng/mL LPS in RPMI.
- T3 + LPS: Pre-treat monocytes with 5 µM T3 for 1 hour, then add 10 ng/mL LPS (co-stimulation).
- Post-Incubation Collection: Collect cells for downstream analysis.
- RNA Extraction: Use Trizol reagent and RNeasy mini kits. Elute in RNase-free water.
- DNA Extraction: Use ATL buffer and standard silica-column based kits.
Transcriptomic and Methylomic Profiling
- RNA Sequencing:
- Library Prep: Use TruSeq Stranded mRNA kit for library preparation.
- Sequencing: Sequence on an Illumina platform (e.g., NovaSeq 6000) with 100 bp paired-end reads.
- Analysis: Align reads to a reference transcriptome (e.g., GRCh37). Use tools like Bowtie1 for alignment and DESeq2 for differential expression analysis (p-value < 0.05, fold change > 1.5).
- DNA Methylation Analysis:
- Platform: Use Infinium MethylationEPIC BeadChip or equivalent for genome-wide coverage.
- Analysis: Process raw data and normalize. Identify DMPs using a threshold of p-value < 0.05 and Δβ > 0.05.
The workflow for the key experimental protocol is visualized below.
The Scientist's Toolkit: Essential Research Reagents
Successful investigation into T3-induced monocyte remodeling requires a suite of reliable reagents and tools. The following table catalogs essential solutions.
Table 3: Key Research Reagent Solutions for T3 Immunometabolism Studies
| Reagent / Tool Category | Specific Example(s) | Function / Application |
|---|---|---|
| Cell Isolation & Culture | Ficoll-Paque, Percoll, RPMI Medium | Isolation of PBMCs and monocytes; base culture medium for in vitro studies [110]. |
| Key Stimuli & Inhibitors | Triiodo-L-thyronine (T3), E. coli O55:B5 LPS, Etomoxir | T3 is the primary hormone under study. LPS provides inflammatory stimulation. Etomoxir inhibits fatty acid oxidation to probe metabolism-epigenetics links [110] [112]. |
| Nucleic Acid Extraction Kits | RNeasy Mini Kit, Trizol Reagent, DNeasy Blood & Tissue Kit | High-quality RNA/DNA extraction for downstream transcriptomic and methylomic applications [110]. |
| Omics Analysis Kits & Platforms | TruSeq Stranded mRNA Kit, Infinium MethylationEPIC BeadChip | Library prep for RNA-Seq; genome-wide DNA methylation analysis [110]. |
| Antibodies for Validation | Anti-H3K9Ac, Anti-TFAM, Anti-iNOS | Validation of epigenetic changes (H3K9Ac), mitochondrial biogenesis (TFAM), and inflammatory phenotype (iNOS) via Western Blot or IF [112]. |
| Metabolic Assays | Seahorse XFp/XFe96 Analyzer, MitoTracker Deep Red | Real-time analysis of mitochondrial respiration (OCR); assessment of mitochondrial mass/activity via flow cytometry [112]. |
Concluding Remarks and Future Directions
The validation of T3-induced epigenetic and transcriptional remodeling in human monocytes establishes a concrete molecular link between systemic metabolic regulation and innate immune cell programming. The data reveals that T3, even at a relatively high concentration, induces a limited but significant transcriptional response and a more profound, context-dependent alteration of the DNA methylome, particularly under inflammatory conditions [110]. The minimal overlap between differentially expressed genes and differentially methylated positions underscores the complexity of this regulation, suggesting the involvement of other epigenetic layers, such as histone modifications [110] [112], which warrant further investigation.
From a drug development perspective, these findings open avenues for "metabolically based epigenetic modulation" [112]. Targeting the pathways that interface T3 signaling, mitochondrial metabolism, and epigenetic remodeling could lead to novel therapeutic strategies for diseases characterized by dysfunctional immunometabolism, such as atherosclerosis, obesity, and endocrine-related cancers [111] [112] [113]. Future research should focus on delineating the precise cause-effect relationship between metabolic shifts and epigenetic marks, identifying key downstream effector genes, and translating these findings into more physiologically relevant in vivo models. The tools and protocols outlined in this guide provide a robust foundation for these essential next steps.
Thyroid hormones (THs) are crucial regulators of basal metabolic rate (BMR), energy expenditure, and metabolic homeostasis. While levothyroxine (T4) monotherapy remains the standard treatment for hypothyroidism, a significant subset of patients continues to experience persistent symptoms despite normalized thyroid-stimulating hormone (TSH) levels, prompting a re-evaluation of therapeutic strategies. This comprehensive analysis examines the efficacy and safety of established treatments—T4 and liothyronine (T3)—alongside emerging novel thyroid hormone analogues. We synthesize current clinical evidence, detail experimental methodologies for evaluating metabolic outcomes, and explore the mechanistic basis for personalized therapeutic approaches. The integration of genetic profiling and patient-reported outcomes is paving the way for more nuanced treatment paradigms that extend beyond TSH normalization to encompass tissue-level metabolic correction and improved quality of life.
Thyroid hormones are master regulators of mammalian metabolism, with profound effects on basal metabolic rate, thermogenesis, and substrate utilization [20]. The hypothalamic-pituitary-thyroid (HPT) axis maintains tight control over thyroid hormone production through a classic feedback loop: hypothalamic thyrotropin-releasing hormone (TRH) stimulates pituitary thyroid-stimulating hormone (TSH) release, which in turn promotes thyroid synthesis and secretion of thyroxine (T4) and triiodothyronine (T3) [2]. The thyroid gland secretes approximately 80% T4 and 20% T3; however, the majority of biologically active T3 is generated in peripheral tissues via deiodination of T4 by deiodinase enzymes (DIO1 and DIO2) [4] [76].
The critical metabolic effects of thyroid hormones are primarily mediated through genomic actions involving nuclear thyroid hormone receptors (TRs) [76]. TRα and TRβ isoforms exhibit distinct tissue distribution patterns—TRα predominates in heart, skeletal muscle, and brain, while TRβ is abundant in liver, kidney, and pituitary—explaining the tissue-specific effects of thyroid hormone action [76]. Upon binding to T3, these receptors regulate the transcription of genes involved in metabolic processes, including mitochondrial biogenesis, substrate cycling, and catecholamine sensitivity [20] [76]. Even within the reference range, variations in thyroid hormone levels associate with measurable differences in metabolic parameters, highlighting their fundamental role in metabolic regulation [55].
The treatment of hypothyroidism has traditionally focused on T4 replacement monotherapy, based on the premise of peripheral conversion to T3. However, growing recognition of limitations in this approach, including impaired conversion in certain individuals, has stimulated research into alternative strategies including T3 combination therapies and receptor-specific analogues [114]. This review systematically evaluates the evidence for these approaches within the context of optimizing metabolic outcomes.
Physiological Basis and Molecular Mechanisms of Action
Thyroid Hormone Synthesis, Transport, and Metabolism
Thyroid hormone synthesis begins with iodide uptake by the sodium-iodide symporter (NIS) on thyroid follicular cells [2]. Through a series of steps involving oxidation, organification, and coupling reactions catalyzed by thyroid peroxidase (TPO), iodine is incorporated into thyroglobulin to form monoiodotyrosine (MIT) and diiodotyrosine (DIT), which subsequently couple to form T4 (two DIT molecules) and T3 (one MIT and one DIT) [2]. Following secretion into the bloodstream, thyroid hormones circulate bound to carrier proteins—thyroxine-binding globulin (TBG), transthyretin, and albumin—with only a tiny fraction (0.2%) remaining as free hormone, which is biologically active [2] [76].
Cellular uptake of thyroid hormones requires specific membrane transporters, most notably monocarboxylate transporter 8 (MCT8) [76]. Intracellularly, the activation and inactivation of thyroid hormones is precisely regulated by a family of deiodinase enzymes: DIO1 and DIO2 convert T4 to the active T3, while DIO3 inactivates T4 and T3 to reverse T3 (rT3) and 3,3'-diiodothyronine, respectively [20] [76]. This peripheral regulation creates tissue-specific thyroid hormone milieus independent of circulating levels, a crucial consideration for understanding metabolic effects and therapeutic approaches [76].
Genomic and Non-Genomic Signaling Pathways
The canonical genomic pathway involves T3 binding to nuclear TRs, which then heterodimerize with the retinoid X receptor (RXR) and bind to thyroid hormone response elements (TREs) in target gene promoters [20] [76]. Depending on the gene and cellular context, this leads to transcriptional activation or repression. Metabolic genes regulated this way include those involved in lipogenesis, gluconeogenesis, and mitochondrial oxidative phosphorylation [20].
Additionally, thyroid hormones exert rapid non-genomic effects through interactions with plasma membrane receptors such as integrin αvβ3, which activates intracellular signaling cascades including MAPK and PI3K [76]. These non-genomic actions can influence vascular tone, ion channel activity, and cellular metabolism within minutes, complementing the slower genomic effects [76].
The diagram below illustrates the complex intracellular pathways of thyroid hormone signaling:
Figure 1: Intracellular Thyroid Hormone Signaling and Metabolic Regulation. This diagram illustrates the pathways through which T4 enters cells via transporters like MCT8, its conversion to active T3 by deiodinases (DIO2), and subsequent genomic actions through nuclear thyroid hormone receptors (TR/RXR) binding to thyroid response elements (TREs). Non-genomic signaling via integrin receptors is also shown. Both pathways ultimately converge on mitochondrial function to regulate oxidative metabolism and basal metabolic rate. Created using DOT language.
Established Therapies: T4 and T3
Levothyroxine (T4) Monotherapy
Levothyroxine (LT4) represents the standard of care for hypothyroidism treatment worldwide. As a synthetic form of thyroxine, it reliably normalizes serum TSH levels, has a long half-life (approximately 7 days) permitting once-daily dosing, and demonstrates predictable pharmacokinetics [114]. The therapeutic rationale centers on its peripheral conversion to T3 by endogenous deiodinases, theoretically replicating physiological hormone availability [114].
Despite clinical guidelines endorsing LT4 as first-line therapy, persistent symptoms affect approximately 10-15% of patients with normalized TSH levels [114]. Common complaints include fatigue, cognitive dysfunction ("brain fog"), depressed mood, and weight dysregulation, suggesting inadequate tissue-level thyroid signaling despite biochemical normalization [114]. Potential explanations include impaired T4-to-T3 conversion due to deiodinase polymorphisms (e.g., DIO2 Thr92Ala), altered hormone transport, or differences in tissue-specific receptor sensitivity [114] [76].
Liothyronine (T3) and Combination Therapies
Liothyronine (LT3), the synthetic form of triiodothyronine, represents an alternative therapeutic approach. As the biologically active hormone, T3 binds nuclear TRs with approximately 10-15-fold greater affinity than T4, directly influencing gene transcription without requiring activation [114] [76]. T3 has more rapid absorption and a shorter half-life (approximately 24 hours) compared to T4, which can result in fluctuating serum levels and potential pulsatile tissue exposure if not properly dosed [114].
Combination T4/T3 therapy aims to provide both prohormone and active hormone directly, potentially bypassing conversion impairments. Evidence from randomized trials and meta-analyses shows inconsistent benefits, though some patient subgroups—particularly those with specific DIO2 polymorphisms or persistent symptoms despite LT4—may experience improved quality of life and symptom resolution [114]. A 2019 study of 75 patients found desiccated thyroid extract (DTE), which contains both T4 and T3 in an approximate 4:1 ratio, demonstrated comparable effectiveness to LT4, especially in poor responders to monotherapy [115].
Table 1: Pharmacological Profiles of Standard Thyroid Hormone Formulations
| Parameter | Levothyroxine (T4) | Liothyronine (T3) | Desiccated Thyroid Extract (DTE) |
|---|---|---|---|
| Bioactive Form | Prohormone (requires conversion) | Active hormone | Mixed (T4 & T3) |
| Average Half-life | ~7 days | ~24 hours | T4: ~7 days; T3: ~24 hours |
| Time to Peak Concentration | 2-4 hours | 2-3 hours | 2-3 hours (T3 component) |
| Standard Dosing Frequency | Once daily | Once or multiple times daily | Once daily |
| Key Metabolic Effects | Normalizes TSH, restores T4 pool | Direct tissue effects, rapid symptom relief | Combined T4/T3 effects |
| Advantages | Long half-life, stable levels, well-established safety | Bypasses conversion defects, rapid action | Provides both T4 and T3 |
| Disadvantages | Dependent on conversion, persistent symptoms in some patients | Multiple daily dosing often needed, risk of peaks and troughs | Fixed ratio may not match physiological needs |
Novel Thyroid Hormone Analogues and Emerging Therapeutics
TRβ-Selective Agonists
The development of thyroid hormone receptor beta (TRβ)-selective agonists represents a significant advancement in targeting thyroid hormone pathways while minimizing adverse effects. This strategy leverages the tissue distribution of TR isoforms—TRα predominates in heart, bone, and CNS, while TRβ is abundant in liver—to dissociate metabolic benefits from cardiotoxic and osteoporotic side effects [116]. Several compounds have progressed to clinical development:
- Resmetirom (MGL-3196): Demonstrated efficacy in reducing LDL cholesterol and liver fat in nonalcoholic fatty liver disease (NAFLD) and nonalcoholic steatohepatitis (NASH) in clinical trials, with acceptable safety profile [116].
- Eprotirome (KB2115): Effectively lowered LDL cholesterol but development was discontinued due to cartilage abnormalities in animal studies and elevated liver enzymes in human trials [116].
- Sobetirome (GC-1): Shows potent cholesterol-lowering and thermogenic effects in preclinical models, with ongoing research exploring applications in demyelinating disorders [116].
These analogues preferentially activate TRβ-mediated metabolic pathways in the liver, promoting lipid metabolism and reducing serum cholesterol without significant cardiac thyrotoxic effects [116] [76].
Thyroid Hormone Metabolites and Derivatives
Naturally occurring thyroid hormone metabolites and their synthetic derivatives represent another therapeutic avenue:
- 3,5-Diiodothyronine (T2): This endogenous metabolite increases metabolic rate and fatty acid oxidation in animal models without significant cardiac effects, suggesting potential for metabolic disorders [116]. However, clinical trials with synthetic T2 analogues have yielded disappointing results to date [116].
- 3-Iodothyronamine (T1AM): An endogenous metabolite with rapid metabolic effects, currently in preclinical investigation for neurological conditions including Alzheimer's disease and seizure disorders [116].
- Triac (3,5,3'-triiodothyroacetic acid): Used clinically in specific cases of thyroid hormone resistance due to TRβ mutations and in Allan-Herndon-Dudley syndrome (MCT8 deficiency) [116] [76].
Table 2: Novel Thyroid Hormone Analogues in Development
| Compound | Primary Mechanism | Therapeutic Target | Development Status | Key Metabolic Effects |
|---|---|---|---|---|
| Resmetirom (MGL-3196) | TRβ-selective agonist | NASH, NAFLD | Phase 3 | ↓ Liver fat, ↓ LDL cholesterol |
| Eprotirome (KB2115) | TRβ-selective agonist | Dyslipidemia | Discontinued (safety concerns) | ↓ LDL cholesterol |
| Sobetirome (GC-1) | TRβ-selective agonist | Dyslipidemia, demyelination | Preclinical/Phase 1 | ↓ Cholesterol, remyelination |
| 3,5-T2 | TH metabolite analogue | Obesity, metabolic syndrome | Preclinical | ↑ Metabolic rate, ↑ fatty acid oxidation |
| T1AM | TH metabolite analogue | Neurological disorders | Preclinical | Neuroprotection, seizure reduction |
Experimental Methodologies for Evaluating Metabolic Efficacy
Assessment of Basal Metabolic Rate and Body Composition
Rigorous evaluation of thyroid hormone therapies requires precise measurement of their metabolic effects. Recent clinical studies employ sophisticated methodologies to assess basal metabolic rate (BMR) and body composition parameters:
Bioelectrical Impedance Analysis (BIA): This non-invasive technique measures body composition parameters including fat mass, fat-free mass, muscle mass, total body water, and visceral adipose tissue [55]. The Tanita SC 330ST and similar medical-grade devices provide comprehensive body composition profiles essential for evaluating metabolic outcomes of thyroid hormone interventions.
Indirect Calorimetry: The gold standard for BMR measurement, this method calculates energy expenditure by measuring oxygen consumption and carbon dioxide production. It provides direct assessment of thyroid hormone effects on cellular metabolism and energy homeostasis [55] [20].
Anthropometric Measurements: Standardized assessment of body weight, height, body mass index (BMI), and waist circumference provides essential complementary data for evaluating metabolic status [55].
A 2025 study of 117 women of reproductive age demonstrated the utility of these methodologies, revealing significant associations between thyroid hormones within the reference range and body composition parameters: TSH showed positive associations with fat-free mass and BMR, while FT3 inversely correlated with metabolic age and visceral fat [55].
Laboratory Analyses and Molecular Techniques
Comprehensive thyroid status assessment requires multiple laboratory measures:
Thyroid Hormone Profiling: Electrochemiluminescence assays (e.g., Cobas e 411, Mindray BS-480 analyzers) precisely quantify TSH, FT3, and FT4 levels, with strict internal quality controls using Levey-Jennings charts and Westgard rules [55].
Genetic Analysis: Identification of deiodinase polymorphisms (e.g., DIO2 Thr92Ala) through PCR-based techniques helps identify patients with potentially impaired T4-to-T3 conversion who might benefit from alternative therapies [114].
Metabolic Biomarkers: Assessment of lipid profiles (LDL, HDL, triglycerides), glycemic parameters (fasting glucose, insulin, HbA1c), and liver function tests provides comprehensive metabolic characterization of therapeutic interventions [116] [20].
The experimental workflow for evaluating thyroid hormone therapies typically follows a structured approach as illustrated below:
Figure 2: Experimental Workflow for Evaluating Thyroid Hormone Therapies. This diagram outlines the standardized approach for assessing metabolic effects of thyroid hormone interventions, incorporating body composition analysis (BIA), basal metabolic rate measurement (calorimetry), comprehensive blood profiling, and genetic analysis. Data integration enables comprehensive assessment of therapeutic efficacy and safety. Created using DOT language.
The Scientist's Toolkit: Essential Research Reagents and Methodologies
Table 3: Key Research Reagents and Methodologies for Thyroid Hormone Research
| Tool/Reagent | Primary Function | Research Application | Example Methodology |
|---|---|---|---|
| Electrochemiluminescence Immunoassays | Quantification of TSH, FT3, FT4 | Thyroid function assessment | Cobas e 411, Mindray BS-480 analyzers with internal quality controls |
| Bioelectrical Impedance Analysis (BIA) | Body composition measurement | Fat mass, fat-free mass, visceral fat assessment | Tanita SC 330ST with standardized participant preparation |
| Indirect Calorimetry Systems | Basal metabolic rate measurement | Energy expenditure quantification | VO₂/VCO₂ analysis with canopy hood or mask systems |
| TRβ-Selective Agonists | Selective thyroid receptor activation | Metabolic studies without cardiac effects | Resmetirom (MGL-3196) for NAFLD/NASH models |
| Deiodinase Polymorphism Assays | Detection of DIO2 Thr92Ala variant | Identification of conversion impairment | PCR-based genotyping with TaqMan assays |
| Cell Culture Models (MCT8-transfected) | Thyroid hormone transport studies | Cellular uptake mechanism analysis | Radiolabeled T3/T4 uptake assays in transfected cells |
| Animal Models (TRα/TRβ knockouts) | Receptor-specific pathway analysis | Tissue-specific thyroid action studies | Metabolic phenotyping of isoform-specific knockouts |
Comparative Therapeutic Efficacy and Clinical Applications
Metabolic Outcomes Across Therapeutic Classes
The metabolic efficacy of thyroid hormone therapies varies significantly between approaches, with distinct risk-benefit profiles:
T4 Monotherapy: Effectively normalizes TSH and provides substrate for peripheral T3 production, but fails to resolve symptoms in a clinically significant minority of patients, particularly those with conversion impairments [114]. It remains the safest option for most patients, with established long-term safety data.
T4/T3 Combination Therapy: Shows variable results across clinical trials, with some studies demonstrating improved patient-reported outcomes for mood, cognitive function, and quality of life, particularly in specific genetic subgroups [114] [115]. Potential limitations include difficulty maintaining stable T3 levels and cardiac side effects if not carefully monitored and dosed.
TRβ-Selective Agonists: Demonstrate targeted metabolic benefits—particularly reduced hepatic steatosis and improved lipid profiles—without the concerning cardiac effects associated with endogenous thyroid hormone or non-selective therapy [116]. These agents represent a promising approach for specific metabolic disorders beyond conventional hypothyroidism treatment.
Safety Considerations and Adverse Effect Profiles
Safety considerations differ substantially across therapeutic approaches:
- Cardiovascular Effects: Traditional thyroid hormone replacement carries risk of atrial arrhythmias, increased heart rate, and reduced exercise tolerance at supra-physiological doses [2] [4]. TRβ-selective agonists demonstrate significantly reduced cardiac toxicity [116].
- Bone Metabolism: Excessive thyroid hormone stimulation accelerates bone turnover and can reduce bone mineral density, increasing fracture risk, particularly in postmenopausal women [4]. TRβ-selective agonists show preferential bone safety profiles.
- Metabolic Stability: T3-containing regimens can cause metabolic fluctuations, with potential for periodic hypermetabolic symptoms (anxiety, palpitations, insomnia) followed by rebound fatigue during trough periods [114].
Future Directions and Research Implications
The future of thyroid hormone therapeutics lies in personalized approaches that integrate genetic, metabolic, and clinical profiling to match patients with optimal treatment strategies. Key emerging directions include:
Pharmacogenomics: Identification of genetic variants affecting deiodinase function (DIO2 Thr92Ala), thyroid hormone transport (MCT8 polymorphisms), and receptor sensitivity will enable better patient selection for specific therapies [114] [76].
Novel Formulation Strategies: Development of sustained-release T3 preparations could mitigate the peak-trough dynamics that limit current T3-containing regimens, potentially improving tolerability and efficacy [114].
Expanded Indications: TRβ-selective agonists show promise beyond traditional thyroid disease, particularly for NAFLD/NASH, dyslipidemia, and potentially obesity and metabolic syndrome [116] [20].
Combination Approaches: Strategic combinations of TRβ-selective agonists with other metabolic agents may provide synergistic benefits for complex metabolic disorders while minimizing side effects [116].
Artificial intelligence and machine learning approaches are increasingly being applied to drug discovery and development, potentially accelerating the identification and optimization of novel thyroid hormone analogues with improved therapeutic profiles [117].
The therapeutic landscape for thyroid hormone replacement is evolving beyond the traditional T4 monotherapy paradigm toward a more nuanced, personalized approach. While T4 remains the standard first-line treatment for most patients, compelling evidence supports considering T3-containing therapies for specific subpopulations, particularly those with persistent symptoms despite biochemical euthyroidism and those with documented conversion impairments. Novel TRβ-selective analogues represent a promising advancement, offering targeted metabolic benefits while minimizing extrahepatic side effects. Future research should focus on optimizing patient selection criteria, developing improved formulations, and validating long-term outcomes for these emerging therapeutic strategies. The integration of these approaches promises to enhance metabolic outcomes and quality of life for patients with thyroid disorders and potentially for those with related metabolic conditions.
Conclusion
Thyroid hormones T3 and T4 are master regulators of basal metabolic rate, orchestrating a complex network of genomic and non-genomic actions across key metabolic tissues. The fine-tuning of their intracellular availability by deiodinases and transporters adds a critical layer of local control, explaining tissue-specific metabolic phenotypes. Clinical data robustly links even subtle thyroid dysfunction to significant alterations in body weight, lipid metabolism, and glucose homeostasis, underscoring its role in conditions like metabolic syndrome and type 2 diabetes. Future research must focus on translating this mechanistic understanding into safer, more effective therapies. Promising directions include the refinement of TRβ-selective agonists to exploit beneficial metabolic effects while avoiding cardiotoxicity, further investigation of metabolites like 3,5-T2, and a deeper exploration of the epigenetic landscape shaped by thyroid status. For biomedical and clinical research, integrating assessments of local TH metabolism with systemic measures will be paramount for developing personalized therapeutic strategies for metabolic disorders.
References
- 1. Hypothalamic–pituitary–thyroid axis [https://en.wikipedia.org/wiki/Hypothalamic%E2%80%93pituitary%E2%80%93thyroid_axis]
- 2. Physiology, Thyroid Hormone - StatPearls - NCBI Bookshelf [https://www.ncbi.nlm.nih.gov/books/NBK500006/]
- 3. Thyroid hormone signaling in energy homeostasis and energy ... [https://pmc.ncbi.nlm.nih.gov/articles/PMC4451242/]
- 4. Thyroid Hormone: What It Is & Function [https://my.clevelandclinic.org/health/articles/22391-thyroid-hormone]
- 5. The hypothalamus-pituitary-thyroid (HPT)-axis and its role ... [https://pubmed.ncbi.nlm.nih.gov/33549603/]
- 6. Thyroid Hormone Signaling Pathways: Time for a More ... [https://pmc.ncbi.nlm.nih.gov/articles/PMC6283428/]
- 7. Thyroid Hormone Signaling Pathway [https://www.creative-diagnostics.com/thyroid-hormone-signaling-pathway.htm]
- 8. Beyond classic concepts in thyroid homeostasis [https://www.sciencedirect.com/science/article/pii/S0303720721001775]
- 9. Cellular Uptake of Thyroid Hormones - Endotext - NCBI - NIH [https://www.ncbi.nlm.nih.gov/books/NBK285565/]
- 10. Thyroid Hormone Regulation of Metabolism - PMC [https://pmc.ncbi.nlm.nih.gov/articles/PMC4044302/]
- 11. Thyroid Hormones and Metabolism Regulation: Which Role ... [https://pmc.ncbi.nlm.nih.gov/articles/PMC11940499/]
- 12. Deiodinases and their intricate role in thyroid hormone ... [https://www.nature.com/articles/s41574-019-0218-2]
- 13. Thyroid hormone transport by monocarboxylate transporters [https://pubmed.ncbi.nlm.nih.gov/17574005/]
- 14. Structural insights into brain thyroid hormone transport via ... [https://www.sciencedirect.com/science/article/abs/pii/S0092867425007342]
- 15. Molecular mechanism of thyroxine transport by ... [https://www.nature.com/articles/s41467-025-59751-w]
- 16. Deiodinases and the Three Types of Thyroid Hormone ... [https://pmc.ncbi.nlm.nih.gov/articles/PMC8566136/]
- 17. Deiodination - an overview [https://www.sciencedirect.com/topics/medicine-and-dentistry/deiodination]
- 18. Thyroid hormone receptor localization in target tissues - PMC [https://pmc.ncbi.nlm.nih.gov/articles/PMC5843491/]
- 19. Thyroid hormone response element sequence and ... - PubMed [https://pubmed.ncbi.nlm.nih.gov/11084025/]
- 20. Thyroid Hormones and Metabolism Regulation [https://www.mdpi.com/2218-273X/15/3/361]
- 21. Selective Thyroid Hormone Receptor-Beta (TRβ) Agonists [https://www.frontiersin.org/journals/medicine/articles/10.3389/fmed.2020.00331/full]
- 22. Thyroid hormone-regulated chromatin landscape and ... [https://www.nature.com/articles/s42003-023-05546-y]
- 23. Transcriptional activation by the thyroid hormone receptor ... [https://www.nature.com/articles/ncomms8048]
- 24. Thyroid Hormone Response Element Sequence and the ... [https://www.sciencedirect.com/science/article/pii/S0021925818463880]
- 25. Thyroid Hormone Variability and Its Association with ... [https://www.icr-heart.com/article/thyroid-hormone-variability-and-its-association-with-metabolic-rate-alterations-in-euthyroid-individuals-2312/]
- 26. Molecular Basis of Nongenomic Actions of Thyroid Hormone [https://www.sciencedirect.com/science/article/abs/pii/S0083672917300390]
- 27. Role of thyroid hormone-integrin αvβ3-signal and ... [https://pmc.ncbi.nlm.nih.gov/articles/PMC8028191/]
- 28. Regulation of Hormonal | Biology for Majors II Metabolism [https://courses.lumenlearning.com/wm-biology2/chapter/hormonal-regulation-of-metabolism/]
- 29. Non Genomic Actions of Thyroid Hormones in Cancer [https://www.frontiersin.org/journals/endocrinology/articles/10.3389/fendo.2019.00847/full]
- 30. Involvement of integrin αvβ3 in thyroid hormone-induced ... [https://www.frontiersin.org/journals/endocrinology/articles/10.3389/fendo.2022.938596/full]
- 31. Integrin αvβ3 as a Non-Genomic Estrogen Receptor in ... [https://www.mdpi.com/2073-4409/14/22/1832]
- 32. Non-genomic Actions of Thyroid Hormones Regulate the ... [https://pmc.ncbi.nlm.nih.gov/articles/PMC6381017/]
- 33. Regulation of mitochondrial biogenesis - PMC - PubMed Central [https://pmc.ncbi.nlm.nih.gov/articles/PMC3883043/]
- 34. Mitochondrial biogenesis: An update - PMC - PubMed Central [https://pmc.ncbi.nlm.nih.gov/articles/PMC7205802/]
- 35. Regulation of Mitochondrial Biogenesis as a Way for Active ... [https://www.frontiersin.org/journals/genetics/articles/10.3389/fgene.2019.00435/full]
- 36. The Na / K - ATPase α1/Src interaction regulates reserve and... metabolic [https://pmc.ncbi.nlm.nih.gov/articles/PMC8570534/]
- 37. Thyroid hormones correlate with resting metabolic rate, not ... [https://pmc.ncbi.nlm.nih.gov/articles/PMC3683160/]
- 38. Thyroid hormone stimulates Na-K-ATPase activity and its ... [https://pubmed.ncbi.nlm.nih.gov/12740220/]
- 39. Frontiers | “Oxygen Sensing” by Na , K - ATPase : These Miraculous Thiols [https://www.frontiersin.org/journals/physiology/articles/10.3389/fphys.2016.00314/full]
- 40. Marked differences in thyroxine (T4) metabolism following ... [https://www.sciencedirect.com/science/article/pii/S0887233325000104]
- 41. Comparative analysis of thyroid hormone systems in ... [https://www.nature.com/articles/s41598-023-30179-w]
- 42. Advances in in vivo magnetic resonance spectroscopy for ... [https://pmc.ncbi.nlm.nih.gov/articles/PMC12313504/]
- 43. Microbiota dysbiosis impact on the metabolism of T3 and ... [https://www.frontiersin.org/journals/cell-and-developmental-biology/articles/10.3389/fcell.2025.1589726/full]
- 44. Adipose tissues and thyroid hormones [https://www.frontiersin.org/journals/physiology/articles/10.3389/fphys.2014.00479/full]
- 45. Adipose Tissue: Physiology to Metabolic Dysfunction - NCBI [https://www.ncbi.nlm.nih.gov/books/NBK555602/]
- 46. Adipose Tissue Distribution, Inflammation and Its Metabolic ... [https://www.frontiersin.org/journals/cardiovascular-medicine/articles/10.3389/fcvm.2020.00022/full]
- 47. Generation and Characterization of a New Resistance to ... [https://pubmed.ncbi.nlm.nih.gov/32924834/]
- 48. Thyroid hormone resistance and increased metabolic rate ... [https://www.jci.org/articles/view/9422]
- 49. Thyroid Disorders and Their Impact on Metabolic Syndrome ... [https://pmc.ncbi.nlm.nih.gov/articles/PMC12578534/]
- 50. Lifestyle Interventions to Tackle Cardiovascular Risk in ... [https://www.mdpi.com/2072-6643/17/13/2053]
- 51. Treatment Approaches for co-occurring Hypothyroidism ... [https://www.sciencedirect.com/science/article/abs/pii/S2451847625000855]
- 52. Rebound effect of hypothalamic-pituitary thyreotropic activity [https://link.springer.com/article/10.1007/s40618-024-02480-6]
- 53. Does temperature change affect thyroid function? [https://www.thyroid.org/patient-thyroid-information/ct-for-patients/january-2025/vol-18-issue-1-p-5-6/]
- 54. Impaired sensitivity to thyroid hormones is positively ... [https://www.frontiersin.org/journals/endocrinology/articles/10.3389/fendo.2025.1552484/full]
- 55. Association of Thyroid Hormones with Basal Metabolism and ... [https://pmc.ncbi.nlm.nih.gov/articles/PMC12503621/]
- 56. Selective Thyroid Hormone Receptor-Beta (TRβ) Agonists [https://pmc.ncbi.nlm.nih.gov/articles/PMC7363807/]
- 57. Thyroid hormone receptor subtype-β- selective agonists as ... [https://www.ovid.com/journals/fulip/pdf/10.2217/17460875.2.6.641~thyroid-hormone-receptor-subtype--selective-agonists-as]
- 58. Synthesis and preclinical testing of a selective beta- ... [https://www.nature.com/articles/s43856-024-00574-z]
- 59. Efficacy and safety of Resmetirom, a selective thyroid ... [https://www.nature.com/articles/s41598-024-70242-8]
- 60. VK2809 Selective Thyroid Receptor-β Agonist [https://vikingtherapeutics.com/pipeline/metabolic-disease-program/vk2809/]
- 61. Drug discovery targeting thyroid hormone receptor β ... [https://www.sciencedirect.com/science/article/pii/S2211383524003150]
- 62. Focus on 3,5-Diiodothyronine (3,5-T2) in Psammomys obesus ... [https://pmc.ncbi.nlm.nih.gov/articles/PMC9329750/]
- 63. 3,5-T2-an Endogenous Thyroid Hormone Metabolite as ... [https://pmc.ncbi.nlm.nih.gov/articles/PMC9322486/]
- 64. 3,5-T2—A Janus-Faced Thyroid Hormone Metabolite ... [https://www.frontiersin.org/journals/endocrinology/articles/10.3389/fendo.2019.00787/full]
- 65. 3,5-diiodo-l-thyronine, by modulating mitochondrial ... [https://www.sciencedirect.com/science/article/abs/pii/S0168827809002578]
- 66. 3,5 Diiodo-L-Thyronine (T2) Does Not Prevent Hepatic ... [https://journals.plos.org/plosone/article?id=10.1371/journal.pone.0140837]
- 67. 3,5-Diiodo-L-Thyronine (T2) Administration Affects Visceral ... [https://www.frontiersin.org/journals/endocrinology/articles/10.3389/fendo.2021.703170/full]
- 68. Update on dyslipidemia in hypothyroidism: the mechanism of ... [https://pmc.ncbi.nlm.nih.gov/articles/PMC8859969/]
- 69. Hypothyroidism: playing the cardiometabolic risk concerto [https://thyroidresearchjournal.biomedcentral.com/articles/10.1186/s13044-025-00233-y]
- 70. Hypothyroidism-Associated Dyslipidemia: Potential ... [https://pmc.ncbi.nlm.nih.gov/articles/PMC8657790/]
- 71. TSHB mRNA is linked to cholesterol metabolism in adipose ... [https://pmc.ncbi.nlm.nih.gov/articles/PMC5602896/]
- 72. How Does the Thyroid Affect Metabolism? [https://www.dmc.org/healthy-living/corporate-content/how-does-the-thyroid-affect-metabolism]
- 73. Cellular Action of Thyroid Hormone - Endotext - NCBI - NIH [https://www.ncbi.nlm.nih.gov/books/NBK285568/]
- 74. Biochemical and physiological insights into TRH receptor- ... [https://www.frontiersin.org/journals/cell-and-developmental-biology/articles/10.3389/fcell.2022.981452/full]
- 75. Metabolic Effects of the Intracellular Regulation of Thyroid ... [https://www.frontiersin.org/journals/endocrinology/articles/10.3389/fendo.2018.00474/full]
- 76. Mechanisms of thyroid hormone action - PMC - PubMed Central [https://pmc.ncbi.nlm.nih.gov/articles/PMC3433956/]
- 77. Hyperthyroidism: A Review - PMC - PubMed Central [https://pmc.ncbi.nlm.nih.gov/articles/PMC10873132/]
- 78. The management and metabolic characterization [https://www.sciencedirect.com/science/article/abs/pii/S014341792200083X]
- 79. Metabolite Changes during the Transition from ... [https://www.e-enm.org/journal/view.php?doi=10.3803/EnM.2022.1590]
- 80. A Cross-Sectional Study on the Prevalence of Subclinical ... [https://pubmed.ncbi.nlm.nih.gov/39323691/]
- 81. Thyroid Hormones and the Metabolic Syndrome - PMC [https://pmc.ncbi.nlm.nih.gov/articles/PMC3821514/]
- 82. Research status of subclinical hypothyroidism promoting ... [https://www.frontiersin.org/journals/cardiovascular-medicine/articles/10.3389/fcvm.2025.1527271/full]
- 83. Thyroid dysfunction in metabolic syndrome patients and its ... [https://pmc.ncbi.nlm.nih.gov/articles/PMC5471726/]
- 84. The Relationship Between Thyroid Function and Metabolic ... [https://www.frontiersin.org/journals/endocrinology/articles/10.3389/fendo.2021.661160/full]
- 85. Analysis of Subclinical Thyroid Dysfunction and Metabolic ... [https://pmc.ncbi.nlm.nih.gov/articles/PMC10593554/]
- 86. The role of thyroid hormone in metabolism ... - PubMed Central [https://pmc.ncbi.nlm.nih.gov/articles/PMC7238803/]
- 87. Functional Evidence for Retinoid X Receptor (RXR) as a ... [https://pmc.ncbi.nlm.nih.gov/articles/PMC133993/]
- 88. Gene ResultRXRG retinoid X receptor gamma [ (human)] [https://www.ncbi.nlm.nih.gov/gene/6258]
- 89. International Union of Pharmacology. LXIII. Retinoid X ... [https://www.sciencedirect.com/science/article/abs/pii/S0031699724117000]
- 90. Multigenerational thyroid hormone resistance due to THRβ ... [https://pubmed.ncbi.nlm.nih.gov/40761432/]
- 91. Molecular Mechanisms of Thyroid Hormone Signaling in ... [https://pmc.ncbi.nlm.nih.gov/articles/PMC12561264/]
- 92. Thyroid Function Tests [https://www.thyroid.org/thyroid-function-tests/]
- 93. Thyroid function tests [https://www.btf-thyroid.org/thyroid-function-tests]
- 94. How to interpret thyroid function tests - PMC - PubMed Central [https://pmc.ncbi.nlm.nih.gov/articles/PMC5922674/]
- 95. Screening for Thyroid Dysfunction: Recommendation ... [https://www.aafp.org/pubs/afp/issues/2015/0601/od1.html]
- 96. A novel meta learning based stacked approach for ... [https://pmc.ncbi.nlm.nih.gov/articles/PMC11530063/]
- 97. Improved bio-inspired with machine learning computing ... [https://www.nature.com/articles/s41598-025-03299-8]
- 98. A novel hybrid approach for thyroid disease detection [https://www.sciencedirect.com/science/article/pii/S2215016125004029]
- 99. metabolic hormones and its correlation with Thyroid and bmi ... lipid [https://www.slideshare.net/slideshow/thyroid-metabolic-hormones-and-its-correlation-with-bmi-and-lipid-profile-in-healthy-people/25789045]
- 100. Associations between metabolic syndrome, serum thyrotropin, and... [https://pubmed.ncbi.nlm.nih.gov/26457493/]
- 101. (PDF) Relationship between Body , Mass -to-Hip Ratio... Index Waist [https://www.academia.edu/143560561/Relationship_between_Body_Mass_Index_Waist_to_Hip_Ratio_and_Serum_Lipid_Concentrations_and_Thyroid_Stimulating_Hormone_in_the_Euthyroid_Adult_Population]
- 102. A Renewed Focus on the Association Between Thyroid ... [https://www.frontiersin.org/journals/endocrinology/articles/10.3389/fendo.2018.00511/full]
- 103. Effects of Levothyroxine Replacement or Suppressive ... [https://pmc.ncbi.nlm.nih.gov/articles/PMC4790206/]
- 104. Thyroid Hormones and Changes in Body Weight and ... [https://pmc.ncbi.nlm.nih.gov/articles/PMC5461198/]
- 105. Thyroid Hormone Receptor Gene Knockouts [https://www.sciencedirect.com/science/article/abs/pii/S1043276098000265]
- 106. Comparative Phenotyping of Mice Reveals Canonical and ... [https://pubmed.ncbi.nlm.nih.gov/38889231/]
- 107. Thyroid hormone receptor α signaling shapes innate and ... [https://pmc.ncbi.nlm.nih.gov/articles/PMC12599294/]
- 108. Maternal thyroid hormone receptor β activation in mice ... [https://www.nature.com/articles/s41467-023-42425-w]
- 109. Thyroid hormone receptor subtype-specific function in ... [https://pmc.ncbi.nlm.nih.gov/articles/PMC12183033/]
- 110. Triiodothyronine (T3) Induces Limited Transcriptional and ... [https://pmc.ncbi.nlm.nih.gov/articles/PMC8945024/]
- 111. Epigenetic Regulation of Immune Responses in Endocrine ... [https://pmc.ncbi.nlm.nih.gov/articles/PMC12563070/]
- 112. Reprogramming mitochondrial metabolism and ... [https://www.nature.com/articles/s41467-025-64201-8]
- 113. Exploring the Link Between Thyroid Disorders and Obesity [https://www.sciencedirect.com/science/article/abs/pii/S1530891X25000436]
- 114. The Role of Triiodothyronine (T3) in Thyroid Hormone ... [https://pmc.ncbi.nlm.nih.gov/articles/PMC12370163/]
- 115. New Treatments for Hashimoto's Thyroiditis (2025) [https://www.dvcstem.com/post/new-treatments-for-hashimotos-thyroiditis]
- 116. Thyroid Hormone Analogues: An Update [https://pubmed.ncbi.nlm.nih.gov/32098589/]
- 117. The future of pharmaceuticals: Artificial intelligence in drug ... [https://www.sciencedirect.com/science/article/pii/S2095177925000656]