Intestinal Glucose Transport: Unraveling the Critical Roles and Therapeutic Targeting of SGLT1 and GLUT2
This article provides a comprehensive analysis of the sodium-glucose cotransporter SGLT1 and the facilitative glucose transporter GLUT2 in intestinal glucose absorption, a process critical for systemic energy homeostasis.
Intestinal Glucose Transport: Unraveling the Critical Roles and Therapeutic Targeting of SGLT1 and GLUT2
Abstract
This article provides a comprehensive analysis of the sodium-glucose cotransporter SGLT1 and the facilitative glucose transporter GLUT2 in intestinal glucose absorption, a process critical for systemic energy homeostasis. Aimed at researchers, scientists, and drug development professionals, it synthesizes foundational physiology, advanced research methodologies, and contentious mechanistic debates. The scope spans from the established role of SGLT1 in active apical uptake and incretin secretion to the controversial apical recruitment of GLUT2 under high glucose loads. It further explores how these pathways are investigated, modulated by dietary and pharmacological agents, and leveraged in developing therapeutic strategies for diabetes and metabolic disorders. The content integrates recent findings, including the role of paracellular transport and the effects of compounds like dexamethasone and oat β-glucan, to offer a state-of-the-art perspective on the field.
The Core Machinery: Defining SGLT1 and GLUT2 in Intestinal Glucose Physiology
Sodium-glucose cotransporter 1 (SGLT1) serves as the principal apical membrane transporter responsible for active glucose uptake in the intestine. This whitepaper consolidates current understanding of SGLT1's molecular mechanism, regulation, and functional interplay with the basolateral facilitator GLUT2. We present quantitative data on transport kinetics, detailed experimental methodologies for investigating transporter function, and visualization of key pathways. Within the broader framework of intestinal glucose absorption research, this resource provides scientists and drug development professionals with technical insights into the core transporter that enables active transcellular glucose flux, a process fundamental to energy homeostasis and a target for therapeutic intervention.
The absorption of dietary glucose across the intestinal epithelium is a critical process for maintaining systemic energy balance. The prevailing model involves a two-step transcellular pathway: first, active uptake across the apical membrane of enterocytes, and second, facilitated efflux across the basolateral membrane into circulation [1]. SGLT1 (SLC5A1) is unequivocally established as the primary mediator of the initial, rate-limiting apical step [1] [2]. This transporter harnesses the electrochemical sodium gradient maintained by the basolateral Na+/K+ ATPase to drive the uphill transport of glucose and galactose into the cell against their concentration gradients [1] [2].
The functional partnership between SGLT1 and the basolateral transporter GLUT2 (SLC2A2) is essential for complete transcellular absorption [3] [4]. While SGLT1 performs active, concentrative uptake, GLUT2 provides a high-capacity pathway for the facilitated diffusion of glucose out of the enterocyte [4]. However, emerging evidence complicates this classic division of labor, suggesting that GLUT2 can be rapidly recruited to the apical membrane under high luminal glucose loads, contributing to a diffusive absorption component [3]. This whitepaper delves into the specific role of SGLT1 within this dynamic system, detailing its structure, function, and the experimental evidence that defines it as the primary apical workhorse for active glucose uptake.
Molecular Mechanism and Structural Basis of SGLT1
SGLT1 is a high-affinity, low-capacity glucose transporter with a coupling stoichiometry of 2 Na+ ions per 1 glucose molecule [2]. Recent cryo-electron microscopy (cryo-EM) structures have elucidated the atomic-level details of its operation.
Architecture and Transport Cycle
The structure of human SGLT1 reveals a core of 14 transmembrane helices (TM0-TM13) that adopt a leucine transporter (LeuT) fold [2]. A distinctive extracellular domain, or "lid," formed by loops EL3, EL4, and EL6, covers the extracellular surface and is stabilized by multiple disulfide bonds critical for folding and function [2]. The transport cycle involves alternating between outward-open and inward-open conformations. In the outward-open state, the extracellular gate is accessible, allowing Na+ ions to bind first, which induces a conformational change that increases affinity for glucose. Following glucose binding, the protein transitions to an inward-open state, releasing both substrates into the cytoplasm before returning to the outward-open state to begin a new cycle [2].
Inhibitor Binding and Specificity
The structural mechanism of SGLT1 inhibition is exemplified by the inhibitor LX2761, which locks the transporter in an outward-open conformation [5]. The glucose-mimetic ring of LX2761 occupies the sugar-binding site, forming hydrogen bonds with residues Asn78 (TM1), Glu102 (TM2), and Lys321 (TM7). Its aglycon tail extends into the extracellular vestibule, making extensive hydrophobic interactions [5]. This detailed understanding of the inhibitor-binding pocket enables the rational design of selective therapeutic compounds.
The diagram below illustrates the core structure and conformational states of the SGLT1 transporter.
Quantitative Functional Data and Transport Kinetics
Experimental data from vascularly perfused rat intestine models and cell-based assays provide quantitative insights into SGLT1's contribution to total glucose absorption and its kinetic properties.
Table 1: Glucose Absorption in Isolated, Vascularly Perfused Rat Intestine Model [6]
| Luminal Glucose Concentration | Total Glucose Absorption (μmol/15 min) | Effect of SGLT1 Blockade (Phlorizin) |
|---|---|---|
| 1% (55 mmol/L) | 51.6 ± 4.2 | Data not reported for this concentration |
| 5% (278 mmol/L) | 88.3 ± 5.6 | Data not reported for this concentration |
| 10% (550 mmol/L) | 193.1 ± 14.7 | Data not reported for this concentration |
| 20% (1100 mmol/L) | 616.7 ± 78.2 | Data not reported for this concentration |
| 100 mmol/L | ~430 (First stimulation) | Reduced by ~60% (to ~184 μmol/15 min) |
Table 2: Impact of Transporter Blockade on Glucose Absorption [6]
| Experimental Intervention | Target | Glucose Absorption Change | Interpretation |
|---|---|---|---|
| Luminal Phlorizin (at 100 mmol/L glucose) | Apical SGLT1 | ~60% reduction | SGLT1 mediates majority of uptake at this concentration |
| Intra-arterial Phloretin (at 100 mmol/L glucose) | Basolateral GLUT2 | ~70-80% reduction | GLUT2 is critical for basolateral glucose efflux |
| Combined SGLT1 & GLUT2 Blockade | Both pathways | ~30% of absorption remained | Suggests additional pathways (e.g., paracellular) |
The data in Table 1 demonstrates that intestinal glucose absorption is non-saturable under high luminal glucose loads, hinting at the involvement of additional, non-active pathways. The blockade studies in Table 2 quantitatively establish SGLT1's primary role, while also revealing a significant residual absorption component (~30%) that persists even after combined SGLT1/GLUT2 inhibition, suggesting a contribution from passive paracellular transport [6].
Key Experimental Models and Methodologies
Investigating SGLT1 function requires specialized experimental models that preserve the polarity and physiological context of the intestinal epithelium.
The Isolated, Vascularly Perfused Rat Intestine
This ex vivo model maintains intact epithelial polarity, vascular perfusion, and enterocyte viability, allowing for precise experimental control and measurement.
Typical Protocol for Glucose Absorption Studies: [6]
- Isolation and Cannulation: A segment of rat jejunum is surgically isolated, and its vascular bed and lumen are cannulated.
- Perfusion: The vasculature is perfused with an oxygenated, buffered solution (e.g., Krebs-Henseleit buffer) containing a macromolecule like dextran to maintain oncotic pressure. The lumen is perfused with a saline solution.
- Luminal Stimulation: The luminal perfusate is switched to a solution containing D-glucose at varying concentrations (e.g., from 55 mmol/L to 1100 mmol/L). Each concentration is typically maintained for 15-30 minutes to reach a steady-state absorption rate.
- Tracer Use and Quantification: Radioactively labeled 14C-D-glucose is added to the luminal perfusate. The appearance of this tracer in the vascular effluent provides a sensitive and accurate measure of absorbed glucose.
- Pharmacological Blockade: To dissect the contribution of SGLT1, the specific inhibitor phlorizin (e.g., 1 μmol/L) is added to the luminal perfusate during a subsequent glucose stimulation period.
- Data Analysis: Glucose absorption is calculated based on the arteriovenous concentration difference of the radioactive tracer and the flow rate of the vascular perfusate.
Differentiated Caco-2/TC7 Cell Monolayers
The human colon carcinoma-derived Caco-2/TC7 cell line, when cultured on permeable filters, spontaneously differentiates to form a polarized monolayer with an apical brush border, resembling small intestinal enterocytes.
Typical Protocol for Glucose Uptake Assays: [7]
- Cell Culture and Differentiation: Caco-2/TC7 cells are seeded onto transwell filters and cultured for at least 21 days to allow full differentiation. The medium is changed regularly.
- Experimental Treatment: Differentiated monolayers are treated with compounds of interest (e.g., dexamethasone to study SGLT1 upregulation) for a specified duration (e.g., 60 hours).
- Glucose Uptake Measurement: Cells are starved in glucose-free medium for a short period (e.g., 4 hours). The uptake assay is initiated by adding a solution containing a non-metabolizable glucose analog (e.g., 2-deoxy-D-glucose) to the apical compartment.
- Inhibition Studies: The SGLT1-specific component of uptake is defined by its sensitivity to phlorizin added to the apical solution.
- Analysis: Cells are lysed, and the accumulated radiolabeled or fluorescent tracer is quantified. Transporter expression (SGLT1, GLUT2 mRNA/protein) is often analyzed in parallel via qPCR or western blot.
The following diagram outlines the workflow for a key methodology used to study SGLT1 function.
The Scientist's Toolkit: Key Research Reagents
Essential pharmacological and molecular tools for probing SGLT1 function in experimental settings are summarized in the table below.
Table 3: Essential Reagents for SGLT1 Research
| Reagent | Type | Primary Target | Mechanism of Action / Use | Key Application in Research |
|---|---|---|---|---|
| Phlorizin | Inhibitor | SGLT1 | Competitive inhibitor binding to the glucose site on SGLT1 [6] [1] | Defining SGLT1-mediated component of glucose uptake in functional assays [6] |
| LX2761 | Inhibitor | SGLT1/SGLT2 (Dual) | Locks SGLT1 in an outward-open conformation by wedging into substrate-binding site [5] | Used in structural studies (cryo-EM) to elucidate inhibitor binding mechanism [5] |
| Phloretin | Inhibitor | GLUT2 | Blocks facilitated glucose transport via GLUT2 [6] | Dissecting basolateral glucose efflux; used to probe apical GLUT2 recruitment [6] |
| Dexamethasone | Agonist | Glucocorticoid Receptor | Upregulates SGLT1 mRNA and protein expression [7] | Studying transcriptional regulation of SGLT1 and its functional consequences [7] |
| 2-deoxy-D-glucose | Analogue | - | Non-metabolizable glucose tracer [7] | Accurate measurement of glucose uptake without interference from subsequent metabolism [7] |
| 14C-D-glucose | Tracer | - | Radioactive label for glucose [6] | Sensitive and quantitative tracking of glucose absorption in complex models (e.g., perfused intestine) [6] |
Regulatory Context and Pathophysiological Significance
SGLT1's expression and activity are tightly regulated and implicated in several physiological and disease states, making it a molecule of significant clinical interest.
- Regulation by Luminal Content and Hormones: Intestinal SGLT1 expression is modulated by sweet taste receptors and the presence of luminal glucose, enabling a feedback loop for glucose absorption [1]. Hormones such as GLP-2 can also regulate its expression and membrane trafficking [3]. Dexamethasone, a glucocorticoid, has been shown to dose-dependently increase SGLT1 mRNA and enhance glucose absorption, providing a mechanistic link between steroid therapy and hyperglycaemia [7].
- Genetic Evidence from GGM: The most compelling evidence for SGLT1's non-redundant role comes from Glucose-Galactose Malabsorption (GGM), a rare autosomal recessive disorder caused by loss-of-function mutations in the SGLT1 gene (SLC5A1). This condition results in life-threatening osmotic diarrhea upon ingestion of glucose or galactose, unequivocally demonstrating SGLT1's critical role in intestinal di-saccharide absorption [1] [2].
- Upregulation in Metabolic Disease: In contrast to GGM, conditions like obesity and type 2 diabetes are associated with increased SGLT1 expression in the proximal intestine, potentially contributing to accelerated glucose absorption and postprandial hyperglycaemia [1] [8]. This makes SGLT1 a potential therapeutic target for managing postprandial glucose spikes.
SGLT1 stands as the principal and indispensable apical mediator of active glucose uptake in the intestine. Its well-defined active transport mechanism, coupled with growing understanding of its regulation in health and disease, solidifies its central position in the framework of intestinal glucose homeostasis. While its functional partner GLUT2 and other potential pathways contribute to overall absorption, SGLT1 undertakes the critical energy-dependent step. Ongoing research into its structural biology and regulatory networks continues to inform the development of novel therapeutic strategies aimed at modulating intestinal glucose absorption for improved metabolic health.
In the established model of intestinal glucose homeostasis, the coordinated action of apical sodium-glucose cotransporter 1 (SGLT1) and basolateral glucose transporter 2 (GLUT2) facilitates the efficient transfer of dietary glucose into the systemic circulation. While SGLT1 mediates the active uptake of glucose from the intestinal lumen into the enterocyte, GLUT2 serves as the primary conduit for its passive, facilitative diffusion across the basolateral membrane into the blood. This whitepaper delineates the critical role of basolateral GLUT2 in systemic glucose release, synthesizing foundational and contemporary research to present a definitive technical guide for researchers and drug development professionals. The document provides structured quantitative data, experimental protocols for validating GLUT2 function, and visual tools to elucidate these processes, all framed within the ongoing scientific discourse on intestinal glucose handling.
Molecular Mechanisms and Transporter Kinetics
The absorption of dietary glucose is a two-stage process that exemplifies precise epithelial transport coordination. The initial stage involves active transport across the apical (brush-border) membrane of the enterocyte. This is mediated by SGLT1 (SLC5A1), which couples the uphill transport of glucose against its concentration gradient to the downhill movement of sodium ions. The energy for this process is derived from the sodium gradient maintained by the basolateral Na+/K+-ATPase [9] [10].
Once inside the cell, glucose exits across the basolateral membrane into the interstitial fluid and subsequently into the bloodstream via GLUT2 (SLC2A2). This transporter functions as a facilitative uniporter, allowing glucose to move down its concentration gradient from the cell into the blood without energy expenditure [4] [9]. The expression of GLUT2 on the basolateral membrane is constitutive, ensuring a constant pathway for glucose efflux.
The kinetic properties of SGLT1 and GLUT2 are complementary, reflecting their distinct roles. The following table summarizes their key characteristics:
Table 1: Functional Properties of Key Intestinal Glucose Transporters
| Property | SGLT1 (Apical) | GLUT2 (Basolateral) |
|---|---|---|
| Transport Mechanism | Active, secondary transport | Facilitated diffusion |
| Sodium Coupling | 2:1 (Na+:Glucose) [11] | Not sodium-dependent [9] |
| Primary Driving Force | Na+ gradient (maintained by Na+/K+-ATPase) | Glucose concentration gradient |
| Apparent Km for Glucose | ~2-5 mM [11] [9] | ~20-40 mM [4] [9] |
| Substrate Specificity | D-glucose, D-galactose [9] | D-glucose, D-galactose, D-fructose, glucosamine [4] [12] |
| Inhibitors | Phlorizin [13] [9] | Phloretin [9] |
The high affinity (low Km) of SGLT1 is optimized for efficient scavenging of luminal glucose, even at low concentrations. In contrast, the low affinity (high Km) of GLUT2 suits its role as a high-capacity exit pathway, which remains effective even when intracellular glucose concentrations rise postprandially [4]. This kinetic profile prevents the accumulation of glucose to toxic levels within the enterocyte.
Diagram: The Classical Model of Intestinal Glucose Absorption
Key Experimental Evidence and Data
The foundational role of basolateral GLUT2 has been substantiated by genetic, pharmacologic, and tracer studies. Knockout mouse models provide particularly compelling evidence.
- GLUT2-Deficient Mouse Models: Mice with a targeted deletion of the GLUT2 gene (Slc2a2) exhibit impaired glucose tolerance and elevated blood glucose levels following an oral glucose challenge. This is directly attributed to a reduced capacity for glucose efflux from enterocytes into the circulation. Intriguingly, these knockout animals showed higher tracer glucose contents in intestinal tissue after a radiolabeled glucose gavage compared to wild-type controls, indicating a "backing up" of glucose within the enterocytes due to the defective basolateral exit mechanism [13] [14].
- SGLT1 vs. GLUT2 Deletion Phenotypes: The physiological consequences of deleting SGLT1 versus GLUT2 are distinct and highlight their sequential roles. SGLT1 knockout mice show a drastic reduction in intestinal glucose uptake throughout the small intestine and fail to secrete glucose-dependent insulinotropic peptide (GIP) and glucagon-like peptide-1 (GLP-1) in response to glucose [13] [14]. In contrast, GLUT2 knockout mice have impaired glucose-induced insulin secretion but normal incretin secretion, underscoring GLUT2's primary role in systemic glucose dispersal rather than gut sensing [13].
- Renal Corroboration: The physiological principle of GLUT2-mediated basolateral efflux is conserved in the kidney. In the proximal tubule, glucose reabsorbed by apical SGLT1 and SGLT2 exits the cell into the interstitium via basolateral GLUT2. Mutations in GLUT2 are associated with the Fanconi-Bickel syndrome, characterized by renal glucose loss and hepatorenal glycogen accumulation, confirming its non-redundant role in systemic glucose release [11].
Table 2: Phenotypic Comparison of Glucose Transporter Knockout Models
| Experimental Model | Effect on Intestinal Glucose Uptake | Effect on Blood Glucose | Effect on Hormone Secretion |
|---|---|---|---|
| SGLT1 Knockout | Drastically reduced tissue retention of tracer glucose [13] | Reduced postprandial elevation [13] | Abolished GIP and GLP-1 secretion [13] |
| GLUT2 Knockout | Increased tissue retention of tracer glucose [13] | Impaired clearance, hyperglycemia [13] [4] | Impaired glucose-induced insulin secretion; normal incretin secretion [13] |
Debates and Alternative Viewpoints
A significant controversy in the field involves the potential apical recruitment of GLUT2. Some research posits that high luminal glucose concentrations (>30 mM) trigger the rapid translocation of GLUT2 from cytoplasmic vesicles to the apical membrane, where it may contribute to bulk glucose absorption via facilitated diffusion [9] [15].
However, critical studies using rigorous methodology have challenged this hypothesis. A comparative investigation in knockout mice concluded that SGLT1 is unequivocally the prime intestinal glucose transporter, even at high luminal concentrations. This study found that GLUT2 detected in apical membrane fractions primarily resulted from contamination with basolateral membranes and did not change in abundance after a high-glucose bolus [13] [14]. The weight of evidence suggests that while apical GLUT2 recruitment might occur in specific experimental conditions or disease states (e.g., morbid obesity), its contribution to overall glucose absorption in the healthy intestine under normal physiological conditions is likely minimal compared to the essential, constitutive function of basolateral GLUT2.
Detailed Experimental Protocols
For researchers investigating basolateral GLUT2 function, the following protocols provide a methodological foundation.
Using Chamber Assay for Ileal Glucose Transport
This ex vivo technique directly measures electrogenic glucose transport across intact intestinal tissue [10].
Workflow:
- Tissue Preparation: Euthanize the animal and swiftly excise the distal ileum. Flush with ice-cold Ringer's solution to remove luminal content. Open the intestine along the mesenteric border and mount in an Ussing chamber, exposing the mucosal and serosal surfaces to separate bathing reservoirs.
- Solution Composition: Bathe both sides with oxygenated (95% O₂, 5% CO₂) Ringer's solution at 37°C. The standard solution contains (in mM): 119 NaCl, 4.7 KCl, 2.5 CaCl₂, 1.2 MgSO₄, 1.2 KH₂PO₄, 25 NaHCO₃, and 10 glucose (serosal) or mannitol (mucosal) for osmotic balance [10].
- Measurement: After an equilibration period, replace mucosal mannitol with 25 mM D-glucose. The active transport of glucose via SGLT1, coupled with Na+, generates a negative current shift (increase in short-circuit current, Isc) that can be measured. The involvement of GLUT2 can be probed by adding specific inhibitors like phloretin to the serosal side to block basolateral efflux, which will indirectly affect the system.
Oral Gavage of Radiolabeled Glucose with Tissue Analysis
This in vivo approach quantifies glucose uptake and tissue retention [13] [14].
Workflow:
- Animal Preparation: House mice under controlled conditions and fast for 6 hours prior to the experiment to establish a baseline.
- Gavage Solution: Prepare a solution of unlabeled D-glucose (4 g/kg body weight) combined with radiolabeled [¹⁴C(U)]-D-glucose (e.g., 370 Bq/μl). Include a non-absorbable marker like [³H]-Mannitol to correct for adherent extracellular fluid and passive diffusion.
- Administration and Tissue Collection: Administer the solution via feeding tube. After 15 minutes, anesthetize the animal and collect blood from the retro-orbital plexus. Subsequently, euthanize the animal, excise and evert the entire small intestine, and wash thoroughly in ice-cold Krebs buffer.
- Quantification: Divide the small intestine into defined 1-cm segments. Measure the incorporated ¹⁴C radioactivity in each segment and in plasma samples using a liquid scintillation counter. Calculate glucose retention as nmol per cm of tissue. Higher tracer retention in GLUT2-deficient mice compared to wild-types indicates impaired basolateral efflux [13].
Diagram: Experimental Workflow for Radiolabeled Glucose Uptake
The Scientist's Toolkit: Research Reagent Solutions
Table 3: Essential Reagents for Studying GLUT2 Function
| Reagent / Tool | Function/Application | Mechanism of Action |
|---|---|---|
| Phloretin | Inhibitor of facilitative glucose transporters (GLUTs) [9] | Competitively binds to GLUTs, blocking glucose transport. Used to specifically inhibit GLUT2-mediated basolateral efflux. |
| GLUT2 Knockout Mice | In vivo model for studying systemic glucose homeostasis [13] [4] | Genetically engineered deletion of the Slc2a2 gene to study the phenotypic consequences of a total lack of GLUT2. |
| Radiolabeled [¹⁴C]-D-Glucose | Tracer for quantifying glucose uptake and distribution in vivo [13] [14] | Allows precise measurement of glucose movement through tissues and compartments via radioactivity detection. |
| Anti-GLUT2 Antibodies | Immunodetection (Western Blot, Immunohistochemistry) [13] | Specifically binds to GLUT2 protein for quantifying expression levels and determining its subcellular localization (basolateral vs. apical). |
| Caco-2/TC7 Cell Line | Human intestinal epithelial cell model for in vitro studies [7] | Differentiates into enterocyte-like cells, forming polarized monolayers with defined apical and basolateral membranes to study transporter function and regulation. |
Regulatory Context and Drug Development
Understanding the basolateral role of GLUT2 is crucial for interpreting the mechanisms and limitations of SGLT inhibitors. Pharmacologic strategies have focused almost exclusively on inhibiting the apical sodium-glucose cotransporters (SGLT1 and SGLT2). SGLT2 inhibitors (gliflozins) successfully treat type 2 diabetes by blocking renal glucose reabsorption, promoting glycosuria, and reducing plasma glucose levels [11].
Notably, there are no clinically approved drugs that target intestinal GLUT2. Inhibiting basolateral GLUT2 would be countertherapeutic, as it would trap glucose within the enterocyte, potentially disrupting cellular metabolism and failing to lower systemic blood glucose effectively. Computational models suggest that reducing basolateral GLUT2 activity can indeed decrease net transcellular glucose absorption, primarily by limiting efflux capacity [15]. Therefore, the current therapeutic paradigm affirms the critical conduit function of basolateral GLUT2 by strategically targeting the transport steps that precede it.
The absorption of dietary glucose in the small intestine is a critical process for maintaining systemic energy homeostasis. For decades, the classic paradigm described a two-step mechanism where glucose entered the enterocyte through the apical sodium-glucose cotransporter 1 (SGLT1) and exited via the facilitative glucose transporter 2 (GLUT2) located in the basolateral membrane [16] [9]. This model effectively explained glucose absorption at low luminal concentrations (≤ 10 mM) but failed to account for the massive absorption capacity observed at high luminal glucose concentrations (≥ 25 mM) that far exceed SGLT1's transport capacity [16].
To resolve this discrepancy, the Apical GLUT2 Hypothesis was proposed, suggesting that GLUT2 can be rapidly recruited from intracellular vesicles to the apical membrane in response to high luminal glucose, providing a high-capacity pathway for glucose uptake via facilitated diffusion [16] [9]. This hypothesis has generated significant debate within the scientific community, with supporting and challenging evidence shaping our current understanding of intestinal glucose handling. This whitepaper examines the mechanistic basis, experimental evidence, and ongoing controversies surrounding this hypothesis within the broader context of SGLT1 and GLUT2 function in intestinal glucose absorption research.
Competing Theories of High-Capacity Glucose Absorption
Several theories have emerged to explain the phenomenon of high-capacity glucose absorption that cannot be accounted for by SGLT1 alone.
The Paracellular "Solvent Drag" Theory
Proposed by Pappenheimer, this theory suggests that high luminal glucose concentrations trigger contraction of the peri-junctional actinomyosin ring, dilating intercellular tight junctions and allowing glucose to enter the paracellular space via solvent drag [16] [9].
The Apical GLUT2 Translocation Theory
This theory posits that high luminal glucose activates protein kinase C βII (PKCβII), triggering rapid translocation of pre-formed cytoplasmic GLUT2 vesicles to the apical membrane, creating a high-capacity, facilitative diffusion pathway for glucose entry [16].
Table 1: Comparison of Proposed Mechanisms for High-Capacity Glucose Absorption
| Mechanism | Key Mediators | Glucose Concentration | Kinetic Properties | Proposed Location |
|---|---|---|---|---|
| SGLT1 (Classic) | SGLT1, Na+/K+ ATPase | Low (≤10 mM) | High-affinity, low-capacity, active transport | Apical membrane |
| Basolateral GLUT2 | GLUT2 | All concentrations | Low-affinity, high-capacity, facilitated diffusion | Basolateral membrane |
| Paracellular Transport | Tight junctions | High (≥30 mM) | Non-saturable, passive | Paracellular space |
| Apical GLUT2 (Hypothesis) | GLUT2, PKCβII, cytoskeleton | High (≥30 mM) | Low-affinity, very high-capacity, facilitated diffusion | Apical membrane (inducible) |
Molecular Mechanisms of Proposed GLUT2 Translocation
The apical GLUT2 hypothesis involves a coordinated signaling and trafficking mechanism that responds to high luminal glucose concentrations.
Initiation and Signaling Cascade
The process begins when SGLT1-mediated glucose transport reaches saturation, typically at luminal concentrations exceeding 20-30 mM. Intracellular glucose accumulation or sensing mechanisms subsequently activate protein kinase C βII (PKCβII) [16]. Experimental evidence shows that PKC inhibitors like calphostin C and chelerythrine block the enhanced glucose uptake at high concentrations, while PKC activators like phorbol 12-myristate 13-acetate (PMA) enhance glucose uptake by approximately 20% [16].
Cytoskeletal Involvement and Vesicle Trafficking
The translocation of GLUT2-containing cytoplasmic vesicles to the apical membrane requires an intact cytoskeleton. Studies demonstrate that microtubule disruption with nocodazole and actin filament disruption with cytochalasin B effectively inhibit the increased glucose uptake observed at high glucose concentrations, indicating that both microtubule and actin networks facilitate GLUT2 trafficking to the apical membrane [16].
Diagram 1: Proposed GLUT2 translocation signaling pathway. The mechanism initiates with SGLT1 saturation and progresses through PKC activation and cytoskeletal rearrangement to ultimately insert GLUT2 into the apical membrane.
Critical Experimental Evidence and Methodologies
Supporting Evidence from Cell Line Studies
Research using intestinal cell lines has provided compelling evidence for the apical GLUT2 hypothesis. A comprehensive study utilizing Caco-2, RIE-1, and IEC-6 cell lines demonstrated that glucose uptake saturated at ≥10 mM glucose with brief exposure (≤1 minute), but after ≥5 minutes exposure in Caco-2 and RIE-1 cells, glucose uptake no longer saturated and both Km and Vmax increased significantly [16]. This enhanced uptake was inhibited by phloretin (GLUT2 inhibitor) but not phlorizin (SGLT1 inhibitor), suggesting the involvement of a facilitative glucose transporter distinct from SGLT1 [16].
Table 2: Quantitative Effects of Inhibitors on Glucose Uptake in Intestinal Cell Lines
| Treatment | Target | Effect on Glucose Uptake | Cell Lines Affected | Proposed Mechanism |
|---|---|---|---|---|
| Phlorizin | SGLT1 | Inhibition at all glucose concentrations | Caco-2, RIE-1, IEC-6 | Blocks active glucose transport |
| Phloretin | GLUT2 | Inhibition specifically at high glucose (≥20 mM) | Caco-2, RIE-1 | Blocks facilitative glucose transport |
| Nocodazole | Microtubules | Inhibits enhanced uptake at high glucose | Caco-2, RIE-1 | Disrupts vesicular trafficking |
| Cytochalasin B | Actin filaments | Inhibits enhanced uptake at high glucose | Caco-2, RIE-1 | Disrupts cytoskeletal support |
| Calphostin C | PKC | Inhibits enhanced uptake at high glucose | Caco-2, RIE-1 | Blocks PKC signaling pathway |
| Chelerythrine | PKC | Inhibits enhanced uptake at high glucose | Caco-2, RIE-1 | Blocks PKC signaling pathway |
Experimental Protocols for Studying GLUT2 Translocation
Glucose Uptake Assay in Polarized Cell Monolayers
Purpose: To measure time-dependent and concentration-dependent glucose uptake and distinguish between SGLT1 and GLUT2-mediated components [16].
Methodology:
- Culture Caco-2 cells on 24-well plates until fully differentiated and polarized (15 days post-confluence)
- Incubate cell monolayers in 200 μL Krebs buffer with varying glucose concentrations (0.5-50 mM)
- Include 0.5-1 μCi/mL of 14C-D-glucose and 3H-L-glucose simultaneously to measure total and passive uptake, respectively
- Stop uptake by washing twice with ice-cold PBS
- Solubilize cells with 0.1N NaOH at 37°C for 30 minutes
- Measure radioactivity and protein content for normalization
Key Parameters:
- Carrier-mediated (stereospecific) uptake = Total uptake (14C-D-glucose) - Passive uptake (3H-L-glucose)
- Short exposures (≤1 minute) measure constitutive transport
- Extended exposures (≥5 minutes) measure inducible transport components
Inhibitor Studies to Distinguish Transport Mechanisms
Purpose: To pharmacologically dissect the contributions of different transport systems to total glucose uptake [16].
Methodology:
- Pre-treat polarized cell monolayers with specific inhibitors for 15-30 minutes:
- Phlorizin (100-500 μM) to inhibit SGLT1
- Phloretin (100-500 μM) to inhibit GLUT2
- Cytoskeletal disruptors: Nocodazole (10-50 μM) or Cytochalasin B (10-50 μM)
- PKC inhibitors: Calphostin C (1-5 μM) or Chelerythrine (1-5 μM)
- Perform glucose uptake assays as described above
- Compare uptake in presence vs. absence of inhibitors
Diagram 2: Experimental workflow for inhibitor studies. This approach allows pharmacological dissection of transport mechanisms by targeting specific components.
Contradictory Evidence from Genetic Models
Despite supportive evidence from cell lines, studies in genetically modified mice have challenged the physiological relevance of apical GLUT2 translocation. Research comparing SGLT1-knockout and GLUT2-knockout mice demonstrated that deletion of SGLT1 drastically reduced glucose retention throughout the entire small intestine, even at high glucose loads (40% glucose solution, 4 g/kg body weight) [17] [14]. Conversely, GLUT2-deficient animals exhibited higher tracer glucose contents in intestinal tissues than wild-type animals [14]. Furthermore, Western blot analysis of apical membrane fractions showed that GLUT2 detection primarily resulted from contamination with basolateral membranes and did not change in density after glucose administration [14]. These findings suggest that SGLT1 remains the primary intestinal glucose transporter even at high luminal concentrations, with GLUT2 playing a basolateral role.
Research Reagent Solutions for Intestinal Glucose Transport Studies
Table 3: Essential Research Reagents for Studying Intestinal Glucose Transport Mechanisms
| Reagent | Molecular Target | Application/Function | Key Experimental Uses |
|---|---|---|---|
| Phlorizin | SGLT1 (competitive inhibitor) | Discriminates SGLT1-mediated transport | Inhibits active glucose transport; used to isolate facilitative component |
| Phloretin | GLUT2 (inhibitor) | Discriminates GLUT2-mediated transport | Blocks facilitative diffusion; confirms GLUT2 involvement |
| Nocodazole | Microtubules | Disrupts vesicular trafficking | Tests GLUT2 translocation dependence on microtubules |
| Cytochalasin B | Actin filaments | Disrupts cytoskeletal organization | Tests GLUT2 translocation dependence on actin cytoskeleton |
| Calphostin C | PKC (inhibitor) | Blocks protein kinase C signaling | Tests PKC involvement in GLUT2 translocation signaling |
| Chelerythrine | PKC (inhibitor) | Blocks protein kinase C signaling | Confirms PKC role in translocation cascade |
| Phorbol 12-myristate 13-acetate (PMA) | PKC (activator) | Activates protein kinase C | Tests if PKC activation mimics high-glucose effects |
| 14C-D-glucose | N/A (tracer) | Measures total glucose uptake | Quantifies carrier-mediated + passive glucose uptake |
| 3H-L-glucose | N/A (tracer) | Measures passive diffusion | Controls for paracellular/passive glucose uptake |
Implications for Drug Development and Therapeutic Applications
The debate surrounding the apical GLUT2 hypothesis has significant implications for pharmaceutical research, particularly in developing treatments for metabolic disorders. While SGLT2 inhibitors have emerged as successful therapies for type 2 diabetes by promoting renal glucose excretion [18] [19], targeting intestinal glucose absorption represents an alternative approach for managing hyperglycemia. If apical GLUT2 significantly contributes to glucose absorption, especially at high carbohydrate loads, it could represent a valuable target for reducing postprandial hyperglycemia. However, the conflicting evidence regarding its physiological relevance has led to prioritization of SGLT1 inhibition for intestinal targeting [9] [18].
Recent research indicates that SGLT1 accounts for the majority of dietary glucose uptake in the intestine, with dual SGLT1/2 inhibitors and specific SGLT1 inhibitors showing promise for diabetes treatment by reducing intestinal glucose absorption while minimizing gastrointestinal side effects [18]. The recognition that SGLT1 mediates glucose-induced incretin secretion [17] [14] further complicates the therapeutic landscape, as inhibiting this transporter may affect multiple aspects of glucose homeostasis.
The Apical GLUT2 Hypothesis represents a compelling mechanism for explaining high-capacity intestinal glucose absorption, supported by substantial in vitro evidence demonstrating GLUT2 translocation to the apical membrane in response to high glucose concentrations. The proposed mechanism involving PKC activation and cytoskeletal rearrangement provides a molecular framework for this phenomenon. However, contradictory evidence from genetic mouse models questions the physiological significance of this pathway in vivo, suggesting SGLT1 remains the dominant transporter even at high luminal glucose concentrations.
Future research should focus on resolving these discrepancies through improved experimental models that better preserve in vivo physiology, development of more specific GLUT2 inhibitors and detection methods, and human studies examining transporter localization under physiological and pathological conditions. Understanding the potential role of apical GLUT2 in disease states, such as diabetes and obesity, where glucose absorption may be altered, remains particularly important. Regardless of the outcome, research stimulated by this hypothesis has significantly advanced our understanding of intestinal glucose handling and continues to inform therapeutic development for metabolic diseases.
The absorption of dietary glucose from the intestinal lumen into the systemic circulation is a fundamental physiological process critical for energy homeostasis. This transcellular journey involves precisely coordinated transport across multiple cellular membranes, primarily mediated by two specialized transporter proteins: sodium-dependent glucose cotransporter 1 (SGLT1) and facilitative glucose transporter 2 (GLUT2). SGLT1, located in the apical membrane of enterocytes, mediates the active uptake of glucose against its concentration gradient, while GLUT2, predominantly found in the basolateral membrane, facilitates the passive efflux of glucose into the blood circulation [20] [21]. Understanding the mechanistic details of this coordinated transport system is essential for research into metabolic diseases and the development of novel therapeutic strategies aimed at modulating glucose absorption.
The significance of these transporters is highlighted by genetic evidence. Humans with mutations in the SGLT1 gene exhibit glucose-galactose malabsorption, a potentially fatal condition if these sugars are not removed from the diet, unequivocally demonstrating SGLT1's indispensable role in apical glucose uptake [20] [21]. Similarly, studies in knockout mouse models have shown that while the absence of SGLT1 drastically reduces intestinal glucose absorption, the deletion of GLUT2 does not completely abolish this process, suggesting a more complex or compensatory role for basolateral efflux [14]. This review synthesizes current research on the coordinated functions of SGLT1 and GLUT2, providing a technical guide for researchers and drug development professionals working in this field.
Molecular Mechanisms of Coordinated Transcellular Transport
Apical Entry via SGLT1
SGLT1 (SLC5A1) is a member of the sodium-glucose cotransporter family and is abundantly expressed in the brush border membrane of enterocytes, particularly in the jejunum and ileum [20] [21]. Its transport mechanism is secondary active, coupling the uphill transport of glucose to the downhill transport of sodium ions. Specifically, SGLT1 transports one glucose molecule together with two sodium ions into the cell, utilizing the electrochemical sodium gradient established and maintained by the Na+/K+-ATPase pump located in the basolateral membrane [20] [21]. This stoichiometry (2 Na+:1 glucose) makes the transport process electrogenic and highly efficient.
The kinetic properties of SGLT1 are characterized by a high affinity for its substrates but a relatively low capacity. It has a Michaelis constant (Kt) for D-glucose in the range of 1-7 mM, making it particularly effective at absorbing glucose from low luminal concentrations [20] [21]. SGLT1 exhibits distinct substrate specificity, with a preference for D-glucose > D-galactose > D-methylglucoside > D-3-O-methylglucose, while it does not transport L-glucose or fructose [20]. The transporter can be competitively and potently inhibited by phlorizin, a natural product originally isolated from apple tree bark, which has become an essential pharmacological tool for studying SGLT1 function [6] [22].
Basolateral Exit via GLUT2
Following its entry into the enterocyte, glucose exits across the basolateral membrane into the blood circulation primarily via GLUT2 (SLC2A2), a facilitative diffusion transporter [20] [21]. In contrast to SGLT1, GLUT2 operates without direct energy input, allowing glucose to move down its concentration gradient from the intracellular environment to the serosal side. GLUT2 is a high-capacity, low-affinity transporter with a Km for glucose of approximately 17-40 mM, making it well-suited to handle the high intracellular glucose concentrations that can occur after a meal [20] [21].
GLUT2 has a broader substrate specificity than SGLT1, transporting D-glucose, D-galactose, and D-fructose [21]. Its transport activity is inhibited by phloretin (the aglycone of phlorizin) and cytochalasin B, but not by phlorizin itself, providing a pharmacological profile distinct from SGLT1 [21]. Under normal physiological conditions with low luminal glucose, GLUT2 is predominantly localized to the basolateral membrane of enterocytes. However, evidence suggests that at high luminal glucose concentrations, GLUT2 may be rapidly recruited to the apical membrane, potentially providing an additional high-capacity uptake pathway, though this mechanism remains a subject of ongoing investigation and debate [14] [21].
Table 1: Key Characteristics of Intestinal Glucose Transporters
| Characteristic | SGLT1 | GLUT2 |
|---|---|---|
| Gene Family | SLC5A | SLC2A |
| Transport Mechanism | Secondary active (Na+-coupled) | Facilitated diffusion |
| Membrane Localization | Apical (Brush Border) | Primarily Basolateral (can be apical at high glucose) |
| Stoichiometry | 2 Na+ : 1 Glucose | Not applicable |
| Glucose Affinity (Km) | 1-7 mM (High affinity) | 17-40 mM (Low affinity) |
| Driving Force | Na+ electrochemical gradient | Concentration gradient |
| Specific Inhibitors | Phlorizin | Phloretin, Cytochalasin B |
| Substrate Specificity | D-glucose, D-galactose | D-glucose, D-galactose, D-fructose |
Visualization of the Coordinated Transport Pathway
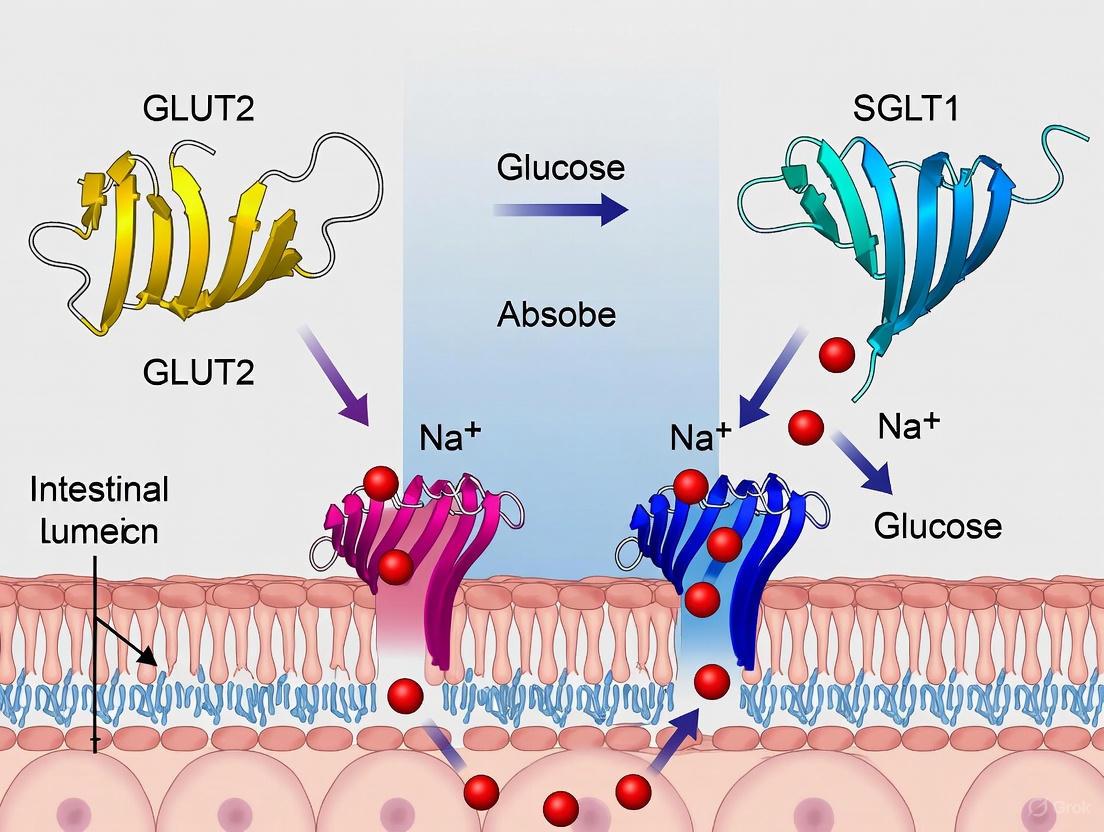
The following diagram illustrates the coordinated transcellular transport of glucose from the intestinal lumen to the blood circulation, highlighting the sequential roles of SGLT1 and GLUT2 and their regulation.
Diagram 1: Coordinated transcellular glucose transport in enterocytes. SGLT1 mediates active apical glucose uptake, while GLUT2 facilitates basolateral efflux. Dotted elements represent potential GLUT2 apical recruitment at high luminal glucose concentrations. The Na+/K+ ATPase maintains the sodium gradient driving SGLT1 activity.
Regulatory Mechanisms of Glucose Transport
Dietary and Nutritional Regulation
The expression and activity of intestinal glucose transporters are dynamically regulated by nutritional status. Fasting and feeding cycles significantly impact glucose absorption capacity. Research using Ussing chamber techniques has demonstrated that glucose-induced currents (indicative of SGLT1 activity) are robustly increased in the jejunum of mice fasted for 24-48 hours compared to ad libitum-fed mice [23]. This suggests an adaptive upregulation of glucose absorptive capacity during fasting, potentially to maximize absorption when nutrients become available. Western blot analyses confirmed that the expression of SGLT1 in brush border membranes was significantly decreased in the jejunum under fed conditions compared to 48-hour fasting [23].
Dietary carbohydrate content also plays a crucial regulatory role. When mice were fed a 60% high glucose diet for three days, the increase in glucose-induced current was observed only in the ileum and was completely suppressed in the jejunum, indicating segment-specific adaptive responses to dietary glucose loads [23]. Furthermore, luminal glucose concentration directly influences transporter activity and localization. At low luminal glucose concentrations (<30 mM), transcellular glucose absorption occurs primarily via SGLT1 in the apical membrane and GLUT2 in the basolateral membrane [20]. At high luminal glucose concentrations (>30 mM), additional mechanisms may be recruited, including the potential insertion of GLUT2 into the apical membrane and increased paracellular permeability, providing a high-capacity absorption pathway [6] [20] [21].
Hormonal and Pharmacological Modulation
Hormonal factors significantly influence the expression and function of intestinal glucose transporters. Dexamethasone, a corticosteroid, has been shown to dose-dependently increase glucose transport in differentiated human Caco-2/TC7 intestinal cell monolayers by upregulating SGLT1 mRNA expression [24]. This effect may contribute to the hyperglycemia associated with long-term corticosteroid use. In animal studies, dexamethasone similarly elevated SGLT1 expression in ileal enterocytes, supporting its role in enhancing intestinal glucose uptake [24].
Incretin hormones are also intimately connected to glucose transporter function. SGLT1 appears to play a crucial role in glucose-sensing mechanisms that trigger the secretion of glucagon-like peptide-1 (GLP-1) and glucose-dependent insulinotropic polypeptide (GIP) from enteroendocrine cells [14] [21]. Studies in SGLT1-deficient mice have shown abolished GIP and GLP-1 secretion in response to glucose, highlighting the transporter's role beyond nutrient absorption [14].
Table 2: Quantitative Effects of Experimental Interventions on Glucose Absorption
| Experimental Intervention | Model System | Effect on Glucose Absorption | Molecular Target/Mechanism |
|---|---|---|---|
| Phlorizin (Luminal) | Isolated perfused rat intestine [6] | ~60% reduction at 100 mM luminal glucose | SGLT1 inhibition |
| Phloretin (Vascular) | Isolated perfused rat intestine [6] | ~70-80% reduction at 100 mM luminal glucose | GLUT2 inhibition |
| Combined SGLT1/GLUT2 Blockade | Isolated perfused rat intestine [6] | ~30% absorption remains | Reveals paracellular component |
| Dexamethasone Treatment | Human Caco-2/TC7 cells [24] | Increased glucose transport | SGLT1 mRNA upregulation |
| 24-48 Hour Fasting | Mouse small intestine [23] | Increased glucose-induced current in jejunum | SGLT1 upregulation in BBM |
Experimental Approaches and Methodologies
Isolated Vascularly Perfused Intestine Model
The isolated vascularly perfused rat intestine preparation represents a sophisticated experimental model that preserves the polarity of epithelial cells, the entire transport pathway, and ensures adequate vascular perfusion of the mucosa [6]. This model has proven particularly valuable for studying the relationship between glucose absorption and endocrine secretion.
A typical experimental protocol involves cannulating the superior mesenteric artery and portal vein to establish a closed vascular perfusion system, while the intestinal lumen is separately perfused with test solutions [6]. Glucose absorption is quantified by adding radioactive tracers such as 14C-D-glucose to the luminal perfusate and measuring their appearance in the vascular effluent, allowing for sensitive and accurate quantification. To differentiate between transcellular and paracellular absorption pathways, 14C-D-mannitol is often used as a non-absorbable paracellular marker [6].
Specific transporter activities can be dissected using pharmacological inhibitors: SGLT1 is blocked by luminal administration of phlorizin (typically at 1 μM, which is approximately 250-fold higher than its IC50), while GLUT2 is inhibited by vascular administration of phloretin (typically 1 mM) [6]. This approach has demonstrated that after combined luminal SGLT1 and GLUT2 blockade, approximately 30% of glucose absorption remains, suggesting a significant paracellular transport component, particularly in the proximal small intestine [6].
Ussing Chamber Technique for Electrophysiological Measurements
The Ussing chamber technique provides a powerful method for measuring electrogenic ion and nutrient transport across isolated intestinal epithelia under short-circuit conditions [23]. The preparation involves excising segments of the small intestine, stripping away the muscle layers, and mounting the mucosa-submucosa preparation between two halves of the chamber, effectively separating the mucosal (luminal) and serosal (blood) sides.
The system measures the short-circuit current (Isc), which represents the net active ion transport across the epithelium. The addition of glucose to the mucosal side induces an increase in Isc, reflecting SGLT1-mediated electrogenic Na+-glucose cotransport [23]. This glucose-induced Isc serves as a quantitative measure of SGLT1 activity. Additionally, transepithelial conductance (Gt) can be determined by applying voltage pulses and measuring resulting current changes according to Ohm's law, providing information about epithelial tight junction permeability [23].
This technique has revealed important segmental differences in glucose transport regulation. For instance, in ad libitum-fed mice, glucose-induced Isc is observed in the ileum but is minimal in the jejunum, whereas after 24-48 hours of fasting, robust glucose-induced Isc becomes apparent in both segments [23]. Furthermore, the Ussing chamber allows for the measurement of dilution potentials to assess cation selectivity and paracellular permeability, which has been shown to increase in the jejunum of fasted mice [23].
In Vivo Tracer Studies and Genetically Modified Models
In vivo approaches provide complementary insights into glucose absorption under physiologically relevant conditions. A common method involves oral gavage of radiolabeled glucose (e.g., 14C-D-glucose) to conscious mice, followed by measurement of tracer appearance in blood and retention in intestinal tissues at specific time points [14]. This technique allows for the assessment of the overall efficiency of glucose absorption and its distribution along the intestinal tract.
The use of genetically modified mouse models has been instrumental in defining the specific roles of individual transporters. Studies in SGLT1 knockout mice have demonstrated drastically reduced intestinal glucose retention and abolished incretin secretion following an oral glucose load, unequivocally establishing SGLT1 as the primary intestinal glucose transporter [14]. Interestingly, GLUT2-deficient mice exhibit higher glucose tracer contents in intestinal tissues than wild-type animals, suggesting compensatory mechanisms or altered glucose metabolism [14].
To control for extracellular fluid contamination, non-absorbable markers such as 3H-mannitol are often co-administered with the radioactive glucose tracer [14]. This approach allows researchers to differentiate between truly absorbed glucose and that which merely remains in the intestinal lumen or adherent mucosal fluid.
Diagram 2: Experimental workflow for studying intestinal glucose transport. The flowchart outlines primary model systems and key measurements for investigating coordinated glucose absorption, from experimental selection to data interpretation.
The Scientist's Toolkit: Essential Research Reagents and Materials
Table 3: Key Research Reagents for Studying Intestinal Glucose Transport
| Reagent/Material | Specific Example | Function/Application | Key Experimental Use |
|---|---|---|---|
| SGLT1 Inhibitor | Phlorizin | Competitive SGLT1 blocker; natural product from apple tree bark | Dissecting SGLT1 contribution to apical uptake (typically 1 μM luminal) [6] [22] |
| GLUT2 Inhibitor | Phloretin | GLUT2 blocker; phlorizin aglycone | Assessing GLUT2 role in basolateral efflux (typically 1 mM vascular) [6] [21] |
| Radioactive Tracers | 14C-D-glucose, 3H-mannitol | Labeled glucose analog and non-absorbable marker | Quantifying glucose absorption and paracellular flux [6] [14] |
| Non-metabolizable Glucose Analogs | α-Methyl-D-glucopyranoside (AMG), 2-Deoxy-D-glucose | Transported but not metabolized | Isolating transport from metabolic effects [23] |
| Differentiated Cell Models | Caco-2/TC7 human intestinal cells | Polarized monolayer with enterocyte-like phenotype | In vitro transport studies, regulation experiments [24] |
| Genetically Modified Mice | SGLT1 knockout, GLUT2 knockout | Lack specific glucose transporters | Defining essential transporter functions in vivo [14] |
| Hormone Assays | GLP-1 ELISA, GIP ELISA | Quantify incretin hormone secretion | Assessing enterendocrine function linked to transport [14] |
Research Implications and Future Directions
The coordinated transcellular transport of glucose via SGLT1 and GLUT2 represents a sophisticated biological system that has important implications for metabolic disease management. The evidence clearly establishes SGLT1 as the primary apical glucose transporter essential for glucose absorption and incretin secretion, while GLUT2 serves as the principal basolateral efflux pathway [14] [21]. However, important questions remain regarding the regulation of GLUT2 membrane trafficking and its potential apical recruitment under high glucose conditions.
Pharmacological inhibition of SGLT1 has emerged as a promising therapeutic strategy for managing hyperglycemia in metabolic diseases. Recent developments in SGLT1 inhibitors have shown potential for reducing postprandial blood glucose levels without serious gastrointestinal side effects [20]. The finding that approximately 30% of glucose absorption persists after combined SGLT1 and GLUT2 blockade suggests a significant paracellular component, particularly in the proximal intestine, which may represent an additional regulatory point [6].
Future research directions should focus on elucidating the precise molecular signals that regulate the membrane trafficking of glucose transporters in response to dietary status, the potential crosstalk between transcellular and paracellular absorption pathways, and the development of more specific transporter inhibitors with optimal therapeutic profiles. A comprehensive understanding of these coordinated transport mechanisms will continue to inform the development of novel interventions for diabetes, obesity, and related metabolic disorders.
Expression Patterns and Localization Along the Intestinal Tract
The absorption of dietary glucose is a critical process for maintaining systemic energy homeostasis, and it is primarily mediated by two key transporter proteins: the sodium-dependent glucose cotransporter 1 (SGLT1, SLC5A1) and the facilitative glucose transporter 2 (GLUT2, SLC2A2) [25] [1]. Within the context of intestinal glucose absorption research, understanding the precise expression patterns and localization of these transporters along the intestinal tract is fundamental. Their distribution is not uniform and is subject to complex regulatory mechanisms that respond to dietary composition, luminal glucose concentrations, and metabolic demands [25] [21]. This in-depth technical guide synthesizes current research to provide researchers, scientists, and drug development professionals with a detailed overview of the expression topography, quantitative data, and experimental methodologies essential for investigating SGLT1 and GLUT2 in the intestine.
Transporter Physiology and Core Functions
SGLT1 (SLC5A1)
SGLT1 is a high-affinity, low-capacity secondary active transporter. It couples the transport of one glucose (or galactose) molecule with two sodium ions, utilizing the inwardly directed sodium gradient generated by the Na+/K+-ATPase as its driving force [25] [1]. Its high affinity for glucose is evidenced by an apparent Km value of 0.5 mM [25] [26]. SGLT1-mediated uptake is specifically inhibited by phlorizin [25].
GLUT2 (SLC2A2)
GLUT2 is a low-affinity, high-capacity facilitative diffusion system that allows glucose to move down its concentration gradient [4] [25]. It transports D-glucose, D-galactose, and fructose with apparent Km values of approximately 17 mM, 92 mM, and 76 mM, respectively [25]. GLUT2-mediated transport is inhibited by phloretin and cytochalasin B, but not by phlorizin [25].
Table 1: Fundamental Characteristics of SGLT1 and GLUT2
| Feature | SGLT1 | GLUT2 |
|---|---|---|
| Gene | SLC5A1 | SLC2A2 |
| Transport Mechanism | Secondary active (Na+-coupled) | Facilitated diffusion |
| Stoichiometry | 2 Na+ : 1 Glucose | N/A |
| Primary Kinetics (Km Glucose) | High-affinity (0.5 mM) | Low-affinity (~17 mM) |
| Inhibitors | Phlorizin | Phloretin, Cytochalasin B |
| Sugar Specificity | D-glucose, D-galactose | D-glucose, D-galactose, Fructose |
Expression Patterns and Regional Localization
The expression of SGLT1 and GLUT2 varies significantly along the length of the gastrointestinal tract, reflecting specialized functional roles in different regions.
SGLT1 Expression Topography
SGLT1 is predominantly expressed in the small intestine. Proteomic analyses have identified it as one of the most abundantly expressed plasma membrane proteins in the mouse small intestine [25]. Its expression is highest in the duodenum and jejunum and decreases toward the ileum [25] [1]. Only minor mRNA expression is detected in the colon [25]. At the cellular level, SGLT1 protein is primarily localized to the brush border membrane (BBM) of mature enterocytes lining the villi, with weak or no staining detected in the crypt cells [25] [21]. SGLT1 is also present in enteroendocrine cells, specifically K-cells that secrete glucose-dependent insulinotropic polypeptide (GIP) and L-cells that secrete glucagon-like peptide-1 (GLP-1) [25] [26].
GLUT2 Expression Topography
GLUT2 is also highly expressed throughout the small intestine [25]. In mice, similar abundances of Glut2 mRNA are observed in the jejunum, ileum, and colon [25]. Its membrane localization is dynamic and dependent on luminal glucose concentrations. Under fasting or low luminal glucose conditions, GLUT2 is predominantly located in the basolateral membrane (BLM) of enterocytes [25] [21]. However, the presence of high luminal glucose can trigger the rapid recruitment of GLUT2 to the brush border membrane [25] [21]. This dual localization model is a key concept in understanding high-capacity glucose absorption.
Table 2: Localization of SGLT1 and GLUT2 in the Intestinal Tract
| Intestinal Segment | SGLT1 Expression & Localization | GLUT2 Expression & Localization |
|---|---|---|
| Duodenum | High expression in BBM [25] [1] | High mRNA in rat > mouse >> human; dynamic BBM/BLM localization [25] |
| Jejunum | High expression and transport capacity in BBM [25] | High expression; dynamic BBM/BLM localization [25] |
| Ileum | Lower expression compared to proximal intestine [25] | High expression in mice; dynamic BBM/BLM localization [25] |
| Colon | Minor mRNA expression [25] | mRNA expression detected in mice [25] |
| Enteroendocrine Cells | Present in K- and L-cells [25] | Information not specified in search results |
Experimental Protocols for Localization and Functional Analysis
Protocol 1: Assessing Transporter Abundance via Brush Border Membrane (BBM) Isolation and Western Blotting
This protocol is used to isolate the BBM fraction and quantify transporter protein levels, often in response to dietary or experimental challenges [13] [14].
- Tissue Harvesting: Sacrifice animals and rapidly dissect the desired intestinal segments.
- Mucosa Scraping: Open the intestine longitudinally, rinse with ice-cold buffer (e.g., Krebs buffer), and scrape off the mucosal layer.
- Homogenization: Homogenize the scraped mucosa in an ice-cold hypotonic buffer (e.g., 100 mM mannitol, 2 mM HEPES/Tris, pH 7.4) containing protease inhibitors and PMSF.
- MgCl2 Precipitation: Add MgCl2 to the homogenate to a final concentration of 20 mM to precipitate non-brush border membranes. Incubate on ice for 15 minutes.
- Differential Centrifugation:
- Centrifuge at low speed (3,000×g for 15 minutes) to pellet the precipitated material.
- Collect the supernatant, which is enriched in BBM vesicles, and centrifuge at a high speed (e.g., 30,000×g for 30 minutes) to pellet the BBM.
- Protein Quantification and Western Blotting: Resuspend the final BBM pellet. Determine protein concentration. Perform SDS-PAGE and Western blotting using validated antibodies against SGLT1 and GLUT2. A critical step is to probe for a basolateral marker protein (e.g., Na+/K+-ATPase) to assess and control for cross-contamination of the BBM fraction [13].
Protocol 2: In Vivo Functional Uptake Assay Using Radiolabeled Glucose
This protocol measures the functional absorption and tissue retention of glucose in different intestinal segments [13] [14].
- Animal Preparation: Fast animals for a standardized period (e.g., 6 hours) to establish a baseline.
- Glucose Gavage: Administer a defined glucose bolus (e.g., 4 g/kg body weight) via oral gavage. The solution should contain a radiolabeled glucose tracer (e.g., [14C(U)]-D-glucose). To correct for adherent luminal fluid, a non-absorbable marker like [3H]-D-mannitol can be included.
- Tissue Collection: After a set period (e.g., 15 minutes), sacrifice the animals. Quickly remove the entire small intestine and evert it. Wash thoroughly with ice-cold buffer to remove luminal contents.
- Segmenting and Processing: Divide the intestine into defined segments (e.g., 1 cm pieces) and digest the tissues or extract the radiolabel.
- Quantification: Measure the retained radioactivity in each tissue segment and in plasma samples using a liquid scintillation counter. Calculate the glucose retention per unit length of intestine (e.g., nmol/cm/15 min).
Visualization of Glucose Absorption and Regulatory Pathways
Intestinal Glucose Absorption and Sensing Pathway
This diagram illustrates the coordinated roles of SGLT1 and GLUT2 in enterocytes for glucose absorption and in enteroendocrine cells for incretin secretion.
Experimental Workflow for Transporter Localization Study
This diagram outlines a standard experimental workflow for investigating transporter localization and function, integrating the protocols described above.
The Scientist's Toolkit: Key Research Reagents
Table 3: Essential Reagents and Models for Investigating Intestinal Glucose Transporters
| Reagent / Model | Function / Application | Key Examples & Notes |
|---|---|---|
| Chemical Inhibitors | Pharmacological blockade to assess transporter-specific function. | Phlorizin: Potent, selective SGLT1 inhibitor [13] [1].Phloretin: Inhibits GLUT2-mediated transport [25]. |
| Antibodies | Detection and localization of transporters via Western Blot (WB) and Immunohistochemistry (IHC). | Validate specificity for target transporter (SGLT1/GLUT2). Critical for confirming purity of BBM fractions using basolateral markers (e.g., Na+/K+-ATPase) [13]. |
| Genetically Modified Mouse Models | Study the non-redundant, essential role of each transporter in vivo. | SGLT1 KO: Requires glucose/galactose-free diet to survive; used to study glucose absorption and incretin secretion [13] [14].GLUT2 KO: Used to study systemic glucose homeostasis; requires GLUT1 re-expression in pancreatic β-cells to survive [13] [14]. |
| Radiolabeled Tracers | Quantitative measurement of functional glucose uptake and absorption. | [14C]-D-Glucose: Tracks glucose disposition [13] [14].[3H]-D-Mannitol: Non-absorbable volume marker for correction [13] [14]. |
| Cell Lines | In vitro model for studying transporter regulation and function. | Differentiated Caco-2 cells: A model for human enterocytes, expressing SGLT1 and GLUT2 [25]. |
The expression and dynamic localization of SGLT1 and GLUT2 along the intestinal tract are precisely regulated to ensure efficient glucose absorption. SGLT1 serves as the primary, high-affinity apical entry point, particularly in the duodenum and jejunum, and is indispensable for glucose sensing in enteroendocrine cells. GLUT2, with its high capacity and dual localization in the BBM and BLM, provides a adaptable pathway for glucose efflux and bulk absorption. The experimental methodologies and reagents detailed in this guide provide a foundation for ongoing research aimed at understanding these processes in health and disease. Targeting the regulatory pathways of these transporters continues to hold significant promise for therapeutic interventions in metabolic disorders such as diabetes and obesity.
Research Tools and Therapeutic Translation: From Knockout Models to Drug Discovery
The utilization of genetically modified mouse models has been instrumental in elucidating the distinct and complementary roles of the sodium-glucose cotransporter SGLT1 and the facilitative glucose transporter GLUT2 in intestinal glucose absorption. Studies employing SGLT1 knockout (Sglt1⁻/⁻) and intestinal epithelial cell-specific GLUT2 knockout (GLUT2ΔIEC) mice have demonstrated that SGLT1 is the primary mediator of apical glucose uptake under both low and high luminal glucose concentrations, and is essential for glucose-induced incretin secretion. In contrast, GLUT2 appears dispensable for apical glucose influx but significantly influences basolateral glucose exit and whole-body glucose homeostasis. This whitepaper synthesizes key phenotypic findings from these genetic models, provides detailed methodological protocols for critical experiments, and discusses the implications for drug development targeting intestinal glucose handling in metabolic diseases.
Intestinal glucose absorption is a critical process for maintaining systemic energy balance, with dysregulation contributing to metabolic disorders like type 2 diabetes and obesity. For decades, the absorption mechanism was conceptualized through a two-transporter system: SGLT1 mediating active, sodium-coupled glucose uptake across the apical brush-border membrane, and GLUT2 facilitating passive glucose efflux across the basolateral membrane into the circulation [17] [13]. However, this model was challenged by hypotheses suggesting GLUT2 could be recruited to the apical membrane during high carbohydrate loads to contribute to bulk absorption via facilitated diffusion.
The generation and characterization of SGLT1 and GLUT2 knockout mice have provided definitive insights to resolve these controversies. This whitepaper consolidates findings from these genetic models, framing them within the broader context of intestinal glucose transporter research. It aims to serve as a technical resource for researchers and drug development professionals by summarizing quantitative phenotypic data, detailing essential experimental protocols, and visualizing core concepts and workflows.
Phenotypic Characterization of Knockout Models
The physiological roles of SGLT1 and GLUT2 have been clarified through the comparative study of respective knockout mouse models, which reveal distinct and critical functions for each transporter.
SGLT1 Knockout (Sglt1⁻/⁻) Mice
- Viability and Diet Dependency: Sglt1⁻/⁻ mice develop a lethal glucose-galactose malabsorption (GGM) syndrome when fed a standard diet but thrive and are healthy when maintained on a glucose- and galactose-free diet [27]. This underscores the non-redundant, essential role of SGLT1 for absorbing dietary glucose and galactose.
- Intestinal Glucose Absorption: Sglt1⁻/⁻ mice exhibit a drastically reduced intestinal absorption of radiolabeled glucose following an oral gavage, with tracer retention decreased throughout the entire small intestine compared to wild-type mice [17] [13]. This establishes SGLT1 as the primary pathway for glucose transport across the brush-border membrane, independent of the glucose load.
- Incretin Secretion: Glucose-triggered secretion of the incretin hormones GIP and GLP-1 is abolished in Sglt1⁻/⁻ mice [27] [17] [13]. Immunohistochemistry confirms SGLT1 localization in GIP- and GLP-1-positive cells, identifying it as a key intestinal glucose sensor.
- Renal Glucose Handling: Micropuncture studies indicate SGLT1 reabsorbs approximately 3% of filtered glucose under normoglycemic conditions, defining its minor but significant contribution to renal glucose reabsorption [27].
GLUT2 Knockout (GLUT2ΔIEC) Mice
- Intestinal Glucose Absorption: Unlike SGLT1 deletion, intestinal-specific inactivation of GLUT2 results in moderate glucose malabsorption and a delayed distribution of oral sugar to peripheral tissues [28]. GLUT2-deficient animals can even exhibit higher intestinal tracer glucose contents than wild-types, potentially due to impaired basolateral exit and subsequent intracellular accumulation [17] [13].
- Metabolic Phenotype: GLUT2ΔIEC mice display limited weight gain despite normal food intake, improved glucose tolerance, and increased ketone body production, mimicking a state of calorie restriction [28].
- Incretin Secretion: GLUT2 deletion does not impair glucose-induced GIP or GLP-1 secretion [17] [13], but it does modulate L-cell function, reducing GLP-1 positive cell density while increasing GLP-1 content per cell [28].
- Systemic Adaptations: These mice show secondary adaptations including reduced microvillus length, altered gut microbiota composition, and improved systemic inflammatory status [28].
Table 1: Quantitative Physiological Data from SGLT1 and GLUT2 Knockout Mouse Models
| Phenotypic Parameter | SGLT1 Knockout (Sglt1⁻/⁻) | GLUT2 Knockout (GLUT2ΔIEC) | Experimental Details |
|---|---|---|---|
| Post-Gavage Plasma Glucose | Severely reduced elevation [17] [13] | Delayed tissue distribution [28] | Oral gavage of 4 g/kg D-glucose |
| Intestinal Glucose Uptake | Drastically reduced (~5-10% of WT) [17] [13] | Unchanged or increased [17] [13] | ¹⁴C-D-glucose tracer, 15 min post-gavage |
| GIP Secretion | Abolished [27] [17] [13] | Unimpaired [17] [13] | Measured 15 min post-glucose gavage |
| GLP-1 Secretion | Abolished [27] [17] [13] | Unimpaired [17] [13] | Measured 15 min post-glucose gavage |
| Renal Glucose Reabsorption | ~3% of filtered load [27] | Not specifically reported | Micropuncture in normoglycemia |
| Body Weight & Metabolism | Normal on special diet [27] | Limited weight gain, improved glucose tolerance [28] | Long-term observation on standard chow |
Table 2: Summary of Knockout Model Conclusions
| Aspect | SGLT1 Conclusion | GLUT2 Conclusion |
|---|---|---|
| Primary Transport Role | Pivotal for apical uptake at all concentrations [27] [17] [13] | Critical for basolateral exit; minimal apical role [17] [13] |
| Role in Incretin Secretion | Essential glucose sensor for GIP and GLP-1 secretion [27] [17] [13] | Not required for glucose-induced secretion [17] [13] |
| Therapeutic Implication | High-potential target for slowing glucose absorption [27] | Target for inducing mild malabsorption/metabolic improvement [28] |
Detailed Experimental Protocols
To ensure reproducibility and provide a technical toolkit, this section outlines key methodologies used to characterize the knockout models.
Oral Glucose Gavage and Tracer Uptake
This protocol is fundamental for assessing in vivo intestinal glucose absorption capacity [17] [13] [14].
- Animal Preparation: Mice are fasted for 6 hours (or overnight, 16-18 hours) with free access to water. Sglt1⁻/⁻ mice must be pre-fed a glucose-galactose-free diet for at least one week prior.
- Gavage Solution: A 40% (w/v) D-glucose solution is prepared in PBS. For tracer studies, the solution is supplemented with 370 Bq/µL of [¹⁴C(U)]-D-glucose and 370 Bq/µL of [¹³H(N)]-D-Mannitol (to correct for adherent fluid). A standard bolus is 4 g glucose per kg body weight.
- Procedure: The solution is administered via a feeding tube. After 15 minutes, blood is collected from the retro-orbital plexus or tail vein under anesthesia for plasma glucose, hormone, and tracer analysis. Mice are then euthanized by cervical dislocation.
- Tissue Processing: The entire small intestine is quickly removed, everted, and thoroughly washed in ice-cold Krebs buffer. It is divided into sequential 1-cm segments. The radioactivity in each segment is measured using a liquid scintillation counter. Glucose retention is calculated as nmol of glucose per cm of intestine over 15 minutes.
Brush Border Membrane Vesicle (BBMV) Preparation and Uptake
This ex vivo method isolates the apical membrane to study transporter function and density directly [27] [13].
- BBMV Isolation: Mice are euthanized, and the small intestinal mucosa is scraped off and homogenized in a mannitol-HEPES buffer (e.g., 100 mM mannitol, 2 mM HEPES/Tris, pH 7.1). MgCl₂ is added to a final concentration of 10-20 mM to precipitate non-apical membranes. The homogenate is kept on ice for 15-20 min and then centrifuged at low speed (3,000 × g, 15 min). The supernatant is centrifuged at high speed (27,000 × g, 30 min). The resulting pellet, enriched in BBMVs, is resuspended in a vesicle buffer and snap-frozen.
- Uptake Assay: Thawed BBMVs are incubated at 22°C with a buffer containing 100 mM NaSCN or KSCN and 0.1 mM [¹⁴C]AMG (a non-metabolizable SGLT1 substrate). Uptake is measured with and without 0.2 mM phlorizin (an SGLT1 inhibitor). The reaction is stopped with ice-cold stop solution containing phlorizin. Vesicles are collected on nitrocellulose filters via rapid filtration and washed, and retained radioactivity is quantified.
Hormone and Metabolite Analysis
- Blood Collection for Hormones: Blood is collected into EDTA-coated tubes containing a dipeptidyl peptidase IV (DPP-IV) inhibitor to prevent incretin degradation [27] [17]. Plasma is separated by centrifugation.
- ELISA Measurements: Plasma concentrations of active GLP-1, total GIP, and insulin are determined using commercial ultra-sensitive ELISA kits (e.g., from Millipore Corporation and ALPCO Diagnostics) according to manufacturer protocols [27] [28] [17].
Diagram 1: Experimental workflow for characterizing glucose absorption and incretin secretion in knockout mouse models, showing divergent phenotypic outcomes.
The Scientist's Toolkit: Essential Research Reagents
Table 3: Key Reagents for Investigating Intestinal Glucose Transport
| Reagent / Resource | Function / Application | Specific Examples / Notes |
|---|---|---|
| SGLT1 Knockout Mice | Model for SGLT1 deficiency; requires glucose-free diet [27] | Sglt1⁻/⁻ on 129/OLA/C57BL/6 background |
| GLUT2 Knockout Mice | Model for global GLUT2 deficiency [17] | Lethal; requires β-cell rescue (RIPGLUT1) |
| Inducible GLUT2ΔIEC Mice | Model for intestinal-specific GLUT2 deletion [28] | Slc2a2FLOX/FLOX × Villin-CreERT2; tamoxifen-induced |
| Phlorizin | Potent, specific SGLT1 inhibitor [17] [13] | Used in BBMV uptake assays (0.2 mM) |
| Phloretin | GLUT2 inhibitor [29] | Used to probe GLUT2 function |
| ³H-/¹⁴C-labeled D-Glucose | Tracer for in vivo/in vitro glucose flux studies [17] [13] | Corrected for fluid phase with ³H-mannitol |
| ¹⁴C-α-Methyl-D-Glucoside (AMG) | Non-metabolizable SGLT1 substrate [27] | Ideal for BBMV uptake assays |
| Anti-SGLT1 Antibody | Immunodetection and localization of SGLT1 [27] | Custom or commercial (e.g., Chemicon) |
| Anti-GLUT2 Antibody | Immunodetection and localization of GLUT2 [28] | Custom or commercial |
| GLP-1 & GIP ELISA Kits | Quantification of plasma incretin levels [27] [28] [17] | Kits from Millipore, MesoScale Discovery |
| DPP-IV Inhibitor | Stabilizes active incretin hormones in blood samples [27] [17] | Added immediately to blood collection tubes |
Signaling, Transport Pathways, and Regulatory Mechanisms
The data from knockout models support a refined model of intestinal glucose handling. SGLT1 is unequivocally the primary and indispensable apical glucose transporter. Its function is not merely to absorb low concentrations of glucose but is also pivotal for mass absorption at high luminal loads [27] [17] [13]. Furthermore, SGLT1 is located in enteroendocrine cells and is essential for triggering glucose-induced secretion of GIP and GLP-1, acting as a key glucose sensor [27] [17].
The role of GLUT2 is primarily at the basolateral membrane for glucose exit from the enterocyte into the circulation. The hypothesis of significant apical recruitment under high glucose loads in mice is not supported by knockout studies, which show no role for GLUT2 in apical influx or incretin secretion [17] [13]. However, GLUT2 is critical for overall glucose homeostasis, as its deletion leads to malabsorption and metabolic adaptations resembling calorie restriction [28].
Recent research also highlights that glucose absorption is a regulated process. Fasting upregulates SGLT1 activity and expression in the jejunum, while feeding a high-glucose diet suppresses it, suggesting segment-dependent autoregulatory mechanisms to prevent hyperglycemia [23].
Diagram 2: Mechanism of intestinal glucose absorption and sensing, based on knockout model insights. SGLT1 mediates apical uptake and triggers incretin secretion, while GLUT2 facilitates basolateral exit.
Implications for Drug Development
The insights from genetic models have direct translational relevance for treating metabolic diseases.
- SGLT1 as a Therapeutic Target: The critical role of SGLT1 in intestinal glucose absorption and its necessity for incretin secretion make it a high-value target. Inhibition of SGLT1 could mimic the phenotype of Sglt1⁻/⁻ mice, slowing glucose absorption and modulating endocrine signaling to improve postprandial glycemia [27]. This approach is complementary to renal SGLT2 inhibition.
- GLUT2 and Metabolic Adaptation: The GLUT2ΔIEC model demonstrates that partial inhibition of intestinal GLUT2 can induce beneficial metabolic effects, including weight control and improved glucose tolerance, through a mechanism akin to calorie restriction [28]. This validates GLUT2 as a potential target for managing obesity and type 2 diabetes.
- Beyond Absorption: Intestinal Glucose Excretion: Recent human studies with PET-MRI reveal that metformin stimulates the excretion of glucose from the circulation into the intestinal lumen, a process enhanced in metformin-treated individuals [30] [31]. This newly quantified flux suggests a potential novel mechanism for glycemic control, possibly involving the gut microbiota's metabolism of excreted glucose into SCFAs [30]. This pathway represents a new frontier for therapeutic intervention.
Genetic mouse models have been indispensable for deconvoluting the complex roles of SGLT1 and GLUT2 in intestinal glucose transport. The evidence conclusively positions SGLT1 as the primary and non-redundant apical transporter and the key mediator of glucose-induced incretin secretion, while GLUT2's principal role is in basolateral efflux. The phenotypic data from these knockouts, detailed in this whitepaper, provide a robust physiological foundation for ongoing drug discovery efforts. Future research, building on these models, will continue to explore the regulation of these transporters and novel mechanisms like intestinal glucose excretion, offering promising new avenues for managing diabetes and related metabolic disorders.
The study of intestinal glucose absorption is crucial for understanding whole-body glucose homeostasis and developing treatments for metabolic disorders. This process is primarily mediated by the coordinated action of the sodium-glucose cotransporter 1 (SGLT1) at the apical membrane of enterocytes and the facilitative glucose transporter 2 (GLUT2) at the basolateral membrane. The natural plant glycoside, phlorizin, and its aglycone metabolite, phloretin, have emerged as indispensable pharmacological tools for dissecting the distinct roles of these transporters. Phlorizin acts as a high-affinity, competitive inhibitor of SGLT1, while phloretin primarily blocks facilitative glucose transporters like GLUT2. This whitepaper provides an in-depth technical guide on the application of these probes, detailing their mechanisms, experimental protocols, and quantitative data, framed within the context of intestinal glucose absorption research for a scientific audience.
Intestinal glucose absorption is a critical process that ensures the efficient uptake of dietary carbohydrates. The prevailing model involves a two-step transcellular transport mechanism [11] [17]:
- Apical Influx (SGLT1-mediated): Glucose entry from the intestinal lumen into the enterocyte is driven by a sodium gradient, accomplished by SGLT1. This is a secondary active transport process.
- Basolateral Efflux (GLUT2-mediated): Glucose exit from the enterocyte into the bloodstream occurs via facilitated diffusion through GLUT2.
While SGLT1 and GLUT2 are the principal players, research suggests the potential involvement of additional pathways, including paracellular diffusion, particularly at high luminal glucose concentrations [6]. The precise contribution of each pathway and the regulation of these transporters remain active areas of investigation. It is within this complex physiological context that selective pharmacological inhibitors like phlorizin and phloretin become essential for elucidating specific transporter functions.
Molecular Mechanisms of Action
Phlorizin and phloretin, despite their structural similarity, have distinct molecular targets and mechanisms, enabling the functional dissection of the glucose absorption machinery.
Phlorizin: The Classic SGLT Inhibitor
Phlorizin is a natural dihydrochalcone glucoside that serves as a potent, competitive inhibitor of sodium-glucose cotransporters [11] [32].
- Target Specificity: It is a dual inhibitor of SGLT1 and SGLT2, with its effect on SGLT1 being particularly critical in the intestinal context [33] [17].
- Mechanism: It binds to the extracellular side of SGLT1, competing with glucose for the substrate-binding site. This binding is characterized by biphasic kinetics, where the inhibitor alternately associates with the extracellular and intracellular sides of the transporter during its conformational cycle [34].
- Binding Domain: Interaction with SGLT1 involves key residues in the extracellular loop 13, which acts as a major binding pocket. Hydrogen bonding occurs via hydroxyl groups of the phlorizin glucose moiety, while hydrophobic interactions involve its aromatic rings [32].
- Functional Outcome: By blocking SGLT1, phlorizin abolishes the active, sodium-coupled uptake of glucose from the intestinal lumen, which in turn also abolishes glucose-dependent incretin secretion, such as GLP-1 and GIP release [17].
Phloretin: The Broad-Spectrum GLUT Inhibitor
Phloretin is the aglucone metabolite of phlorizin and has a different primary target [33] [6].
- Target Specificity: It is a non-selective inhibitor of facilitative glucose transporters (GLUTs), with potent activity against GLUT2 [33] [6].
- Mechanism: It acts as a competitive inhibitor of glucose transport, blocking the facilitated diffusion of glucose across cell membranes [35].
- Functional Outcome: In the intestine, application of phloretin to the basolateral side impairs the exit of glucose from the enterocyte into the circulation. This leads to intracellular glucose accumulation and a significant reduction in net transcellular glucose absorption [6]. It has also been shown to reduce glucose absorption and improve ultrafiltration in peritoneal dialysis models by blocking peritoneal GLUTs [33].
Table 1: Key Characteristics of Phlorizin and Phloretin
| Characteristic | Phlorizin | Phloretin |
|---|---|---|
| Chemical Nature | Dihydrochalcone glucoside | Dihydrochalcone aglycone |
| Primary Target | SGLT1 (and SGLT2) | GLUT2 (and other GLUTs) |
| Mechanism | Competitive inhibitor of sodium-glucose cotransport | Competitive inhibitor of facilitative glucose diffusion |
| Inhibition Site | Apical membrane of enterocytes | Basolateral membrane of enterocytes |
| Effect on Intestinal Glucose Absorption | Blocks apical influx | Blocks basolateral efflux |
Experimental Applications and Protocols
The following section outlines established methodologies for employing these probes in experimental models to dissect transporter function.
Isolated Vascularly Perfused Rat Intestine Model
This model preserves the polarity of epithelial cells and the intact transport pathway, making it ideal for studying absorption kinetics [6].
Protocol: Assessing Contribution of SGLT1 and GLUT2 to Glucose Absorption
- Preparation: Isolate the rat small intestine and maintain it in a vascularly perfused setup. Use a radioisotope tracer like
14C-D-glucosefor sensitive quantification of absorbed glucose. - Baseline Measurement: Perform an initial luminal stimulation with a defined glucose concentration (e.g., 100 mmol/L) and measure total glucose absorption over 15 minutes.
- SGLT1 Blockade: Administer phlorizin (1 μmol/L) into the intestinal lumen. This concentration is approximately 250-fold higher than the IC50 for SGLT1, ensuring complete blockade.
- GLUT2 Blockade: Administer phloretin (1 mmol/L) into the arterial (vascular) perfusion line to target the basolateral membrane.
- Combined Blockade: Perform a experiment with both luminal phlorizin and arterial phloretin.
- Data Analysis: Compare the total glucose absorption during the inhibitor treatment periods to the baseline period. Typical results show:
Cell Monolayer Transport Assay (Caco-2/TC7 Model)
Differentiated Caco-2/TC7 cell monolayers are a standard in vitro model for human intestinal epithelium.
Protocol: Transporter-Specific Glucose Uptake and Transport
- Cell Culture: Seed and differentiate Caco-2/TC7 cells on transwell filters for 21 days to form a polarized monolayer with tight junctions.
- Inhibitor Pre-treatment: Add inhibitors to the apical (phlorizin) or basolateral (phloretin) compartments dissolved in the transport buffer. Incubate for a specified time (e.g., 30-60 minutes).
- Glucose Uptake/Transport Measurement:
- For apical uptake, add a non-metabolizable glucose analog like
3H- or 14C-labeled α-Methyl-D-glucopyranoside (AMG)or2-Deoxy-D-glucoseto the apical side in the presence or absence of phlorizin. Measure radiotracer accumulation inside the cells after a short incubation. - For trans-epithelial transport, add the tracer to the apical side and measure its appearance in the basolateral compartment over time. Phloretin in the basolateral chamber will inhibit the efflux step.
- For apical uptake, add a non-metabolizable glucose analog like
- Data Analysis: Calculate the apparent permeability coefficient (Papp) or the rate of tracer uptake. Inhibition is calculated as the percentage reduction in Papp or cellular uptake compared to vehicle-treated controls.
The diagram below illustrates the experimental workflow and mechanistic logic for using these probes in the isolated perfused intestine model.
Quantitative Data and Analysis
Data from controlled experiments allows for the quantification of the contribution of different transport pathways. The table below summarizes key quantitative findings from a study using the isolated vascularly perfused rat intestine [6].
Table 2: Quantitative Effects of Transporter Blockade on Intestinal Glucose Absorption
| Experimental Condition | Luminal Glucose Concentration | Total Glucose Absorption (μmol/15 min) | Reduction vs. Baseline | Interpretation |
|---|---|---|---|---|
| Baseline (No Inhibitor) | 100 mmol/L | 429.8 | - | Total glucose absorption via all pathways |
| + Luminal Phlorizin (SGLT1 block) | 100 mmol/L | 184.1 | ~60% | SGLT1 mediates majority of apical uptake |
| + Vascular Phloretin (GLUT2 block) | 100 mmol/L | 150.1 | ~70% | GLUT2 is critical for basolateral efflux |
| + Combined Phlorizin & Phloretin | 100 mmol/L | ~130.0* | ~30% remaining | Suggests a paracellular absorption component |
Note: The value for combined blockade is estimated based on the reported 70% decrease from a baseline of 470.2 μmol/15 min, leaving ~30% of absorption intact [6].
The Scientist's Toolkit: Essential Research Reagents
Successful experimentation requires a carefully selected set of reagents and tools. The following table details essential items for studies investigating intestinal glucose transport using these pharmacological probes.
Table 3: Key Research Reagent Solutions for Intestinal Glucose Transport Studies
| Reagent / Tool | Function & Application | Example & Notes |
|---|---|---|
| Phlorizin | Selective SGLT inhibitor used to block apical sodium-glucose cotransport. | Source from commercial suppliers (e.g., Merck). Dissolve in aqueous buffer (e.g., MilliQ water) for luminal application [6]. |
| Phloretin | Broad-spectrum GLUT inhibitor used to block basolateral glucose efflux. | Source from commercial suppliers (e.g., Merck). Due to poor water solubility, often requires dissolution in DMSO first [33] [6]. |
| Radioisotope Tracers | Enable sensitive and accurate quantification of glucose absorption and transport kinetics. | 14C-D-glucose: Gold standard for tracing total glucose [6]. 3H- or 14C-α-Methyl-D-glucopyranoside (AMG): Non-metabolizable SGLT substrate [34]. |
| In Vitro Intestinal Models | Provide a controlled, polarized human-relevant system for transport studies. | Caco-2/TC7 cell line: Requires 21-day differentiation on transwell filters to form functional monolayers [7]. |
| Ex Vivo Perfusion Systems | Preserve tissue integrity, cellular polarity, and intact transport pathways. | Isolated Vascularly Perfused Rat Intestine: Allows for separate access to luminal and vascular sides for precise inhibitor application [6]. |
| Selective SGLT1 Inhibitors | Used to confirm SGLT1-specific effects and rule out SGLT2 contribution. | Mizagliflozin: In PD models, it did not influence glucose transport, contrasting with phlorizin's effects [33]. |
Phlorizin and phloretin remain cornerstone pharmacological tools for dissecting the complex mechanism of intestinal glucose absorption. Their distinct and complementary mechanisms of action—blocking SGLT1 and GLUT2, respectively—allow researchers to deconstruct the transcellular transport pathway into its component parts and quantify their contributions. Experimental models like the isolated perfused intestine and Caco-2 cell monolayers, when combined with these probes, provide robust methodological frameworks for generating quantitative data. The residual glucose absorption observed after combined transporter blockade highlights the potential existence of other pathways, such as paracellular transport, warranting further investigation. As research progresses, these classic inhibitors continue to be invaluable for validating new models, testing novel compounds, and advancing our understanding of glucose homeostasis in health and metabolic disease.
The study of intestinal glucose absorption is pivotal for understanding nutrient uptake, metabolic health, and developing therapeutic strategies for conditions like diabetes and malabsorption syndromes. Central to this process are the key transporters Sodium-Glucose Cotransporter 1 (SGLT1) and Glucose Transporter 2 (GLUT2). SGLT1 is an apical membrane transporter responsible for active, sodium-dependent glucose uptake, particularly at low luminal concentrations. GLUT2, traditionally considered a basolateral exit pathway, is also proposed to contribute to apical uptake under high glucose loads via a controversial translocation mechanism [16] [25]. Resolving the precise roles and interactions of these transporters requires robust experimental models that faithfully replicate intestinal physiology.
This whitepaper provides an in-depth technical guide to two cornerstone methodologies: the Caco-2 cell line, a workhorse in vitro model, and the isolated vascularly perfused rat intestine, a sophisticated ex vivo preparation. We detail their applications, experimental protocols, and how data from these systems has shaped the current understanding of SGLT1 and GLUT2 in intestinal glucose handling, a topic of direct relevance to drug discovery and nutritional science.
The Caco-2 Cell Model: AnIn VitroWorkhorse
The Caco-2 cell line, derived from a human colorectal adenocarcinoma, is a widely used in vitro model for intestinal absorption studies. When grown on permeable supports and allowed to differentiate, these cells spontaneously polarize, form tight junctions, and develop a brush border membrane with microvilli, mimicking key structural features of human enterocytes [16] [36].
Key Methodologies and Protocols
A standard glucose uptake assay in Caco-2 cells involves the following workstream:
Detailed Protocol:
- Cell Culture: Seed Caco-2 cells (passages 20-60) on 24-well plates or Transwell inserts and culture for 15-21 days post-confluence to ensure full differentiation and polarization. Culture medium is typically Dulbecco's Modified Eagle Medium (DMEM) with high glucose (25 mM), supplemented with fetal bovine serum (10-20%), non-essential amino acids, and penicillin/streptomycin [16] [36].
- Glucose Uptake Assay: Differentiated monolayers are washed with a pre-warmed Krebs buffer. To dissect transporter-specific contributions, cells are pre-incubated with specific inhibitors: phlorizin (a SGLT1 inhibitor, typically 250-fold above IC50) and/or phloretin (a GLUT2 inhibitor) [16] [6]. Uptake is initiated by adding Krebs buffer containing varying concentrations of D-glucose (0.5-50 mM) spiked with radioactive tracers. 14C-D-glucose measures total glucose uptake, while 3H-L-glucose, a non-metabolizable analog, assesses passive paracellular diffusion [16].
- Termination and Analysis: The uptake reaction is stopped by rapid washing with ice-cold phosphate-buffered saline (PBS). Cells are then solubilized with 0.1N NaOH, and an aliquot is used for protein quantification (e.g., BCA assay). Radioactivity in the lysate is measured by scintillation counting to calculate the rate of glucose uptake [16].
Insights into SGLT1 and GLUT2 Biology
Research using Caco-2 cells has been instrumental in probing GLUT2 dynamics. Studies show that at high luminal glucose concentrations (≥20 mM), Caco-2 and RIE-1 cells exhibit a marked, phloretin-sensitive increase in glucose uptake. This enhanced uptake is dependent on an intact cytoskeleton (inhibited by nocodazole and cytochalasin B) and Protein Kinase C (PKC) signaling (inhibited by calphostin C and chelerythrine, and enhanced by PMA), supporting the hypothesis that GLUT2 can be translocated from cytoplasmic vesicles to the apical membrane to augment capacity [16].
However, a critical limitation of the Caco-2 model is its imperfect reflection of in vivo SGLT1 regulation. Unlike native enterocytes, Caco-2 cells show no upregulation of SGLT1-mediated glucose transport in response to sugar exposure or epinephrine stimulation [36]. This discrepancy underscores the importance of validating findings in more complex models.
The Isolated Perfused Intestine: AnEx VivoSystem
The isolated, vascularly perfused rat intestine is a more physiologically complex ex vivo model that preserves the intestinal mucosa's cellular polarity, vascular supply, and paracellular pathways, offering a bridge between cell culture and in vivo studies [37] [6].
Key Methodologies and Protocols
The core protocol for this model involves surgical isolation and controlled perfusion, as outlined below:
Detailed Protocol:
- Surgical Preparation: A rat is anesthetized, and a segment of the small intestine (often jejunum) is surgically isolated while carefully preserving its vascular connections. The mesenteric artery and vein are cannulated, and the intestinal segment is transferred to a temperature-controlled chamber [37] [6].
- Vascular and Luminal Perfusion: The vascular system is perfused with an oxygenated Krebs buffer, often containing dextran or albumin, to maintain tissue viability and clear absorbed nutrients. The intestinal lumen is simultaneously perfused with a solution containing glucose and radioactive tracers like 14C-D-glucose for sensitive quantification. 14C-D-mannitol, which is not actively transported, is used as a marker for paracellular flux [37] [6].
- Pharmacological Blockade: To dissect transport pathways, specific inhibitors are administered. Phlorizin is added to the luminal perfusate to block apical SGLT1. Phloretin is added to the vascular perfusate to block basolateral GLUT2, or to the luminal perfusate to test for the presence of apical GLUT2 [37] [6]. The glucose appearing in the venous effluent is measured, either directly or via radioactivity, to calculate absorption rates.
Quantitative Findings on Glucose Transport Pathways
This model has yielded critical quantitative data on the contribution of different transport pathways to overall glucose absorption, summarized in the table below.
Table 1: Quantitative contributions of glucose transport pathways in the isolated perfused rat intestine model, as revealed by pharmacological blockade. Data synthesized from [37] [6].
| Experimental Condition | Luminal Glucose Concentration | Reduction in Glucose Absorption | Implied Contribution of Targeted Pathway |
|---|---|---|---|
| Luminal SGLT1 Blockade (Phlorizin) | 100 mM | ~60% | SGLT1 mediates ~60% of total absorption. |
| Basolateral GLUT2 Blockade (Phloretin) | 100 mM | ~70-80% | GLUT2-mediated efflux is crucial for ~70-80% of absorption. |
| Combined SGLT1 & GLUT2 Blockade | 100 mM | ~70% (30% remains) | ~30% of absorption is transporter-independent (paracellular). |
| N/A (Baseline Paracellular) | N/A | N/A (measured via Mannitol) | Paracellular transport is greater in the proximal vs. distal intestine. |
A striking finding from this model is that SGLT1 inhibition led to a marked increase in mannitol absorption, suggesting that SGLT1 activity may normally suppress the paracellular pathway. When SGLT1 is blocked, this suppression is lifted, leading to enhanced paracellular glucose flux [37] [6]. This indicates a complex interplay between transcellular and paracellular absorption routes.
Model Comparison and Research Applications
The following table provides a direct comparison of the two models, highlighting their respective strengths and limitations for studying intestinal glucose transporters.
Table 2: Comparative analysis of Caco-2 cell and isolated perfused intestine models for glucose absorption research.
| Feature | Caco-2 Cell Model | Isolated Perfused Intestine |
|---|---|---|
| Physiological Complexity | Low (single cell type, no vascular or nervous input) | High (intact tissue architecture, vascular perfusion) |
| Throughput | High (suitable for screening) | Low (technically demanding, time-consuming) |
| Cost & Technical Demand | Relatively low and accessible | High (requires surgical expertise) |
| Paracellular Pathway | Can be measured, but may not fully replicate in vivo tight junction dynamics | Faithfully preserved and measurable |
| SGLT1 Regulation | Does not fully replicate in vivo regulatory responses (e.g., to sugar or epinephrine) [36] | Captures native regulatory mechanisms |
| GLUT2 Apical Translocation | Supports the hypothesis; allows study of cytoskeletal and PKC dependence [16] | Provides functional evidence; context-dependent |
| Ideal For | Initial screening, mechanistic dissection of specific transporters, studying intracellular signaling | Studying integrated transport, paracellular flux, and endocrine secretion in a near-physiological context |
The choice between models depends on the research question. The Caco-2 model is superior for high-throughput screening of transport inhibitors and delineating intracellular signaling pathways, such as those involved in proposed GLUT2 translocation. In contrast, the isolated perfused intestine is unparalleled for studying the integrated, coordinated function of SGLT1, GLUT2, and the paracellular pathway under conditions that closely mimic the in vivo environment [37] [16] [6].
The Scientist's Toolkit: Essential Research Reagents
Successful experimentation in these models relies on a suite of key reagents and tools.
Table 3: Essential research reagents for investigating SGLT1 and GLUT2 in intestinal models.
| Reagent / Tool | Function / Target | Brief Description & Application |
|---|---|---|
| Phlorizin | SGLT1 Inhibitor | A potent, competitive inhibitor of SGLT1. Used in luminal perfusate (perfused intestine) or incubation buffer (Caco-2) to block active glucose transport. |
| Phloretin | GLUT2 Inhibitor | A broad-spectrum inhibitor of facilitative glucose transporters. Used in vascular perfusate to block basolateral GLUT2 or luminally to test for apical GLUT2. |
| 14C-D-Glucose | Radioactive Tracer for Glucose | Used to trace and quantitatively measure total glucose uptake and absorption with high sensitivity in both models. |
| 3H-L-Glucose / 14C-D-Mannitol | Paracellular Flux Markers | Non-metabolizable sugars used to assess passive, paracellular absorption, as they are not transported by SGLT1 or GLUT2. |
| Nocodazole / Cytochalasin B | Cytoskeleton Disruptors | Microtubule and actin filament disruptors, respectively. Used in Caco-2 studies to inhibit proposed GLUT2 vesicular trafficking to the apical membrane. |
| PKC Inhibitors (Calphostin C) & Activator (PMA) | Signaling Modulators | Used in Caco-2 models to probe the role of Protein Kinase C in the regulation of GLUT2 translocation and function. |
Both Caco-2 cells and the isolated perfused intestine are indispensable tools for dissecting the roles of SGLT1 and GLUT2 in intestinal glucose absorption. The Caco-2 model offers unparalleled mechanistic insights into cellular processes like GLUT2 translocation, while the perfused intestine provides a holistic, physiologically relevant view that integrates transcellular and paracellular transport. The evidence from these models confirms that SGLT1 is the primary apical transporter for glucose, but also highlights a significant role for paracellular absorption, particularly in the proximal intestine [37] [6] [25]. The contentious hypothesis of apical GLUT2 translocation finds support in Caco-2 cell studies [16], though its in vivo relevance remains debated [17] [14] [13]. For researchers in drug development, a strategic approach often involves leveraging the high throughput of Caco-2 screens for initial compound identification, followed by validation of promising candidates in the more physiologically complex perfused intestine system to confidently predict in vivo efficacy.
The management of blood glucose levels is a complex process orchestrated by multiple organs and specialized transporter proteins. Among these, the sodium-glucose cotransporters (SGLTs) and facilitative glucose transporters (GLUTs) play pivotal roles in the absorption and reabsorption of glucose in the intestine and kidneys, respectively. SGLT1 is essential for dietary glucose uptake in the intestine, while SGLT2 is responsible for the majority of glucose reabsorption in the renal tubules [18] [38]. The facilitative glucose transporter GLUT2 provides basolateral exit for glucose in both enterocytes and renal tubular cells, completing the transcellular transport pathway [3] [4]. Understanding the distinct functions and regulatory mechanisms of these transporters has paved the way for novel therapeutic strategies in diabetes management, particularly through the development of selective SGLT inhibitors. This whitepaper examines the scientific rationale, development process, and clinical applications of SGLT1 and SGLT2 inhibitors, with particular emphasis on their role in modulating intestinal and renal glucose handling.
Scientific Rationale: SGLT and GLUT Transporters as Therapeutic Targets
Molecular Physiology of Glucose Transporters
Glucose transport across epithelial barriers occurs via two distinct families of transport proteins. The SGLT family mediates active, sodium-coupled glucose transport against concentration gradients, while the GLUT family enables facilitative diffusion down concentration gradients. SGLT1, encoded by the SLC5A1 gene, is predominantly expressed in the intestinal mucosa (specifically in the brush border membrane of enterocytes) and the S3 segment of the renal proximal tubule [18] [38]. Its high affinity for glucose (Km ≈ 0.5-1.0 mM) makes it particularly suited for complete absorption of dietary glucose from the intestinal lumen. In the kidney, SGLT1 reabsorbs the residual glucose that escapes SGLT2-mediated reabsorption, accounting for approximately 3% of total renal glucose reabsorption under normal physiological conditions [18].
SGLT2, encoded by the SLC5A2 gene, is primarily located in the S1 segment of the renal proximal tubule and exhibits a lower affinity but higher capacity for glucose transport (Km ≈ 2-6 mM) [18]. Under normal conditions, SGLT2 mediates the reabsorption of approximately 90% of the glucose filtered by the glomeruli [39] [40]. The remaining 10% is reabsorbed by SGLT1 in the distal segments of the proximal tubule [39]. In individuals with diabetes, the expression of SGLT2 in the proximal renal tubule is increased, elevating the maximum transport capacity for glucose and contributing to the maintenance of hyperglycemia [39] [40].
GLUT2, encoded by the SLC2A2 gene, is a low-affinity glucose transporter (Km ≈ 17 mmol/L) expressed in the liver, pancreatic β-cells, renal tubules, and the basolateral membrane of intestinal epithelial cells [3] [4]. In the intestine, GLUT2 facilitates glucose exit from enterocytes into the bloodstream following SGLT1-mediated uptake at the apical membrane. Recent evidence suggests that GLUT2 may also be recruited to the apical membrane under high luminal glucose conditions, potentially contributing to bulk glucose absorption [3]. However, studies in genetically modified mice have challenged this hypothesis, demonstrating that SGLT1 remains the primary intestinal glucose transporter even at high luminal glucose concentrations [14].
Pathophysiological Basis for Inhibitor Development
In type 2 diabetes, the renal glucose reabsorptive capacity is enhanced due to increased SGLT2 expression and tubular growth, creating a maladaptive cycle that perpetuates hyperglycemia [18]. This observation, coupled with the benign nature of familial renal glucosuria (caused by mutations in the SLC5A2 gene), provided the fundamental rationale for developing SGLT2 inhibitors as glucose-lowering agents [18]. The therapeutic strategy involves inhibiting renal glucose reabsorption to enhance urinary glucose excretion, effectively opening the "renal safety valve" at lower blood glucose concentrations.
The rationale for targeting intestinal SGLT1 stems from its role as the primary mediator of dietary glucose absorption. Partial inhibition of SGLT1 could reduce postprandial hyperglycemia while potentially enhancing glucagon-like peptide-1 (GLP-1) secretion through delayed glucose absorption in the distal intestine [38]. However, complete SGLT1 inhibition is problematic due to the potential for glucose-galactose malabsorption syndrome, characterized by severe diarrhea [39]. This has led to the development of dual SGLT1/SGLT2 inhibitors with modest SGLT1 activity or compounds with preferential intestinal activity.
Diagram 1: Glucose Transport Pathways and Inhibitor Targets. This diagram illustrates the distinct roles of SGLT1, SGLT2, and GLUT2 in intestinal glucose absorption and renal glucose reabsorption, highlighting key targets for therapeutic inhibition.
Historical Development and Key Compounds
From Phlorizin to Selective Inhibitors
The development of SGLT inhibitors traces back to phlorizin, a natural product isolated from apple tree bark in 1835 [39] [40] [41]. Phlorizin is a non-selective SGLT inhibitor that blocks both SGLT1 and SGLT2, producing glucosuria and reducing blood glucose levels in experimental models. However, its clinical utility was limited by poor oral bioavailability, short half-life, and gastrointestinal side effects resulting from SGLT1 inhibition [18]. Nevertheless, phlorizin served as a valuable pharmacological tool that established the proof-of-concept for SGLT inhibition as an antihyperglycemic strategy.
The first generation of selective SGLT2 inhibitors emerged from structure-activity relationship studies aimed at improving selectivity, metabolic stability, and oral bioavailability. Canagliflozin became the first SGLT2 inhibitor approved by the US Food and Drug Administration (FDA) in 2013, followed by dapagliflozin, empagliflozin, and ertugliflozin [18] [42] [39]. More recently, dual SGLT1/SGLT2 inhibitors such as sotagliflozin have been developed to simultaneously target intestinal glucose absorption and renal glucose reabsorption [39].
Table 1: Selectivity Profiles of SGLT Inhibitors
| Drug Name | Primary Target | Selectivity Ratio (SGLT2:SGLT1) | Key Characteristics |
|---|---|---|---|
| Empagliflozin | SGLT2 | 2500-fold | Highest SGLT2 selectivity |
| Ertugliflozin | SGLT2 | 2235-fold | High SGLT2 selectivity |
| Dapagliflozin | SGLT2 | 1200-fold | Intermediate selectivity |
| Canagliflozin | SGLT2 | 200-fold | Lower selectivity, mild SGLT1 inhibition |
| Sotagliflozin | SGLT2/SGLT1 | 20-fold | Dual inhibitor with significant SGLT1 activity |
Clinical Development and Regulatory Milestones
The clinical development of SGLT2 inhibitors was shaped by the FDA's 2008 mandate requiring cardiovascular outcome trials for all new antidiabetic medications [39]. This requirement led to large-scale trials that unexpectedly revealed significant cardiovascular and renal benefits beyond glycemic control:
- EMPA-REG OUTCOME (2015): Demonstrated a significant reduction in major adverse cardiovascular events (MACE) and cardiovascular mortality with empagliflozin in patients with type 2 diabetes and established cardiovascular disease [18] [39].
- CANVAS Program (2017): Showed cardiovascular protection with canagliflozin, including a 14% relative risk reduction in MACE [42].
- DECLARE-TIMI 58 (2019): Established dapagliflozin's efficacy in reducing heart failure hospitalizations, though it did not significantly reduce MACE [42].
- CREDENCE (2019): Specifically demonstrated renal protective effects of canagliflozin in patients with diabetic nephropathy, with a 30% reduction in the composite renal endpoint [42].
These findings prompted regulatory agencies to expand the indications for SGLT2 inhibitors beyond diabetes to include heart failure and chronic kidney disease, regardless of diabetic status [42] [39].
Experimental Approaches and Methodologies
In Vitro Transport Assays
The characterization of SGLT inhibitor selectivity and potency relies on established in vitro transport models:
Heterologous Expression Systems: cDNA encoding human SGLT1 or SGLT2 is transfected into Xenopus laevis oocytes or mammalian cell lines (e.g., CHO, HEK293). Transport activity is measured using radiolabeled α-methyl-D-glucopyranoside (AMG), a non-metabolizable SGLT substrate. Uptake is quantified by scintillation counting after incubation with test compounds [18] [43]. This method allows precise determination of inhibitor IC₅₀ values and selectivity ratios.
Electrophysiological Analysis: For SGLT1, which couples glucose transport to sodium movement, two-electrode voltage clamping in oocytes can measure transporter-associated currents. This technique provides real-time kinetic data on transporter function and inhibition [43].
In Vivo Animal Models
Genetically Modified Mice:
- Sglt1⁻/⁻ mice: Maintained on a glucose-free diet to avoid lethal glucose-galactose malabsorption. Used to study intestinal glucose absorption and validate SGLT1 as a drug target [14].
- Sglt2⁻/⁻ mice: Exhibit renal glucosuria without serious complications, modeling the human condition of familial renal glucosuria and supporting the safety of SGLT2 inhibition [18].
- Glut2⁻/⁻ mice: Neonatal lethal, but RIP-GLUT1×GLUT2⁻/⁻ mice with GLUT1 re-expression in β-cells survive and show impaired glucose-stimulated insulin secretion [14].
Glucose Tolerance Tests: Mice are fasted overnight and administered glucose orally or intraperitoneally with or without SGLT inhibitors. Blood glucose and hormone levels (insulin, GLP-1, GIP) are measured at regular intervals to assess the impact of transporter inhibition on glucose homeostasis [14].
Radiotracer Absorption Studies: Mice are gavaged with ¹⁴C-labeled glucose and ³H-mannitol (extracellular marker). After 15 minutes, intestinal segments are collected and tracer retention quantified by scintillation counting. This approach directly measures glucose uptake along the intestinal tract [14].
Clinical Trial Methodologies
Cardiovascular Outcome Trials (CVOTs): Randomized, double-blind, placebo-controlled trials in high-risk patients with type 2 diabetes. Primary endpoints typically include MACE (cardiovascular death, nonfatal myocardial infarction, nonfatal stroke). Key secondary endpoints often include heart failure hospitalization and renal outcomes [18] [42].
Renal Outcome Trials: Specialized trials in patients with diabetic kidney disease, using composite endpoints such as end-stage kidney disease, doubling of serum creatinine, and renal or cardiovascular death [42].
Table 2: Key Clinical Trials of SGLT Inhibitors
| Trial Name | Drug | Population | Key Findings |
|---|---|---|---|
| EMPA-REG OUTCOME | Empagliflozin | T2D with CVD | 35% reduction in HF hospitalization; 38% reduction in CV death |
| CANVAS Program | Canagliflozin | T2D with high CV risk | 14% reduction in MACE; 33% reduction in HF hospitalization |
| CREDENCE | Canagliflozin | T2D with CKD | 30% reduction in composite renal endpoint |
| DAPA-HF | Dapagliflozin | HFrEF with/without T2D | 26% reduction in worsening HF or CV death |
| EMPEROR-Preserved | Empagliflozin | HFpEF with/without T2D | 21% reduction in CV death or HF hospitalization |
Data compiled from [18] [42] [39]
Mechanism of Action and Signaling Pathways
Renal Mechanisms
SGLT2 inhibitors block glucose reabsorption in the S1 segment of the proximal tubule, increasing urinary glucose excretion by approximately 70-80 g/day [18]. This insulin-independent mechanism results in plasma glucose reduction of 0.5-0.6% in HbA1c with low hypoglycemia risk [39] [40]. The co-transport of sodium with glucose also leads to natriuresis and osmotic diuresis, contributing to blood pressure reduction and volume contraction [18] [41].
An important renal effect is the reduction in intraglomerular pressure through tubuloglomerular feedback. Increased sodium delivery to the macula densa triggers afferent arteriolar vasoconstriction, lowering glomerular hyperfiltration—a key pathological feature in diabetic kidney disease [18] [41]. This mechanism underlines the renoprotective effects of SGLT2 inhibitors demonstrated in clinical trials.
Intestinal and Systemic Mechanisms
Dual SGLT1/2 inhibitors and partial SGLT1 inhibitors delay intestinal glucose absorption, reducing postprandial hyperglycemia. Additionally, delayed glucose absorption in the distal intestine enhances GLP-1 secretion, further improving glycemic control [38]. The combined renal and intestinal actions of dual inhibitors provide complementary glucose-lowering effects.
Beyond direct glycemic effects, SGLT inhibitors influence multiple metabolic pathways. They promote a shift in substrate utilization from carbohydrates to lipids and ketones, potentially improving myocardial energy efficiency [39]. They also suppress pro-inflammatory cytokines, enhance antioxidant defenses, and inhibit TGF-β-mediated fibrosis in the heart and kidneys [39] [40].
Diagram 2: Multiorgan Mechanisms of SGLT Inhibitors. This diagram illustrates the integrated pharmacological effects of SGLT2 and dual SGLT1/2 inhibitors across renal, intestinal, and systemic pathways, culminating in cardiovascular and renal protection.
The Scientist's Toolkit: Essential Research Reagents and Methodologies
Table 3: Key Research Reagents for SGLT/GLUT Transport Studies
| Reagent/Cell Line | Application | Key Characteristics |
|---|---|---|
| Xenopus laevis oocytes | Heterologous expression of SGLT/GLUT transporters | Suitable for electrophysiology and radiotracer uptake studies; enables precise functional characterization |
| Caco-2 cells | Intestinal glucose transport models | Human colorectal adenocarcinoma cells that differentiate into enterocyte-like cells; model for intestinal absorption |
| HEK293 cells | High-throughput screening | Easily transfected human embryonic kidney cells; suitable for rapid assessment of inhibitor potency |
| ¹⁴C-AMG (α-methyl-D-glucopyranoside) | SGLT transport assays | Non-metabolizable glucose analog; ideal for quantifying SGLT-specific transport activity |
| ³H-Mannitol | Paracellular permeability marker | Validates monolayer integrity in transport studies; controls for non-specific permeability |
| Sglt1⁻/⁻ and Sglt2⁻/⁻ mice | In vivo target validation | Genetically modified models to study transporter-specific physiology and pharmacology |
| GLUT2 antibodies | Immunohistochemistry and Western blot | Validates transporter localization and expression levels in tissues |
| Phlorizin | Reference SGLT inhibitor | Non-selective natural product; useful as a control compound in experimental studies |
Information compiled from [18] [14] [43]
The development of SGLT inhibitors represents a paradigm shift in diabetes therapy, moving beyond insulin-centric approaches to target fundamental processes in renal and intestinal glucose handling. The journey from phlorizin to selective SGLT2 inhibitors and dual SGLT1/2 inhibitors exemplifies successful translational science, beginning with basic physiology and culminating in clinically impactful therapeutics.
Unexpected beneficial effects on heart failure and renal outcomes have substantially expanded the clinical utility of these agents beyond their original glucosed-lowering indications. Ongoing research continues to elucidate novel applications for SGLT inhibitors in metabolic liver disease, weight management, and other cardiometabolic conditions.
Future developments in this field will likely include tissue-specific targeting, combination therapies with other glucose-lowering agents, and personalized approaches based on genetic variations in transporter expression and function. The continued investigation of SGLT and GLUT biology will undoubtedly yield further insights into glucose homeostasis and additional therapeutic opportunities for diabetes and related metabolic disorders.
Intestinal glucose absorption, a critical process for maintaining systemic glucose homeostasis, is primarily mediated by the coordinated actions of the sodium-glucose cotransporter 1 (SGLT1) and the facilitative glucose transporter 2 (GLUT2). Emerging evidence demonstrates that dietary components, particularly oat β-glucan, can significantly modulate the activity and expression of these key transporters. This whitepaper synthesizes current research on the mechanisms by which oat β-glucan and other nutrients influence SGLT1 and GLUT2, highlighting implications for managing postprandial glycemia and metabolic diseases. We provide detailed experimental methodologies, quantitative data summaries, and key signaling pathways to support ongoing research and therapeutic development in this field.
The absorption of dietary glucose across the intestinal epithelium is a process fundamental to energy homeostasis, with dysregulation contributing to metabolic disorders including type 2 diabetes and obesity. This transcellular transport is predominantly mediated by two key transporters: SGLT1 (SLC5A1) at the apical membrane of enterocytes, which actively transports glucose against its concentration gradient using the sodium electrochemical gradient, and GLUT2 (SLC2A2) at the basolateral membrane, which facilitates passive glucose efflux into the circulation [44] [21]. Beyond this classic model, research has revealed a more complex regulatory framework where GLUT2 can be recruited to the apical membrane under high luminal glucose conditions, providing a high-capacity transport pathway [6] [21]. The critical role of these transporters in glycemic control makes them prime targets for dietary interventions aimed at modulating the rate of intestinal glucose absorption. This whitepaper examines the specific effects of oat β-glucan and other nutrients on these transport systems, providing researchers with mechanistic insights and methodological guidance for further investigation.
Physiological Role and Regulation of SGLT1 and GLUT2
Transport Mechanisms and Kinetics
SGLT1 is a secondary active transporter that couples the movement of two sodium ions with one glucose molecule into the cell. This process is driven by the Na+/K+-ATPase-generated sodium gradient and is characterized by high affinity for D-glucose and D-galactose, with a reported Km for glucose of approximately 0.5 mM in humans [21]. Its activity is specifically inhibited by phlorizin [6] [21].
GLUT2 operates through facilitative diffusion, allowing glucose to move along its concentration gradient. It displays a lower affinity but higher capacity for glucose transport, with a Km of approximately 17 mM in humans, and also transports galactose and fructose [21]. Its activity can be blocked by phloretin [6] [21].
Complex Regulation of Transporter Expression and Localization
The regulation of these transporters occurs at multiple levels:
- Membrane Trafficking: At low luminal glucose concentrations (<30 mM), GLUT2 is primarily localized to the basolateral membrane. However, high luminal glucose stimulates the rapid translocation of GLUT2 to the apical membrane, significantly increasing transport capacity [21].
- Transcriptional and Post-translational Control: The expression of SGLT1 is regulated by luminal nutrient sensing via the sweet taste receptor (T1R2/T1R3), which triggers a signaling cascade involving GLP-2 secretion, enteric nervous system activation, and increased SGLT1 mRNA stability [45]. Both transporters are also subject to post-translational modification, with phosphorylation status affecting SGLT1 affinity for glucose [46].
- Hormonal Influence: Hormones such as GLP-2 and dexamethasone have been shown to upregulate SGLT1 expression and enhance glucose absorption [45] [7].
Table 1: Key Characteristics of Intestinal Glucose Transporters
| Characteristic | SGLT1 (SLC5A1) | GLUT2 (SLC2A2) |
|---|---|---|
| Transport Mechanism | Secondary active co-transport (2 Na⁺:1 glucose) | Facilitated diffusion |
| Primary Membrane Location | Apical (Brush Border) | Basolateral (can translocate to apical) |
| Substrate Affinity (Km) | ~0.5 mM (D-glucose, human) | ~17 mM (D-glucose, human) |
| Substrate Specificity | D-glucose, D-galactose | D-glucose, D-galactose, D-fructose |
| Specific Inhibitor | Phlorizin | Phloretin |
| Regulatory Factors | T1R2/T1R3 sensing, GLP-2, Ca²⁺ signaling [45] [10] | T1R2/T1R3 sensing, GLP-2, dietary carbohydrates [45] |
Oat β-Glucan: Mechanisms of Action on Glucose Transporters
Direct Inhibition of Transporter Expression and Function
Oat β-glucan, a soluble dietary fiber, exerts significant effects on intestinal glucose transporters through multiple complementary mechanisms. In intestinal epithelial cells (IEC-6), treatment with oat β-glucan at concentrations of 4-8 mg/mL resulted in a marked dose-dependent suppression of both SGLT1 and GLUT2 expression, corresponding with reduced glucose uptake [47] [48]. This direct modulation of transporter expression represents a primary mechanism for its blood glucose-lowering effects. The viscosity of oat β-glucan solutions appears crucial to this functionality, as it creates a physical barrier that impedes nutrient diffusion and access to the epithelial surface [47]. This viscous environment likely alters the kinetics of glucose transport without necessarily changing the number of transporter proteins present in the membrane.
Impact on Glucose Uptake Kinetics
The temporal dynamics of oat β-glucan's effects are particularly noteworthy. Experiments using the non-metabolizable glucose analog 2-NBDG revealed that in untreated IEC-6 cells, glucose uptake levels decreased by 70% between 10 and 60 minutes of exposure to 5 mmol/L glucose in the medium, suggesting normal regulatory feedback mechanisms. However, in β-glucan-treated cells, this pattern was significantly altered, with the fiber effectively blocking the time-dependent changes in glucose uptake observed in controls [47]. This disruption of normal absorption kinetics contributes to a flattened postprandial glycemic response, making oat β-glucan particularly beneficial for managing mealtime glucose excursions.
Table 2: Quantitative Effects of Oat β-Glucan on Glucose Transport in IEC-6 Cells
| Experimental Parameter | Control Conditions | Oat β-Glucan Treatment | Reference |
|---|---|---|---|
| Glucose uptake (2-NBDG) at 60 min | 70% decrease from 10 min levels | Significant attenuation of time-dependent decrease | [47] |
| SGLT1 & GLUT2 expression | Increased with time (0-60 min) and glucose (5-25 mM) | Dose-dependent suppression (4-8 mg/mL) | [47] [48] |
| Proposed primary mechanism | Normal absorption kinetics | Viscosity-mediated barrier and transporter downregulation | [47] |
Other Nutritional Factors Modulating Transporter Activity
Luminal Sweet Sensing and Endocrine Pathways
Beyond oat β-glucan, various nutritional factors influence SGLT1 and GLUT2 activity. The gut-expressed sweet taste receptor (T1R2/T1R3) plays a pivotal role in sensing luminal sugars and low-calorie sweeteners. Activation of this receptor on enteroendocrine L-cells triggers the secretion of GLP-2, which subsequently acts on enteric neurons to release neuropeptides (VIP/PACAP) that ultimately enhance SGLT1 expression and activity [45]. Recent evidence extends this regulatory pathway to include GLUT2, with studies demonstrating that sweeteners activating T1R2/T1R3 (e.g., sucralose) significantly upregulated GLUT2 expression in wild-type mice but not in T1R3 or gustducin knockout mice [45].
Ionic and Signaling Regulation
Calcium signaling represents another crucial regulatory pathway for intestinal glucose transport. Research indicates that ileal glucose absorption operates more efficiently in the presence of both intracellular and extracellular Ca²⁺ than under Ca²⁺-free conditions [10]. This Ca²⁺ dependence suggests a role for store-operated Ca²⁺ entry (SOCE) and Ca²⁺-induced Ca²⁺ release (CICR) mechanisms in modulating SGLT1 activity. Conversely, activation of the 5-HT4 receptor-cAMP-PKA pathway has been shown to reduce ileal glucose uptake, indicating complex, segment-specific regulation of transport processes by different second messenger systems [10].
Pathophysiological Context: Obesity and Diabetes
In pathological conditions such as obesity, the adipose tissue-derived secretome (ADS) undergoes significant alteration, which in turn affects glucose transporter function. ADS from obese Zucker rats (OZR) uniquely stimulates SGLT1 activity in intestinal epithelial cells by increasing the transporter's affinity for glucose without changing transporter number, mediated through altered phosphorylation patterns [46]. This obesity-induced enhancement of glucose absorption may contribute to the development of hyperglycemia and type 2 diabetes. Additionally, studies in type 2 diabetes frequently report increased rates of glucose absorption, potentially related to upregulated SGLT1 expression and function [49].
Experimental Approaches and Methodologies
Cell Culture Models and Glucose Uptake Assays
The intestinal epithelial cell line IEC-6 (nontransformed rat small intestine epithelial cells) has proven valuable for studying glucose transport mechanisms. A standard protocol involves:
- Cell Culture: Maintain IEC-6 cells in Dulbecco's modified Eagle medium (DMEM) supplemented with fetal bovine serum and appropriate antibiotics at 37°C under 10% CO₂ [47].
- Glucose Uptake Measurement: Use the non-metabolizable glucose analog 2-[N-(7-nitrobenz-2-oxa-1,3-diazol-4-yl)amino]-2-deoxy-d-glucose (2-NBDG) to quantify glucose uptake. Cells are exposed to experimental treatments (e.g., oat β-glucan at 4-8 mg/mL) for varying durations (10-60 minutes) across different glucose concentrations (5-25 mmol/L) [47].
- Inhibitor Applications: Specific transporter inhibitors including phlorizin (SGLT1 inhibitor, typically 1 μmol/L) and phloretin (GLUT2 inhibitor, typically 1 mmol/L) can be applied to delineate individual transporter contributions [6].
- Expression Analysis: Assess SGLT1 and GLUT2 protein expression via Western blotting following treatment interventions [47] [48].
Perfused Intestinal Models
The isolated vascularly perfused rat small intestine preparation provides a more physiologically relevant model that preserves epithelial polarity and intact transport pathways:
- Tissue Preparation: Isolate and vascularly perfuse rat small intestine with oxygenated buffer solutions [6].
- Glucose Absorption Tracing: Use radioactively labeled ¹⁴C-D-glucose to sensitively quantify glucose absorption rates. Include ¹⁴C-D-mannitol as a marker for paracellular transport [6].
- Experimental Design: Apply luminal glucose challenges (e.g., 10-100 mmol/L) with and without transporter inhibitors to determine specific transport pathway contributions [6].
In Vivo Animal Studies
Whole animal studies provide systems-level understanding:
- Dietary Interventions: Supplement animal diets with compounds of interest (e.g., plant-based sweetener formulations) for defined periods (typically 14 days) [45].
- Genetic Models: Utilize knockout mice (e.g., T1R3⁻/⁻, Gα-gustducin⁻/⁻, GLP-2R⁻/⁻) to elucidate specific pathway components [45].
- Tissue Analysis: Collect intestinal segments for membrane vesicle preparation, transporter expression analysis, and immunohistochemical studies [45].
The diagram below illustrates the key signaling pathways regulating SGLT1 and GLUT2 in response to luminal nutrients:
Diagram Title: Nutrient-Sensing Pathways Regulating SGLT1 and GLUT2
The Scientist's Toolkit: Essential Research Reagents
Table 3: Key Research Reagents for Studying SGLT1 and GLUT2 Function
| Reagent/Cell Line | Specific Function in Research | Example Application |
|---|---|---|
| IEC-6 cells | Nontransformed rat small intestinal epithelial cell line | In vitro glucose uptake and transporter expression studies [47] |
| Caco-2/TC7 cells | Human colon carcinoma-derived cell model that differentiates into enterocyte-like cells | Studying human-specific transport mechanisms and drug effects [7] |
| 2-NBDG | Non-metabolizable fluorescent glucose analog | Real-time tracking and quantification of glucose uptake [47] |
| ¹⁴C-D-glucose | Radioactive glucose tracer | Sensitive quantification of glucose absorption in perfused systems [6] |
| Phlorizin | Specific SGLT1 inhibitor (IC50 ~0.004 mM) | Blocking SGLT1-mediated transport to isolate its contribution [6] [21] |
| Phloretin | GLUT2 inhibitor (typically used at 1 mM) | Blocking GLUT2-mediated transport to isolate its contribution [6] [21] |
| Obese Zucker Rats (OZR) | Genetic model of obesity (Leprfa mutation) | Studying obesity-associated alterations in glucose transport [46] |
| T1R3/gustducin KO mice | Knockout models lacking sweet taste signaling components | Elucidating T1R2/T1R3-dependent regulatory pathways [45] |
The strategic modulation of intestinal glucose transporters SGLT1 and GLUT2 by dietary components represents a promising approach for managing postprandial glycemia and associated metabolic disorders. Oat β-glucan emerges as a particularly effective modulator, operating through multiple complementary mechanisms including transporter downregulation and physical barrier formation. The intricate regulatory networks involving luminal nutrient sensing, endocrine signaling, and neuronal pathways highlight the sophistication of intestinal adaptation to dietary intake. Further research should focus on optimizing the molecular weight and viscosity characteristics of oat β-glucan for maximal efficacy, exploring synergistic effects with other bioactive compounds, and translating these findings into targeted nutritional strategies for individuals with impaired glucose tolerance. The experimental methodologies and reagents outlined in this whitepaper provide a foundation for advancing these research objectives and developing novel evidence-based interventions for metabolic disease prevention and management.
Resolving Controversies and Optimizing Functional Analysis
The role of glucose transporter 2 (GLUT2) in the apical membrane of intestinal enterocytes remains a contentious subject in glucose absorption physiology. While the basolateral localization of GLUT2 for facilitating glucose exit from enterocytes is well-established, its proposed recruitment to the apical membrane during high luminal glucose conditions has generated significant debate. This review critically examines the conflicting evidence from contamination-controlled studies and genetic knockout models, analyzes methodological disparities that contribute to the controversy, and synthesizes findings on GLUT2's potential role in apical glucose sensing and absorption. The weight of evidence from carefully controlled knockout studies suggests that sodium-glucose cotransporter 1 (SGLT1) serves as the primary mediator of intestinal glucose absorption, with GLUT2 playing a more nuanced role in glucose sensing and metabolic adaptation than previously recognized.
Intestinal glucose absorption represents a critical interface between nutrition and systemic metabolism, primarily mediated by transporter proteins in the enterocyte membrane. The classical model posits a clear分工: SGLT1 handles apical sodium-glucose cotransport from the intestinal lumen into enterocytes, while GLUT2 facilitates basolateral glucose exit into circulation [13] [14]. However, this conventional understanding was challenged by the proposed "apical GLUT2 hypothesis," which suggests that GLUT2 can be recruited to the brush border membrane during high luminal glucose conditions to contribute substantially to glucose uptake [50].
The hypothesis emerged from observations that intestinal glucose absorption appears to exceed the theoretical transport capacity of SGLT1 alone at high luminal glucose concentrations (>30 mM) [6]. Kellett and colleagues provided foundational support for this concept, demonstrating a phloretin-sensitive glucose transport component and proposing GLUT2 as the mediator of this low-affinity, high-capacity transport pathway [50]. Subsequent research suggested this apical recruitment might be triggered by intracellular glucose concentrations and involve rapid trafficking of GLUT2-containing intracellular vesicles to the apical membrane [51].
This review systematically evaluates the critical evidence for and against apical GLUT2 participation in intestinal glucose absorption, with particular focus on methodological considerations in membrane preparation, contamination controls, and evidence from genetic knockout models that has reshaped our understanding of intestinal glucose transport physiology.
Competing Models of Intestinal Glucose Absorption
The mechanism of intestinal glucose absorption varies significantly between the conventional model and the apical GLUT2 hypothesis, particularly at high luminal glucose concentrations.
Table 1: Key Characteristics of Competing Glucose Absorption Models
| Parameter | Conventional Model | Apical GLUT2 Hypothesis |
|---|---|---|
| Primary apical transporter | SGLT1 exclusively | SGLT1 + GLUT2 (at high glucose) |
| GLUT2 localization | Basolateral membrane only | Dynamic (basolateral + apical recruitment) |
| Mechanism at high luminal glucose | SGLT1 saturation + paracellular transport | SGLT1 + apical GLUT2-mediated facilitated diffusion |
| Theoretical transport capacity | Limited by SGLT1 Vmax | Expanded by GLUT2 addition |
| Pharmacological profile | Phlorizin-sensitive (apical) | Phlorizin + phloretin-sensitive (apical) |
| Time dependence | Immediate | Rapid recruitment (minutes) |
Critical Evidence from Contamination-Controlled Studies
Methodological Challenges in Membrane Localization
The detection of GLUT2 in apical membrane preparations has been complicated by significant methodological challenges, primarily concerning contamination from basolateral membranes during brush border membrane vesicle (BBMV) isolation. Multiple studies have demonstrated that without rigorous controls, apparent apical GLUT2 signals may represent basolateral contamination rather than genuine apical localization [13] [14].
Röder et al. (2014) conducted particularly compelling contamination-controlled experiments using Western blot analysis of BBMV preparations. Their critical methodological innovation was the simultaneous application of basolateral marker proteins to quantify and account for cross-contamination [13] [14]. When proper normalization was applied to account for basolateral contamination, the researchers found that GLUT2 detected in apical membrane fractions did not change in density following glucose administration. This challenges the apical recruitment hypothesis, which predicts increased apical GLUT2 following high luminal glucose exposure.
Pharmacological Inhibition Studies
The interpretation of pharmacological inhibition studies has been central to the apical GLUT2 debate. Proponents of apical GLUT2 recruitment frequently point to the phloretin-sensitive component of glucose transport as evidence for GLUT2-mediated apical uptake [50]. However, this interpretation has been challenged on multiple fronts:
Specificity issues: Phloretin is not uniquely specific to GLUT2 and can block chloride channels, aquaporin water channels, and urea transporters, potentially by intercalating with the lipid membrane [50]. This lack of specificity means that phloretin inhibition alone cannot definitively demonstrate GLUT2 involvement.
Paracellular effects: Phloretin may also inhibit paracellular solute and water transport, complicating the interpretation of absorption studies [50].
Directionality concerns: Mathematical modeling suggests that upregulation of GLUT2 within the intestinal brush border would typically stimulate downhill glucose reflux to the intestinal lumen from enterocytes, thereby reducing rather than enhancing net glucose absorption across the luminal surface [50].
A recent vascular perfusion study (2025) demonstrated that luminal administration of the GLUT2 inhibitor phloretin reduced total glucose absorption by approximately 55%, which the authors suggested might support apical GLUT2 involvement [6]. However, they acknowledged the alternative explanation that phloretin itself might be transported across the epithelium, complicating interpretation.
Genetic Knockout Models: Challenging the Apical GLUT2 Paradigm
GLUT2-Deficient Mouse Models
Genetic knockout models have provided particularly compelling evidence regarding GLUT2's role in intestinal glucose transport. Contrary to what the apical GLUT2 hypothesis would predict, GLUT2-deficient animals do not show impaired intestinal glucose absorption; rather, they exhibit increased glucose retention in intestinal tissues [13].
Table 2: Key Findings from Transporter Knockout Studies
| Experimental Model | Glucose Absorption Phenotype | Incretin Secretion | Interpretation |
|---|---|---|---|
| SGLT1 knockout [13] [14] | Drastically reduced throughout entire small intestine | Abolished GIP and GLP-1 secretion | SGLT1 is essential for apical glucose uptake and sensing |
| GLUT2 knockout [13] [14] | Higher tracer contents in tissue samples than wild-type | Normal GIP and GLP-1 secretion; impaired insulin secretion | GLUT2 disruption increases tissue glucose retention; role in insulin secretion rather than absorption |
| Intestinal-specific GLUT2 knockout [28] | Glucose malabsorption with delayed tissue distribution | Preserved GLP-1 function with adaptations | GLUT2 important for basolateral exit, not apical uptake |
| SGLT1 inhibition [6] | ~60% reduction at 100mM luminal glucose | Not assessed | SGLT1 mediates majority of absorption even at high concentrations |
| GLUT2 inhibition [6] | ~70% reduction at 100mM luminal glucose | Not assessed | Supports GLUT2 role in basolateral exit |
In mice lacking SGLT1, tissue retention of tracer glucose was drastically reduced throughout the entire small intestine following radiolabeled glucose gavage [13] [14]. This severe impairment demonstrates SGLT1's indispensable role in apical glucose uptake. Strikingly, GLUT2-deficient animals exhibited precisely the opposite phenotype—higher tracer glucose contents in intestinal tissue samples than wild-type animals [13]. This increased retention suggests that glucose enters enterocytes normally but encounters impaired exit across the basolateral membrane, consistent with GLUT2's established basolateral localization and function rather than a role in apical uptake.
Intestinal Epithelial Cell-Specific GLUT2 Deletion
Further evidence comes from inducible, intestinal-specific GLUT2 knockout models (GLUT2ΔIEC mice). These animals develop glucose malabsorption evidenced by delayed distribution of oral sugar to tissues [28]. The metabolic consequences include limited body weight gain despite normal food intake, improved glucose tolerance, and increased ketone body production—features reminiscent of calorie restriction [28]. These findings are consistent with impaired glucose transfer from intestine to circulation, but do not distinguish between apical and basolateral transport defects.
Notably, intestinal GLUT2 deletion also reduced microvillus length and altered gut microbiota composition, suggesting broader adaptive changes in intestinal structure and function [28]. This complexity highlights how knockout models may produce phenotypes resulting from both direct and indirect effects of gene deletion.
Technical Approaches and Research Toolkit
Critical Methodological Considerations
The conflicting evidence in the apical GLUT2 literature largely stems from methodological differences across studies. Several technical approaches have proven critical for generating reliable data:
Membrane Preparation and Contamination Controls The most rigorous studies implement simultaneous basolateral marker assessment during BBMV preparation [13] [14]. Without such controls, contamination levels ranging from 5-20% can lead to false-positive apical GLUT2 detection. The magnesium precipitation method for BBMV isolation requires particular caution, as it may yield significant basolateral contamination.
Radiotracer Transport Studies The use of dual- or triple-radiotracer approaches (e.g., [14C]glucose with [3H]mannitol to correct for adherent fluid) provides superior quantification of glucose uptake compared to indirect blood glucose measurements [13] [14]. This methodology directly demonstrated increased glucose retention in GLUT2-deficient enterocytes.
Vascular Perfusion Models Recent studies using isolated, vascularly perfused rat intestine allow precise control of luminal and serosal conditions while maintaining tissue viability [6]. This model demonstrated that approximately 30% of glucose absorption persists after combined SGLT1 and GLUT2 blockade, suggesting additional transport pathways.
Table 3: Essential Research Reagents and Their Applications
| Reagent/Category | Specific Examples | Research Application | Key Considerations |
|---|---|---|---|
| Transporter Inhibitors | Phlorizin (SGLT1), Phloretin (GLUT2) | Pharmacological dissection of transport components | Specificity concerns; potential effects on paracellular transport |
| Genetic Models | Global GLUT2 KO, Intestinal-specific GLUT2 KO, SGLT1 KO | Assessment of transporter necessity | Compensatory mechanisms may develop; constitutive vs. inducible deletion |
| Radiotracers | [14C]glucose, [3H]mannitol, 2FDG | Quantitative glucose uptake and distribution | Mannitol corrects for extracellular fluid space; 2FDG for PET imaging |
| Antibodies | GLUT2-specific antibodies, Basolateral markers (Na+/K+ ATPase) | Localization studies | Validation for Western blot, immunohistochemistry essential |
| Cell Models | Caco-2, IEC-6, RIE-1 | Mechanistic studies in polarized epithelium | Variable differentiation and polarization across lines |
Experimental Workflows for Apical GLUT2 Investigation
Discussion and Synthesis
Reconciling Conflicting Evidence
The weight of evidence from contamination-controlled studies and genetic knockout models challenges the concept of nutritionally relevant apical GLUT2 participation in intestinal glucose absorption. Several key observations emerge from this analysis:
First, SGLT1 appears to be the dominant and likely exclusive mediator of apical glucose uptake, even at high luminal glucose concentrations. The severe glucose absorption impairment in SGLT1 knockout models contrasts sharply with the relatively mild phenotypes in GLUT2-deficient models [13] [14].
Second, GLUT2's primary role appears to be basolateral glucose exit from enterocytes, consistent with its established localization and function. The increased glucose retention in intestinal tissues of GLUT2-deficient animals supports this conclusion [13].
Third, the phloretin-sensitive glucose transport component historically attributed to apical GLUT2 may instead represent one or more of the following: inhibition of basolateral GLUT2 function, effects on paracellular transport, or impacts on other transport systems [50].
Potential Resolution: Context-Dependent GLUT2 Roles
Rather than a binary debate, emerging evidence suggests GLUT2 may play context-dependent roles in intestinal glucose handling:
Metabolic adaptation: Intestinal GLUT2 deletion produces metabolic benefits including improved glucose tolerance and reduced weight gain, suggesting GLUT2 modulation might have therapeutic potential [28].
Compensatory mechanisms: GLUT2-deficient models show remarkable metabolic plasticity, with increased ketone body production and microbiota changes compensating for glucose malabsorption [28].
Cell-type specific functions: GLUT2 in enteroendocrine cells may participate in glucose sensing rather than absorption, potentially explaining some conflicting findings [52].
Species and methodological differences: Discrepancies between studies may reflect genuine biological differences across species or experimental preparations, rather than erroneous findings.
Future Research Directions
Resolution of the apical GLUT2 debate will require:
Advanced imaging approaches: Super-resolution microscopy and in vivo imaging could definitively establish GLUT2 membrane localization under physiological conditions.
Temporally controlled models: Inducible, cell-type specific knockout systems with precise temporal control would help distinguish direct from adaptive effects.
Human studies: Ultimately, translation of these findings to human physiology is essential, particularly given potential species differences.
Integrated modeling: Computational approaches incorporating all glucose transport pathways may help reconcile apparently contradictory findings.
The critical evidence from contamination-controlled studies and genetic knockout models presents significant challenges to the apical GLUT2 hypothesis. While SGLT1 unequivocally serves as the primary intestinal glucose transporter, GLUT2 appears to play a more nuanced role in glucose sensing, metabolic adaptation, and basolateral exit than previously recognized. The methodological lessons from this debate—particularly the importance of rigorous contamination controls and careful interpretation of pharmacological inhibition studies—provide valuable guidance for future investigations of membrane transport physiology. As research continues, the focus should shift from binary debates about GLUT2 localization toward understanding how multiple transport systems integrate to maintain metabolic homeostasis across varying nutritional conditions.
Accounting for Paracellular Pathways in Glucose Absorption Models
The classical model of intestinal glucose absorption describes a transcellular pathway mediated by the apical sodium-glucose cotransporter 1 (SGLT1) and the basolateral facilitative glucose transporter 2 (GLUT2). However, emerging evidence indicates that this model is incomplete. Paracellular transport, the passive movement of glucose through tight junctions between epithelial cells, contributes significantly to overall glucose absorption, particularly at high luminal glucose concentrations that saturate SGLT1 capacity.
This technical guide synthesizes current research on paracellular glucose transport, its interaction with established transcellular pathways, and methodologies for its quantification. Framed within the broader context of SGLT1 and GLUT2 research, we examine how accounting for paracellular diffusion resolves discrepancies between theoretical transporter capacity and measured absorption rates, with critical implications for understanding postprandial glycemia and developing therapeutic interventions.
Physiological Mechanisms of Intestinal Glucose Absorption
The Dual-Pathway Absorption System
Intestinal glucose absorption occurs through two primary pathways with distinct mechanisms and regulation:
Transcellular Transport: This active, saturable pathway involves glucose entry into enterocytes via SGLT1 on the apical membrane, followed by basolateral exit into circulation primarily via GLUT2. SGLT1-mediated transport is electrogenic, coupling two sodium ions with one glucose molecule, and saturates at luminal glucose concentrations of approximately 30 mM [6] [15].
Paracellular Transport: This passive, non-saturable pathway involves glucose movement through tight junctions between epithelial cells, driven by concentration gradients. Its contribution becomes particularly significant at high luminal glucose concentrations that exceed SGLT1 transport capacity [6].
Table 1: Characteristics of Intestinal Glucose Transport Pathways
| Feature | SGLT1-Mediated Transcellular | GLUT2-Mediated Transcellular | Paracellular |
|---|---|---|---|
| Mechanism | Secondary active transport (Na+-coupled) | Facilitated diffusion | Passive diffusion |
| Kinetics | Saturable (Km ~30 mM) | Saturable (high capacity) | Non-saturable |
| Driving Force | Na+ electrochemical gradient | Concentration gradient | Concentration gradient |
| Inhibitors | Phlorizin | Phloretin | - |
| Contribution at High Luminal Glucose | ~60% of total absorption | Controversial/context-dependent | ~30-40% of total absorption |
Quantitative Contributions of Each Pathway
Recent research using specific transporter inhibitors has enabled quantification of each pathway's contribution to total glucose absorption:
- SGLT1 blockade with phlorizin reduces glucose absorption by approximately 60% at 100 mM luminal glucose [6]
- Combined SGLT1 and GLUT2 inhibition still leaves approximately 30% of glucose absorption intact, attributed to paracellular transport [6]
- Paracellular glucose absorption demonstrates regional variation along the intestinal tract, with greater efficiency in the proximal compared to distal small intestine [6]
Unexpectedly, SGLT1 inhibition increases paracellular permeability, as indicated by enhanced mannitol absorption. This suggests SGLT1 activity may regulate tight junction permeability, representing a potential compensatory mechanism when the primary transcellular pathway is compromised [6].
Figure 1: Dual-Pathway Model of Intestinal Glucose Absorption. The diagram illustrates transcellular pathways mediated by SGLT1 and GLUT2, alongside the paracellular pathway. Apical GLUT2 translocation remains controversial [13] [14].
Experimental Approaches for Studying Paracellular Transport
Isolated Vascularly Perfused Intestine Model
The isolated vascularly perfused rat intestine preparation preserves epithelial polarity and intact transport pathways, making it particularly valuable for differentiating absorption mechanisms [6].
Key Methodology:
- Tissue Preparation: Isolate and vascularly perfuse rat small intestinal segments with oxygenated physiological buffer
- Luminal Perfusion: Administer glucose solutions at varying concentrations (0-20% w/v) to the intestinal lumen
- Tracer Application: Use 14C-D-glucose to quantify total glucose absorption and 14C-D-mannitol as a paracellular marker
- Transporter Inhibition: Apply specific inhibitors (phlorizin for SGLT1; phloretin for GLUT2) to isolate individual pathway contributions
- Sample Collection: Measure radiolabeled tracer appearance in venous effluent over timed intervals
Quantification:
- Calculate absorption rates from arteriovenous concentration differences × flow rates
- Determine phlorizin-insensitive absorption (paracellular component) as the residual absorption after SGLT1 inhibition
This model demonstrated non-saturable glucose absorption at high luminal concentrations (>278 mM), consistent with significant paracellular contribution [6].
Radioisotope Tracer Studies with Transporter Knockout Models
Studies using SGLT1 and GLUT2 knockout mice provide genetic evidence for transporter-independent absorption pathways [13] [14].
Experimental Protocol:
- Animal Models: SGLT1-/- mice (maintained on glucose-free diet) and GLUT2-/- mice compared to wild-type controls
- Glucose Gavage: Administer radiolabeled [14C(U)]-D-glucose solution (4 g/kg body weight) via feeding tube
- Tissue Processing: After 15 minutes, euthanize animals and collect intestinal segments
- Radiotracer Quantification: Measure 14C retention in intestinal tissue segments and plasma samples using liquid scintillation counting
- Membrane Fractionation: Isolate brush border membrane vesicles via MgCl2 precipitation for Western blot analysis of transporter density
Key Findings:
- SGLT1-deficient mice show drastically reduced intestinal glucose retention but maintain residual absorption
- GLUT2 detection in apical membrane fractions primarily results from basolateral membrane contamination
- Paracellular transport explains the phlorizin-insensitive glucose absorption observed in wild-type animals [13]
Computational Modeling Approaches
Mathematical models integrate physiological data to predict system behavior under various conditions, providing insights into paracellular transport significance [15].
Model Framework:
- Multi-Compartment Structure: Lumen, enterocyte, and blood compartments with precise transporter localization
- Transporter Kinetics: Implement SGLT1 using 6-state kinetic model and GLUT2 using alternating conformation model
- Parameterization: Fit Vmax and Km values to experimental flux data (SGLT1: Vmax ~150-200 nmol/min/cm, Km ~2-5 mM; GLUT2: Vmax ~300-600 nmol/min/cm, Km ~30-100 mM)
- Water Transport: Include osmolarity-driven water movement to account for solvent drag effects
- Validation: Compare model predictions to experimental intestinal loop data from dogs
Applications:
- Predict relative contributions of transcellular versus paracellular pathways under varying luminal glucose concentrations
- Test hypotheses regarding GLUT2 translocation and its functional impact
- Model cell volume changes in response to osmotic gradients created by glucose transport [15]
Table 2: Experimental Models for Studying Paracellular Glucose Transport
| Method | Key Applications | Strengths | Limitations |
|---|---|---|---|
| Isolated Perfused Intestine | Quantifying pathway-specific contributions; Transporter inhibition studies | Preserved tissue architecture and polarity; Controlled experimental conditions | Requires specialized technical expertise; Limited viability time |
| Transporter Knockout Models | Establishing genetic evidence for pathway significance; Studying compensatory mechanisms | Definitive evidence for transporter necessity; Physiological relevance | Potential developmental compensation; Dietary modifications required |
| Computational Modeling | Predicting system behavior; Testing hypotheses under various conditions | Ability to simulate conditions not easily testable experimentally; Quantitative integration of multiple data sets | Dependent on accurate parameterization; Model complexity requires validation |
| Using Chamber Experiments | Electrophysiological characterization of transport | High temporal resolution; Direct measurement of electrogenic transport | Does not preserve vascular perfusion; Tissue damage during mounting |
Advanced Methodologies for Pathway Differentiation
3P-EIS: A Novel Electrophysiological Approach
The 3 P-EIS (Epithelial Impedance Spectroscopy) method combines mathematical modeling with intracellular recordings to differentiate apical, basolateral, and paracellular electrical properties [53].
Technical Implementation:
- Intracellular Recording: Impale epithelial cells with sharp microelectrodes to measure intracellular potential
- Impedance Spectroscopy: Apply alternating currents across the epithelium and measure impedance spectra
- Mathematical Modeling: Use circuit models of epithelial transport to derive membrane-specific resistances and capacitances
- Validation: Test method on electronic circuit models with known parameters (median error: 19% for paracellular and transcellular resistances)
Applications:
- Precisely quantify paracellular resistance independent of transcellular pathways
- Monitor real-time changes in tight junction permeability in response to SGLT1 inhibition or other perturbations
- Study epithelial barrier maturation and integrity in disease models (celiac disease, diabetes) [53]
Paracellular Tracer Flux Measurements
Differentiating paracellular from transcellular transport requires appropriate marker molecules that exclusively utilize the paracellular route.
Standard Protocol:
- Marker Selection: Use 14C-mannitol or other non-metabolized molecules that cannot cross lipid membranes via transporter-mediated pathways
- Dual-Tracer Experiments: Co-administer 14C-glucose with 3H-mannitol to correct for extracellular fluid contamination
- Inhibition Controls: Apply transporter inhibitors (phlorizin, phloretin) to isolate paracellular component
- Permeability Calculation: Calculate permeability coefficients from tracer appearance rates in serosal compartment
Key Insight: Mannitol absorption increases markedly when SGLT1 is blocked, suggesting SGLT1 activity may regulate tight junction permeability through unknown mechanisms [6].
Figure 2: Experimental Workflow for Paracellular Pathway Quantification. This flowchart outlines the key methodological steps for differentiating and quantifying paracellular glucose absorption using tracer studies and specific transporter inhibitors.
The Scientist's Toolkit: Essential Research Reagents
Table 3: Key Research Reagents for Studying Glucose Absorption Pathways
| Reagent | Primary Function | Application Notes | Mechanism of Action |
|---|---|---|---|
| Phlorizin | SGLT1 inhibition | Apply luminally (1 μM); ~250-fold higher than IC50; Minimal effect when administered vasculature | Competitive antagonist binding to outer surface of SGLT1 [6] |
| Phloretin | GLUT2 inhibition | Apply vasculature (1 mM) or luminally; Less specific than phlorizin | Non-competitive inhibitor of facilitative glucose transporters [6] |
| 14C-D-Glucose | Glucose absorption tracer | Use in tracer amounts (370 Bq/μl) with high-specific activity; Correct for extracellular fluid with 3H-mannitol | Radiolabeled glucose analog transported by all glucose pathways [6] [13] |
| 14C-D-Mannitol | Paracellular marker | Non-metabolized marker; Similar molecular weight to glucose; Validates tight junction integrity | Passive paracellular diffusion without transporter interaction [6] |
| Dynasore | Endocytosis inhibitor | Test GLUT2 translocation hypothesis; 62.5 μM concentration | Inhibits dynamin-dependent endocytosis mechanisms [54] |
| MgCl2 Precipitation | Brush border membrane isolation | Separate apical from basolateral membranes; Validate with marker enzymes | Differential precipitation of membrane fractions [13] |
Implications for Glucose Homeostasis and Therapeutic Development
The paracellular pathway significantly influences postprandial glucose kinetics, particularly following high-carbohydrate meals that generate luminal glucose concentrations exceeding SGLT1 saturation (~30 mM). Understanding this pathway has important implications:
Metabolic Regulation:
- Paracellular transport contributes to rapid glucose absorption when luminal concentrations are high, potentially exacerbating postprandial hyperglycemia
- The pathway may become more significant in disease states characterized by altered tight junction integrity
- SGLT1 activity appears to regulate paracellular permeability, suggesting coordinated regulation of both pathways [6]
Drug Development:
- Current SGLT inhibitors only partially reduce intestinal glucose absorption due to persisting paracellular transport
- Therapeutic targeting of paracellular permeability could provide complementary approaches for managing postprandial glycemia
- Understanding pathway interactions is crucial for predicting effects of transporter-targeted therapies [55]
Research Directions:
- Elucidate molecular mechanisms linking SGLT1 activity to tight junction regulation
- Quantify paracellular contributions in human intestine under physiological conditions
- Develop specific modulators of paracellular permeability for therapeutic applications
Integrating paracellular pathways into models of intestinal glucose absorption provides a more complete physiological picture that explains observed absorption rates exceeding theoretical SGLT1 capacity. The combined experimental approaches outlined in this technical guide—including perfused intestine preparations, transporter knockout models, computational modeling, and advanced electrophysiological techniques—enable researchers to quantitatively dissect the contributions of each pathway.
Accounting for paracellular transport resolves apparent discrepancies in the literature regarding GLUT2 translocation and provides a framework for understanding how the intestine adapts to varying carbohydrate loads. This comprehensive model of glucose absorption, incorporating both transcellular and paracellular components, offers new perspectives for managing postprandial glycemia in metabolic disorders and developing more effective therapeutic strategies.
Intestinal glucose absorption, primarily mediated by the transporters SGLT1 and GLUT2, represents a critical pathway for maintaining systemic energy balance. Research in this field, however, is marked by significant discrepancies arising from the use of different experimental models and species. This whitepaper synthesizes findings from contemporary studies to delineate how variations in methodology—including the use of isolated organ perfusions, genetically modified mouse models, and cell culture systems—produce conflicting data on the relative contributions of active versus passive transport pathways and the potential apical role of GLUT2. By providing a structured comparison of quantitative data, detailed experimental protocols, and key reagent solutions, this guide aims to equip researchers and drug development professionals with the tools to critically evaluate existing literature and design robust experiments that account for these fundamental sources of variability.
The canonical model of intestinal glucose absorption posits a two-step transcellular process: apical sodium-glucose cotransporter 1 (SGLT1) mediates active glucose uptake into enterocytes, followed by basolateral exit via facilitative glucose transporter 2 (GLUT2) [56]. Despite this established framework, substantial inconsistencies persist in the scientific literature concerning the mechanisms operating at high luminal glucose concentrations. A key hypothesis suggesting the rapid recruitment of GLUT2 to the apical membrane to facilitate bulk absorption [6] has been both supported and refuted by different research groups, creating a contentious landscape. These disagreements often stem not from experimental error but from intrinsic differences in the chosen research models—including species (human, rat, mouse), experimental preparations (e.g., isolated perfused intestine, cell lines, in vivo knockouts), and specific methodological protocols. This review navigates these discrepancies, framing them within the context of GLUT2 and SGLT1 research to foster a more nuanced understanding of intestinal glucose transport physiology and its implications for drug discovery.
Quantitative Data: Comparative Findings Across Models and Species
Table 1: Impact of Transporter Blockade on Glucose Absorption
| Experimental Model | Intervention | Impact on Glucose Absorption | Key Findings | Citation |
|---|---|---|---|---|
| Isolated perfused rat intestine | Luminal SGLT1 blockade (Phlorizin) | ~60% reduction at 100 mM glucose | ~40% of absorption was SGLT1-independent, suggesting other pathways. | [6] |
| Isolated perfused rat intestine | Basolateral GLUT2 blockade (Phloretin) | ~70-80% reduction at 100 mM glucose | Highlights GLUT2's critical role in basolateral glucose efflux. | [6] |
| Isolated perfused rat intestine | Combined SGLT1 & GLUT2 blockade | ~70% reduction at 100 mM glucose | ~30% of glucose absorption remained, indicating a paracellular route. | [6] |
| Sglt1 −/ − knockout mice | Genetic SGLT1 deletion | Drastically reduced tissue tracer retention | SGLT1 is the prime glucose transporter, even at high luminal concentrations. | [13] [17] |
| Glut2 −/ − knockout mice | Genetic GLUT2 deletion | Higher tissue tracer retention than wild-type | Suggests compensatory mechanisms or altered metabolism in knockout models. | [13] [17] |
| Human intestinal Caco-2/TC7 cells | Dexamethasone treatment | Increased glucose transport via SGLT1 upregulation | Demonstrates hormonal regulation of SGLT1 in a human-relevant model. | [7] |
Table 2: Hormonal and Physiological Modulators of Glucose Transporters
| Modulator | Experimental Context | Effect on SGLT1 | Effect on GLUT2 | Citation |
|---|---|---|---|---|
| Estrogen (via ERα) | Ovariectomized mice & SCBN cell line | Upregulated expression and function | Upregulated expression and function | [57] |
| Dexamethasone | Human Caco-2/TC7 cell line | mRNA and transport activity increased | mRNA expression decreased | [7] |
| Pregnancy (Late Stage) | Mouse model (GD17.5) | Region-specific changes in transcript (Slc5a1) | Region-specific changes in transcript (Slc2a2) | [58] |
| Oat β-Glucan | Rat intestinal IEC-6 cell line | Depressed expression and transport | Depressed expression and transport | [47] |
Detailed Experimental Protocols from Key Studies
Isolated Vascularly Perfused Rat Intestine Model
This protocol, which preserves intestinal polarity and vascular clearance, is used to differentiate transport mechanisms and measure hormone secretion [6].
- Organ Isolation and Perfusion: The entire small intestine is surgically isolated from anesthetized rats. The lumen is cannulated, and the superior mesenteric artery is cannulated for vascular perfusion with an oxygenated physiological buffer (e.g., Krebs-Henseleit solution) containing a macromolecule like dextran to maintain oncotic pressure.
- Luminal and Vascular Interventions: The lumen is perfused with solutions containing different glucose concentrations (e.g., 10 mM to 1100 mM). Test compounds are administered either luminally or vascularly:
- SGLT1 Inhibition: Phlorizin (1 µM) is added to the luminal perfusate.
- GLUT2 Inhibition: Phloretin (1 mM) is added to the vascular perfusate.
- Glucose Absorption Quantification:
- Method A (Glucometer): The venous effluent is collected, and glucose concentration is measured directly using a handheld glucometer. Absorption is calculated as the arteriovenous concentration difference multiplied by the vascular flow rate.
- Method B (Radiotracer): The luminal perfusate is spiked with 14C-labeled D-glucose. The appearance of radioactivity in the venous effluent is measured using a liquid scintillation counter, allowing for highly sensitive and specific quantification of absorbed glucose from the lumen. 14C-D-mannitol is often co-administered as a marker for paracellular flux.
- Data Analysis: Glucose absorption rates are calculated under different conditions (e.g., baseline, inhibitor presence) and compared to determine the contribution of each transport pathway.
Genetic Knockout Mouse Model for In Vivo Absorption
This protocol assesses the physiological role of specific transporters in a live animal model without relying on pharmacological agents [13] [17].
- Animal Models: Genetically engineered mice lacking either SGLT1 (sglt1⁻/⁻) or GLUT2 (glut2⁻/⁻) are used. Wild-type littermates serve as controls. To ensure viability, sglt1⁻/⁻ mice are maintained on a glucose- and galactose-free diet.
- Radiolabeled Glucose Gavage: After a fasting period, mice are orally gavaged with a glucose bolus (e.g., 4 g/kg body weight). The solution contains a tracer amount of 14C-labeled D-glucose and 3H-labeled D-mannitol.
- Tissue and Plasma Sampling: Fifteen minutes post-gavage, blood is collected from the retro-orbital plexus to measure plasma 14C levels. Mice are then euthanized, and the entire small intestine is excised, everted, and washed in ice-cold buffer.
- Tracer Retention Measurement: The intestine is divided into sequential 1 cm segments. The radioactivity in each segment is quantified by scintillation counting. The 3H-mannitol signal corrects for glucose trapped in the extracellular fluid. Glucose retention is expressed as nmol of glucose per cm of intestine over 15 minutes.
- Hormonal Response: Plasma from the vena cava is analyzed using ELISA kits to measure glucose-induced secretion of incretin hormones (GIP, GLP-1) and insulin.
Cell Culture Model for Transporter Regulation (Caco-2/TC7)
This protocol uses a human-derived intestinal epithelial cell line to study transporter regulation and function in a controlled environment [7].
- Cell Culture and Differentiation: Caco-2/TC7 cells are seeded onto permeable filter supports (e.g., Transwell inserts) and cultured for at least 21 days. During this period, they spontaneously differentiate into a polarized monolayer that exhibits enterocyte-like properties, including the formation of tight junctions and the expression of brush border enzymes.
- Treatment with Modulators: Differentiated monolayers are treated with the compound of interest (e.g., 5-20 µM dexamethasone) for a specified period (e.g., 60 hours). The vehicle (e.g., DMSO) is used as a control.
- Glucose Transport Assay: Cells are starved in glucose-free medium. Apical-to-basolateral glucose transport is assessed by adding a non-metabolizable glucose analog, 2-deoxy-D-glucose, to the apical chamber and measuring its appearance in the basolateral chamber over time.
- Molecular Analysis: Following transport assays, total RNA is extracted from the cell monolayers. The mRNA expression levels of SGLT1, GLUT2, and other genes of interest are quantified using reverse transcription followed by droplet digital PCR (ddPCR) or quantitative PCR (qPCR). Protein levels can be assessed by Western blot or ELISA.
Diagram 1: Controversial pathways for intestinal glucose absorption.
The Scientist's Toolkit: Key Research Reagents and Models
Table 3: Essential Reagents and Models for Intestinal Glucose Transport Research
| Tool / Reagent | Function / Purpose | Example Use Case | Key Considerations |
|---|---|---|---|
| Phlorizin | Potent, competitive inhibitor of SGLT1. | Applied luminally to isolate SGLT1-mediated transport in perfused intestines [6] [13]. | High specificity for SGLT1; ineffective when applied vascularly. |
| Phloretin | Inhibitor of facilitative glucose transporters (GLUT2). | Applied vasculally to block basolateral glucose efflux in perfused intestines [6]. | Less specific than phlorizin; can inhibit other GLUT isoforms. |
| 14C-D-Glucose | Radiolabeled glucose tracer. | Used in gavage studies and perfusion models to track and quantify absorbed glucose with high sensitivity [6] [13]. | Allows distinction from endogenous glucose; requires radiation safety protocols. |
| 3H-D-Mannitol | Radiolabeled paracellular marker. | Co-administered with 14C-glucose to correct for extracellular fluid adhesion and estimate paracellular flux [13]. | Not metabolized by cells; ideal for measuring passive, paracellular transport. |
| 2-Deoxy-D-Glucose / 2-NBDG | Non-metabolizable glucose analogs. | Used in cell culture (e.g., Caco-2, IEC-6) to measure glucose uptake without interference from subsequent metabolism [47] [7]. | 2-NBDG is fluorescent, facilitating real-time imaging in live cells. |
| Caco-2/TC7 Cells | Human colon carcinoma cell line that differentiates into enterocyte-like monolayers. | Study of human-specific transporter regulation, e.g., by dexamethasone or estrogen [57] [7]. | Model of human intestinal epithelium; requires long (3-week) differentiation. |
| IEC-6 Cells | Non-transformed rat intestinal epithelial cell line. | Investigation of transporter expression and response to dietary components like oat β-glucan [47]. | Proliferative crypt cell model; does not fully differentiate like Caco-2 cells. |
| SGLT1 and GLUT2 Knockout Mice | Genetically modified models lacking specific transporters. | Determination of a transporter's essential role in vivo and investigation of compensatory mechanisms [13] [17]. | Sglt1⁻/⁻ require a special diet; compensatory pathways can confound interpretation. |
Analysis of Discrepancies and Signaling Pathways
The core discrepancies in the field often revolve around the quantitative contribution of different transport pathways and the proposed apical recruitment of GLUT2.
SGLT1 as the Prime Transporter vs. Paracellular Contribution: Studies using sglt1⁻/⁻ knockout mice provide compelling evidence that SGLT1 is the dominant and essential route for intestinal glucose absorption, even at high luminal concentrations, with no major role for apical GLUT2 [13] [17]. In contrast, data from the isolated perfused rat intestine shows that a significant portion (~30-40%) of glucose absorption persists after potent SGLT1 blockade, strongly suggesting a meaningful paracellular component [6]. This discrepancy may be attributed to species differences (rat vs. mouse) or the experimental model itself, as the isolated perfused organ may better preserve the integrity of tight junctions and paracellular space compared to in vivo gavage models.
The Apical GLUT2 Controversy: The hypothesis that GLUT2 is recruited to the apical membrane during high glucose loads is a major point of contention. Research in rats and certain cell models has supported this concept [6]. However, careful studies in mice, including Western blot analysis of apical membrane fractions with basolateral marker controls, found that GLUT2 detected in brush border membranes was due to basolateral contamination and did not change with glucose administration [13]. This highlights the critical importance of methodological rigor in membrane purification and the potential for species-specific regulatory mechanisms.
Hormonal Regulation Adds a Layer of Complexity: Beyond acute glucose exposure, transporter expression is modulated by hormones, creating another source of variation. Estrogen upregulates both SGLT1 and GLUT2 expression via an ERα-dependent mechanism and downstream PKC signaling [57]. Conversely, the corticosteroid dexamethasone upregulates SGLT1 while downregulating GLUT2 in human intestinal cells [7]. These findings indicate that the hormonal milieu of the experimental subject (e.g., sex, stress, endocrine status) can profoundly influence baseline transporter expression and confound cross-study comparisons.
Diagram 2: Hormonal regulation of SGLT1 and GLUT2 expression.
Discrepancies in intestinal glucose transport research are not merely artifacts but reflections of the complex interplay between species-specific physiology, experimental design, and methodological sensitivity. The choice of model—be it rat, mouse, or human cell line—fundamentally shapes the experimental findings and their interpretation. For drug development professionals targeting SGLT1 or GLUT2, these variations are critical. A compound that effectively blocks apical GLUT2 in a rat model may prove ineffective in humans if this pathway is not functionally significant.
Future research must prioritize studies that directly compare different species and methodologies under standardized conditions. The use of more complex human-relevant models, such as organ-on-a-chip systems that incorporate fluid flow and cellular complexity, may help bridge the gap between simplified cell cultures and whole-animal physiology. Furthermore, accounting for variables such as sex hormones and circadian rhythms in experimental design will be essential for generating reproducible and translatable data. By acknowledging and systematically investigating these sources of discrepancy, the scientific community can refine its understanding of intestinal glucose absorption and develop more effective therapeutic strategies for metabolic diseases.
Optimizing Experimental Conditions for Accurate Transporter Localization and Quantification
The precise localization of the glucose transporters sodium-glucose cotransporter 1 (SGLT1) and facilitative glucose transporter 2 (GLUT2) within intestinal enterocytes represents a critical challenge with significant implications for understanding glucose homeostasis. The classical model posits that SGLT1 mediates apical glucose uptake while GLUT2 facilitates basolateral exit [13] [56]. However, research conducted over the past two decades has proposed a more dynamic model wherein GLUT2 can be recruited to the apical membrane following high luminal glucose loads, potentially contributing to bulk glucose absorption [6]. This controversy highlights the profound impact that experimental conditions, model systems, and methodological approaches can have on research outcomes and interpretations. Resolving these discrepancies requires meticulous optimization of localization and quantification techniques to account for species differences, dietary conditions, and methodological artifacts that may obscure true physiological mechanisms. This technical guide provides evidence-based strategies for optimizing experimental conditions to achieve accurate, reproducible transporter localization and quantification data within the context of intestinal glucose absorption research.
Critical Assessment of Current Evidence and Discrepancies
Contradictory Findings from Knockout Mouse Models
Studies utilizing genetically modified mouse models have yielded particularly conflicting results regarding GLUT2's apical localization and functional significance:
Table 1: Key Findings from Transporter Knockout Mouse Studies
| Transporter Deleted | Effect on Intestinal Glucose Uptake | Effect on Incretin Secretion | Evidence for Apical Localization |
|---|---|---|---|
| SGLT1 [13] | Drastically reduced throughout entire small intestine | Abolished GIP and GLP-1 secretion | Not applicable (apical transporter) |
| GLUT2 [13] | Increased tracer glucose retention in tissue | No impairment in GIP or GLP-1 secretion | No evidence found in apical membrane fractions |
| Intestinal-specific GLUT2 [59] | Glucose malabsorption with delayed tissue distribution | Preserved enteroendocrine function | Not directly assessed |
Research in SGLT1-deficient mice demonstrates this transporter's non-redundant role in intestinal glucose uptake and incretin secretion [13]. Surprisingly, GLUT2-deficient animals exhibited higher tracer glucose retention in intestinal tissues compared to wild-type controls, suggesting compensatory mechanisms or altered glucose metabolism. Crucially, Western blot analysis of apical membrane fractions from these models revealed that GLUT2 detection primarily resulted from basolateral membrane contamination, with no changes observed after glucose administration [13].
Methodological Influences on Observed Transport Mechanisms
Table 2: Glucose Absorption Mechanisms Under Different Experimental Conditions
| Experimental Model | SGLT1 Contribution | GLUT2 Contribution | Paracellular Contribution | Key Findings |
|---|---|---|---|---|
| Isolated perfused rat intestine [6] | ~60% at 100 mmol/L glucose | ~55% with luminal phloretin | ~30% after combined SGLT1/GLUT2 blockade | Paracellular transport significant, especially proximally |
| Mouse intestinal sleeves [13] | Primary transporter even at high concentrations | No apical role detected | Not assessed | GLUT2 apical recruitment not observed |
| Goldfish intestine [60] | Present and ghrelin-responsive | Present and ghrelin-responsive | Not assessed | Endocrine regulation conserved across species |
The vascularly perfused rat intestine model revealed that glucose absorption involves multiple pathways [6]. SGLT1 blockade with phlorizin reduced absorption by approximately 60%, while GLUT2 inhibition with phloretin decreased absorption by approximately 55% when applied luminally. Notably, after combined transporter blockade, approximately 30% of glucose absorption persisted, suggesting significant paracellular transport, particularly in the proximal intestine [6]. Furthermore, SGLT1 inhibition unexpectedly enhanced mannitol permeability, indicating potential regulation of paracellular pathways [6].
Optimized Experimental Protocols for Transporter Localization
Apical Membrane Isolation and Purity Assessment
Critical Considerations:
- Minimize Basolateral Contamination: Use MgCl2 precipitation method for brush border membrane (BBM) isolation with simultaneous assessment of basolateral marker proteins [13]
- Validate Membrane Purity: Include Western blot analysis for both apical (e.g., sucrase-isomaltase) and basolateral (e.g., Na+/K+ ATPase) markers in all membrane fractions
- Control for Dietary Status: Standardize animal fasting periods (typically 6 hours) and use controlled diets, as SGLT1 expression is regulated by dietary carbohydrates [13]
Detailed Protocol: Brush Border Membrane Isolation
- Euthanize animals and rapidly remove small intestine
- Evert intestine and wash thoroughly in ice-cold Krebs buffer
- Scrape mucosa and homogenize in ice-cold M100 buffer (100 mM mannitol, 2 mM HEPES/Tris, pH 7.4) with protease inhibitors
- Add MgCl2 to 20 mM final concentration and incubate 15 minutes on ice
- Centrifuge at 3,000×g for 15 minutes to remove basolateral membranes and nuclei
- Collect supernatant and centrifuge at 30,000×g for 30 minutes to pellet BBM
- Resuspend BBM pellet in appropriate buffer for downstream applications [13]
Immunohistochemical Localization with Validation Controls
Critical Considerations:
- Antibody Validation: Use knockout tissue as negative controls to confirm antibody specificity [13]
- Fixation Optimization: Test multiple fixation methods (e.g., 10% neutral buffered formalin for 4 hours vs. paraformaldehyde) to preserve antigenicity and membrane integrity [61]
- Cross-contamination Assessment: Include intracellular organelle markers to distinguish true apical localization from subapical vesicles
Detailed Protocol: Immunohistochemical Staining
- Fix intestinal segments in 10% neutral buffered formalin for 4 hours
- Cryoprotect in 20% sucrose in PBS overnight at 4°C
- Embed in OCT compound and section at 5-7 μm thickness
- Perform heat-mediated antigen retrieval with sodium citrate buffer (pH 6.0) for 20 minutes
- Block with appropriate serum (same species as secondary antibody)
- Incubate with primary antibodies (e.g., anti-SGLT1, anti-GLUT2) for 30 minutes at 37°C
- Detect with biotinylated secondary antibodies and streptavidin-conjugated peroxidase with DAB chromogen [61]
- Include controls without primary antibody and with pre-immune serum
Functional Transport Assays with Pharmacological Validation
Critical Considerations:
- Inhibitor Specificity: Use specific SGLT1 inhibitor phlorizin (1 μmol/L) and GLUT2 inhibitor phloretin (1 mmol/L) at established concentrations [6]
- Polarized Application: Apply inhibitors to apical vs. basolateral compartments to determine transporter localization
- Correction for Paracellular Transport: Use [3H]-mannitol or other non-absorbable markers to correct for adherent fluid and paracellular passage [13] [6]
Detailed Protocol: Polarized Glucose Uptake in Perfused Intestine
- Isulate and vascularly perfuse intestinal segments
- Administer radiolabeled glucose (14C-D-glucose) with non-absorbable marker (3H-mannitol)
- Apply specific inhibitors to apical (luminal) or basolateral (vascular) compartments
- Collect venous effluent at timed intervals
- Measure tracer contents in plasma and tissue samples by liquid scintillation counting
- Calculate glucose retention as nmol per cm tissue after correcting for extracellular adherent fluid [13] [6]
Signaling Pathways Regulating Transporter Expression and Localization
Figure 1: Sweet Taste Receptor Signaling Regulates Transporter Expression
Recent evidence indicates that sweet taste receptors and enteric nervous system signaling participate in regulating both SGLT1 and GLUT2 expression [62]. Luminal sweet compounds activate T1R2-T1R3 receptors on enteroendocrine L-cells, stimulating GLP-2 secretion. GLP-2 then activates its receptor on enteric neurons, triggering release of neuropeptides VIP or PACAP. These neuropeptides bind VPAC1 receptors on enterocytes, increasing intracellular cAMP and enhancing transporter mRNA stability and expression [62]. This pathway was demonstrated in wild-type mice where sucralose supplementation increased GLUT2 expression, but not in T1R3 or gustducin knockout mice [62].
Essential Research Reagent Solutions
Table 3: Key Reagents for Transporter Localization and Quantification Studies
| Reagent/Category | Specific Examples | Function/Application | Optimization Tips |
|---|---|---|---|
| Transporter Inhibitors | Phlorizin (SGLT1), Phloretin (GLUT2) | Functional assignment of transport mechanisms | Use at 1 μM phlorizin and 1 mM phloretin; apply to specific membrane domains [6] |
| Radiolabeled Tracers | [14C(U)]-D-glucose, [1-3H(N)]-D-mannitol | Quantifying absorption and correcting for paracellular transport | Use 370 Bq/μl; administer at 4 g/kg body weight glucose bolus [13] |
| Antibodies | Anti-SGLT1, Anti-GLUT2 (validated) | Localization and quantification studies | Validate in knockout tissues; use at 1:1000 dilution for IHC [61] |
| Animal Models | SGLT1-/-, GLUT2-/-, intestine-specific GLUT2-/- | Defining transporter-specific contributions | Maintain on defined diets; SGLT1-/- require glucose-free diet [13] [59] |
| Hormones/Peptides | Ghrelin, GLP-2 | Studying regulatory pathways | Ghrelin facilitates GLUT2, SGLT1, SGLT2 via GHS-R1a receptors [60] |
Integrated Experimental Workflow for Comprehensive Assessment
Figure 2: Comprehensive Transporter Assessment Workflow
This integrated workflow emphasizes the necessity of correlating multiple experimental approaches to achieve accurate transporter localization and quantification. Begin with careful experimental design that controls for dietary status and fasting periods, as these significantly influence transporter expression [13]. Perform membrane isolation with rigorous purity assessment to avoid misinterpretation due to cross-contamination [13]. Conduct localization studies alongside functional assays using specific inhibitors to differentiate transport mechanisms [6]. Finally, analyze relevant signaling pathways that may regulate transporter expression and localization under different experimental conditions [62].
Accurate localization and quantification of intestinal glucose transporters requires meticulous attention to experimental conditions and validation through multiple complementary approaches. The evidence suggests that SGLT1 serves as the primary apical glucose transporter even at high luminal concentrations, while GLUT2 predominantly functions at the basolateral membrane [13]. Claims of apical GLUT2 recruitment may stem from methodological artifacts including membrane contamination, species differences, or dietary variations. Future research should employ polarized experimental systems that maintain epithelial integrity, implement rigorous membrane purity controls, and utilize tissue-specific knockout models to resolve existing controversies. Additionally, emerging evidence of dietary and endocrine regulation of transporter expression underscores the necessity of standardizing nutritional status in experimental designs. By implementing the optimized protocols and validation strategies outlined in this technical guide, researchers can generate more reliable, reproducible data to advance our understanding of intestinal glucose absorption mechanisms and develop more effective therapeutic interventions for metabolic disorders.
This technical guide examines key confounding factors in the study of intestinal glucose transporters, GLUT2 and SGLT1. Aimed at researchers and drug development professionals, it details how hormonal signals and inflammatory states can significantly influence transporter expression and function, which must be accounted for in experimental design and data interpretation.
The absorption of dietary glucose across the intestinal epithelium is a critical process for systemic energy homeostasis, primarily mediated by the coordinated action of two key transporter proteins: the sodium-glucose cotransporter 1 (SGLT1/SLC5A1) on the apical membrane of enterocytes and the facilitative glucose transporter 2 (GLUT2/SLC2A2) on the basolateral membrane [56]. The canonical model posits that glucose is actively transported from the gut lumen into the enterocyte by SGLT1, followed by facilitated diffusion into the bloodstream via GLUT2 [6]. However, the expression, membrane localization, and activity of these transporters are not static. They are subject to complex, dynamic regulation by a multitude of internal and external factors, creating a significant challenge for research reproducibility and therapeutic development. This whitepaper focuses on two major categories of confounding factors: systemic and local hormonal pathways, and inflammatory states induced by conditions or therapeutic agents. A clear understanding of these variables is essential for designing robust experiments, interpreting conflicting data in the literature, and developing targeted therapies for metabolic diseases.
Hormonal Regulation of GLUT2 and SGLT1
Hormones exert profound and diverse effects on intestinal glucose transporters, acting through both genomic and non-genomic pathways. These regulatory mechanisms can introduce substantial variability depending on the endocrine status of a model system.
Sex Hormones: Estrogen Signaling
Estrogen has been identified as a key regulator of glucose transporter expression in the duodenum. A 2025 study demonstrated that estrogen deficiency, induced by ovariectomy in mice, led to a significant reduction in the protein expression of both SGLT1 and GLUT2, resulting in diminished glucose absorption [63] [57]. Conversely, in the human intestinal epithelial cell line SCBN, estrogen treatment upregulated the expression of both transporters.
Mechanistic Insight: The estrogenic effect is primarily mediated by Estrogen Receptor Alpha (ERα), not ERβ. Silencing of ERα in SCBN cells completely reversed the estrogen-induced upregulation of SGLT1 and GLUT2 [63]. The Protein Kinase C (PKC) signaling pathway is a critical downstream component of this regulatory axis [63].
Physiological Correlation: This molecular finding is physiologically relevant. In premenopausal women (aged 20-30), oral glucose tolerance was lower during the premenstrual phase (low estrogen) compared to the preovulatory phase (high estrogen), correlating systemic hormone levels with glucose handling capacity [63].
Table 1: Experimental Summary of Estrogen's Effects on Glucose Transporters
| Experimental Model | Treatment / Condition | Effect on SGLT1 | Effect on GLUT2 | Functional Outcome | Primary Mechanism |
|---|---|---|---|---|---|
| Ovariectomized (OVX) Mice | Estrogen Deficiency | ↓ Expression | ↓ Expression | ↓ Duodenal Glucose Absorption | Reduced ERα/ERβ signaling |
| Human SCBN Cells | Estrogen Treatment | ↑ Expression | ↑ Expression | Not Directly Measured | ERα-dependent, PKC signaling |
| Human Participants (Pre-menstrual) | Low Estrogen Phase | Inferred ↓ | Inferred ↓ | ↓ Oral Glucose Tolerance | Reduced ER-mediated signaling |
Thyroid Hormones
Thyroid hormones are another potent regulator, with a specific focus on SGLT1. Research using T4-treated rats and a genetic mouse model of thyroid hormone resistance (TRβΔ337T knock-in mice) has shown that hyperthyroidism significantly upregulates SGLT1 expression, particularly in the distal (anal) parts of the small intestine [64].
Mechanistic Insight: The small intestine predominantly expresses the thyroid hormone receptor alpha (TRα) subunit. The effect of thyroid hormone on SGLT1 is mediated through this receptor and has a direct impact on postprandial glucose metabolism [64].
Functional Outcome: The functional consequence of this upregulation was demonstrated by the fact that hyperthyroid animals exhibited enhanced postprandial blood glucose levels following an oral glucose load, but not after an intraperitoneal injection, confirming the effect is due to enhanced intestinal absorption rather than altered systemic metabolism [64].
Incretins and Neuro-Endocrine Pathways
The ileal brake mechanism and gut-brain axis also participate in transporter regulation. The sweet taste receptor complex T1R2-T1R3, expressed in enteroendocrine L-cells, senses luminal sugars and sweeteners [62]. This sensing triggers the secretion of Glucagon-Like Peptide-2 (GLP-2), which then acts on the enteric nervous system.
Mechanistic Insight: Enteric neurons release vasoactive intestinal peptide (VIP) or pituitary adenylate cyclase-activating polypeptide (PACAP), which bind to VPAC1 receptors on enterocytes. This signaling cascade increases intracellular cAMP, which stabilizes SGLT1 mRNA, leading to increased SGLT1 expression and activity [62]. Recent evidence confirms that the same T1R2-T1R3 / GLP-2 axis also participates in the transcriptional regulation of GLUT2, as demonstrated in wild-type versus T1R3 and gustducin knockout mouse models [62].
Diagram 1: Sweet taste receptor & incretin signaling pathway for SGLT1/GLUT2 regulation.
Inflammatory States and Pharmacological Agents
Inflammatory conditions and commonly used drugs, particularly corticosteroids, can profoundly alter the intestinal environment and directly modulate glucose transporter expression, presenting a major confounding factor in disease models and clinical studies.
Corticosteroid Modulation
The corticosteroid dexamethasone is a potent anti-inflammatory agent whose use is associated with impaired glucose tolerance and steroid-induced diabetes. Beyond its known effects on hepatic gluconeogenesis and peripheral insulin resistance, dexamethasone directly targets intestinal glucose transporters.
Experimental Findings: In differentiated human Caco-2/TC7 intestinal cell monolayers, dexamethasone treatment dose-dependently increased SGLT1 mRNA expression and functional glucose transport activity [7]. This upregulation was observed despite a concurrent reduction in GLUT2 mRNA, indicating a specific and transporter-specific effect.
Clinical Relevance: This enhanced intestinal glucose absorption capacity likely contributes to the hyperglycaemia observed in patients treated with dexamethasone. Furthermore, given the widespread use of dexamethasone for severe COVID-19, its impact on viral entry receptors in the gut was investigated. The treatment increased the expression of TMPRSS2 while decreasing ACE2, potentially modifying gut susceptibility to viral infection [7].
Table 2: Summary of Dexamethasone Effects on Intestinal Epithelium
| Experimental Model | Target | Effect of Dexamethasone | Implication / Consequence |
|---|---|---|---|
| Human Caco-2/TC7 Cells | SGLT1 | ↑ mRNA & Functional Activity | Contributes to steroid-induced hyperglycaemia |
| Human Caco-2/TC7 Cells | GLUT2 | ↓ mRNA | Distinct regulation from SGLT1 |
| Human Caco-2/TC7 Cells | TMPRSS2 | ↑ mRNA | Potential exacerbation of viral spread in gut |
| Human Caco-2/TC7 Cells | ACE2 | ↓ mRNA & Protein | Altered viral receptor profile |
Essential Experimental Protocols for Controlling Confounds
To ensure reliable and reproducible results in GLUT2 and SGLT1 research, incorporating specific methodological controls is non-negotiable. Below are detailed protocols for key techniques cited in this field.
Using Chamber Assay for Functional Transport
The Using chamber system is the gold standard for ex vivo measurement of active ion and nutrient transport across intact intestinal mucosa.
Detailed Workflow:
- Tissue Preparation: Rapidly isolate a segment of the proximal small intestine (e.g., duodenum) and place it in ice-cold, oxygenated Ringer's solution containing an inhibitor of prostaglandin synthesis (e.g., 1 μM indomethacin) to suppress trauma-induced inflammatory signaling.
- Mucosal Dissection: Open the intestine along the mesenteric border. Using fine dissection tools, carefully remove the external serosal and muscle layers to obtain a sheet of intact mucosa.
- Mounting: Secure the mucosal sheet between the two halves of the Using chamber, which have an effective penetration area (e.g., 0.16 cm²). Use a paraffin O-ring to minimize edge damage.
- Buffering and Oxygenation: Add appropriate physiological buffers (e.g., 10 mL) to both the apical and basolateral reservoirs. Continuously gas the apical side with 100% O₂ and the basolateral side with 95% O₂/5% CO₂ to maintain tissue viability and physiological pH.
- Electrical Measurement: Maintain the tissue under short-circuit conditions (voltage clamped at 0 mV) using a voltage-clamp amplifier. The resulting current required to maintain this voltage (Short-Circuit Current, Isc) is equivalent to the net active ion transport across the epithelium.
- Glucose Stimulation: After obtaining a stable baseline, add D-glucose (e.g., 25 mM) to the apical reservoir. The subsequent sharp increase in Isc represents active, SGLT1-mediated Na⁺-glucose transport.
- Inhibition Studies: To confirm the role of specific transporters, apply specific inhibitors: Phlorizin (e.g., 1 μM) to the apical side to block SGLT1, or Phloretin (e.g., 1 mM) to the basolateral side to block GLUT2 [6].
Vascularly Perfused Rat Intestine Model
This advanced in vitro model preserves the polarity of epithelial cells, the enteroendocrine system, and the vascular outflow, allowing for the sensitive quantification of absorbed substrates and hormone secretion.
Detailed Workflow:
- Surgical Isolation: Anesthetize the rat and surgically isolate a segment of the small intestine with its vascular pedicle (superior mesenteric artery and vein) intact.
- Cannulation and Perfusion: Cannulate the mesenteric artery and vein and initiate vascular perfusion with a warmed, oxygenated, albumin-containing physiological solution. The intestinal lumen is also cannulated and perfused.
- Glucose Tracing: Add a radioactive or fluorescent tracer (e.g., 14C-D-glucose) to the luminal perfusate. This allows for sensitive and accurate quantification of glucose appearance in the vascular effluent.
- Paracellular Transport Assessment: Co-perfuse a non-metabolizable paracellular probe, such as 14C-D-mannitol or 3-O-methyl-D-glucose, to differentiate between transcellular and paracellular glucose absorption routes [6].
- Pharmacological Blockade: Perfuse the vasculature or lumen with specific transporter inhibitors (e.g., Phlorizin for SGLT1, Phloretin for GLUT2) to determine the contribution of each pathway to total glucose absorption [6].
Cell Culture Models (Caco-2/TC7)
The human colorectal adenocarcinoma cell line Caco-2/TC7, when differentiated, forms a polarized monolayer that expresses key intestinal transporters and is a standard model for in vitro transport studies.
Detailed Workflow:
- Culture and Seeding: Maintain Caco-2/TC7 cells in high-glucose DMEM supplemented with fetal bovine serum and non-essential amino acids. Seed cells onto transwell filters at a standardized density (e.g., 0.1 x 10⁵ cells/cm²).
- Differentiation: Culture the cells for at least 21 days post-confluence to allow for full differentiation into an enterocyte-like phenotype. Monitor the formation of tight junctions by regularly measuring transepithelial electrical resistance (TEER).
- Treatment: During the differentiation process, treat cells with the experimental agent (e.g., 5-20 μM Dexamethasone [7]) or vehicle control. Treatment duration can vary from acute (hours) to chronic (several days).
- Uptake Assay: On the day of the experiment, wash the cell monolayers and incubate with a glucose analog like 2-deoxy-D-glucose in the apical compartment for a defined period. Terminate the reaction with ice-cold buffer.
- Analysis: Quantify the transported 2-deoxy-D-glucose in the basolateral compartment or within the cells using scintillation counting or LC-MS/MS. Analyze transporter expression in parallel wells via qPCR or Western blot.
The Scientist's Toolkit: Key Research Reagents
Table 3: Essential Reagents for Investigating GLUT2 and SGLT1 Biology
| Reagent / Tool | Function / Specificity | Example Application | Key Considerations |
|---|---|---|---|
| Phlorizin | High-affinity, competitive inhibitor of SGLT1. | Blocking apical SGLT1-mediated glucose uptake in Using chamber and perfusion studies [6]. | Primarily effective from the apical side. Use at ~1 μM. |
| Phloretin | Broad-spectrum inhibitor of facilitative glucose transporters (GLUTs), including GLUT2. | Inhibiting basolateral glucose efflux in perfused intestine models [6]. | Less specific than Phlorizin; can affect other membrane proteins. |
| 2-Deoxy-D-Glucose | Non-metabolizable glucose analog. | Measuring specific glucose uptake activity in cell culture models (e.g., Caco-2) without interference from metabolism [7]. | Transported by SGLTs and GLUTs but not phosphorylated by hexokinase II. |
| 3-O-Methyl-D-Glucose | Non-metabolizable glucose analog. | Serving as a tracer for transcellular glucose transport in intestinal perfusion studies [10]. | Unlike 2-DG, it is a substrate for GLUTs but not SGLTs. |
| D-Mannitol | Non-metabolizable sugar alcohol. | Paracellular permeability marker in Using chamber and intestinal perfusion experiments [6]. | Assesses tight junction integrity and paracellular flux. |
| SCBN Cell Line | Human intestinal epithelial cell line. | Studying hormonal regulation (e.g., estrogen) of transporter expression and function [63]. | Retains many characteristics of native small intestinal epithelium. |
| Caco-2/TC7 Cell Line | Human colon carcinoma cell line that differentiates into enterocyte-like cells. | Studying drug and cytokine effects on transporter expression (e.g., dexamethasone) [7]. | Requires long (~21-day) culture to fully differentiate. |
| GLP-2 (Agonists) | Gut hormone that upregulates SGLT1 and GLUT2. | Probing the T1R2/T1R3 -> GLP-2 neuro-endocrine pathway in wild-type vs. knockout models [62]. | Effects are often mediated via the enteric nervous system. |
Integrated Signaling Pathways in Hormonal Regulation
The hormonal and pharmacological factors discussed converge on distinct and overlapping intracellular signaling cascades to regulate transporter gene expression, mRNA stability, and membrane trafficking.
Diagram 2: Core signaling pathways regulating SGLT1 and GLUT2 expression.
Comparative Physiology, Clinical Validation, and Emerging Roles
The sodium-glucose cotransporter 1 (SGLT1) has traditionally been recognized for its fundamental role in intestinal glucose absorption. Emerging evidence now positions SGLT1 as a critical nutrient sensor that directly regulates the secretion of incretin hormones, primarily glucose-dependent insulinotropic polypeptide (GIP) and glucagon-like peptide-1 (GLP-1). This whitepaper synthesizes current research demonstrating how SGLT1-mediated glucose transport initiates signaling cascades that trigger incretin release, a function distinct from its absorptive capacity. We examine the molecular mechanisms underlying SGLT1's sensory function, contrast it with the proposed roles of GLUT2, and discuss therapeutic implications for metabolic disorders. The evidence positions SGLT1 inhibition as a promising strategy for enhancing endogenous incretin secretion through nutrient retention in the distal intestine.
The classical model of intestinal glucose absorption identifies SGLT1 as the primary mediator of apical glucose uptake into enterocytes, particularly at low luminal glucose concentrations [20]. This transporter couples glucose transport against its concentration gradient with sodium ion import, requiring energy expenditure for function [26]. For decades, research focused predominantly on this absorptive function, while GLUT2 was considered primarily responsible for basolateral glucose exit from enterocytes into circulation [13].
The paradigm shift began with observations that SGLT1 substrates stimulated incretin hormone secretion even when not metabolized, suggesting a sensory function distinct from metabolism [65]. Subsequent knockout mouse studies provided definitive evidence that SGLT1 is indispensable for glucose-induced incretin secretion, while GLUT2 appears to play a minimal role in this process [13]. This sensory function positions SGLT1 as a therapeutic target for manipulating endogenous incretin secretion, potentially offering novel approaches for managing type 2 diabetes and obesity.
Table 1: Key Characteristics of Intestinal Glucose Transporters
| Transporter | Primary Function | Glucose Affinity | Sodium Dependence | Role in Incretin Secretion |
|---|---|---|---|---|
| SGLT1 | Apical glucose uptake | High (K₀.₅: 0.5-2 mM) [26] | Yes (2:1 Na⁺:Glucose) [26] | Critical mediator [13] |
| GLUT2 | Basolateral glucose exit | Low (Kₘ: 20-40 mM) [20] | No | Minimal role [13] |
Molecular Mechanisms of SGLT1-Mediated Sensing
SGLT1 Expression and Localization in Enteroendocrine Cells
SGLT1 is expressed not only in absorptive enterocytes but also in specific enteroendocrine cell populations throughout the small intestine. These include K-cells that secrete GIP in the proximal intestine and L-cells that secrete GLP-1 in the distal intestine [65]. The presence of SGLT1 in these specialized endocrine cells provides the anatomical basis for its sensory function, allowing direct detection of luminal glucose concentrations.
The molecular identity of SGLT1 includes key structural features essential for its dual roles. Human SGLT1 is a 664-amino acid protein with 14 transmembrane α-helical domains and a glucose-binding domain comprising amino acid residues 457-460 [26]. This structure enables both efficient transport and potential signaling functions through conformational changes during the transport cycle.
Signaling Pathways Activated by SGLT1 Transport
The mechanism by which SGLT1 activation triggers incretin secretion involves several interconnected signaling pathways:
Electrochemical Gradient Changes: SGLT1-mediated sodium cotransport alters the intracellular electrochemical environment, potentially affecting membrane potential and activating voltage-gated calcium channels [65].
Secondary Messenger Systems: SGLT1 activity has been linked to activation of the cAMP/CREB-dependent pathway, which regulates SGLT1 expression and potentially incretin gene transcription [66].
Metabolic Sensor Interplay: SGLT1 function intersects with sweet taste receptor (STR) signaling pathways, as both systems can upregulate SGLT1 expression and potentiate GLP-1 secretion [65].
The following diagram illustrates the key signaling pathways involved in SGLT1-mediated incretin secretion:
Experimental Evidence: Establishing SGLT1 as a Key Sensor
Knockout Mouse Studies
Definitive evidence for SGLT1's critical role in incretin secretion comes from knockout mouse models. Studies comparing SGLT1-deficient (sglt1-/-) mice with wild-type and GLUT2-deficient animals revealed striking findings:
- SGLT1 knockout mice exhibited drastically reduced tissue retention of tracer glucose throughout the entire small intestine after radiolabeled glucose gavage [13].
- Glucose-induced GIP and GLP-1 secretion was completely abolished in SGLT1-deficient mice [13].
- In contrast, GLUT2-deficient animals showed higher tracer glucose contents in intestinal tissues than wild-type animals and maintained normal glucose-induced incretin secretion [13].
- Blood glucose elevations following glucose gavage were significantly reduced in SGLT1 knockout mice, demonstrating the transporter's dominance in intestinal glucose absorption [13].
Table 2: Incretin and Metabolic Responses in Transporter Knockout Models
| Parameter | SGLT1 -/- Mice | GLUT2 -/- Mice | Wild-Type Mice |
|---|---|---|---|
| Glucose-induced GIP secretion | Abolished [13] | Unimpaired [13] | Normal |
| Glucose-induced GLP-1 secretion | Abolished [13] | Unimpaired [13] | Normal |
| Intestinal glucose uptake | Drastically reduced [13] | Higher than wild-type [13] | Normal |
| Post-gavage blood glucose | Reduced [13] | Impaired insulin secretion [13] | Normal |
Pharmacological Inhibition Studies
Complementary evidence comes from studies using selective SGLT1 inhibitors, which reproduce the incretin secretion deficits observed in genetic models:
- SGL5213, a potent intestinal SGLT1 inhibitor, suppressed glucose absorption and enhanced plasma GLP-1 and GLP-2 secretion in rats by allowing unabsorbed glucose to reach distal L-cells [67].
- Phlorizin, a competitive SGLT1 antagonist, abolished glucose-induced GLP-1 release in human ileal samples [65].
- Replacement of extracellular sodium with N-methyl-D-glucamine (which eliminates SGLT1 function) similarly abolished GLP-1 secretion in human intestinal tissues [65].
These pharmacological studies demonstrate that SGLT1 transport activity is directly coupled to incretin secretion rather than merely correlative.
Methodological Approaches for Studying SGLT1 Function
Experimental Protocols for Assessing SGLT1-Mediated Incretin Secretion
Glucose Gavage with Radiolabeled Tracers
- Procedure: Mice are fasted for 6 hours before receiving an intragastric glucose bolus (4 g/kg body weight) combined with [¹⁴C]-D-glucose and [³H]-D-mannitol (to correct for extracellular fluid phase) [13].
- Tissue Processing: After 15 minutes, animals are euthanized, and the small intestine is everted and washed in ice-cold Krebs buffer [13].
- Measurement: Defined 1-cm intestinal segments are analyzed for incorporated radioactivity, calculating glucose retention as nmol per cm tissue over 15 minutes [13].
Brush Border Membrane (BBM) Isolation and Western Blot Analysis
- BBM Isolation: Mucosa is scraped and homogenized in M100 buffer (100 mM mannitol, 2 mM HEPES/Tris, pH 7.4) with protease inhibitors [13].
- MgCl₂ Precipitation: Homogenates are incubated with MgCl₂ (20 mM final concentration) for 15 minutes, followed by low-speed centrifugation (3000×g, 15 minutes) [13].
- Membrane Fractionation: Supernatants are subjected to high-speed centrifugation to pellet BBM vesicles for transporter quantification [13].
Hormone Secretion Assays
- Blood Collection: Blood is collected from the vena cava inferior in EDTA tubes with DPP-IV inhibitor to prevent incretin degradation [13].
- Hormone Measurement: Total GIP is determined with rat/mouse total GIP ELISA kit; active GLP-1 is measured using high sensitivity GLP-1 active chemiluminescent ELISA kit [13].
The following diagram illustrates the experimental workflow for investigating SGLT1 function:
The Scientist's Toolkit: Essential Research Reagents
Table 3: Key Research Reagents for Studying SGLT1 Function
| Reagent/Category | Specific Examples | Function/Application |
|---|---|---|
| SGLT1 Inhibitors | Phlorizin, SGL5213, KGA-2727, Mizagliflozin [67] | Competitive inhibition of SGLT1; study of transport-independent functions |
| Animal Models | SGLT1 -/- mice (C57BL/6 background) [13] | Genetic evidence for SGLT1 necessity in incretin secretion |
| Radiolabeled Tracers | [¹⁴C(U)]-D-glucose, [¹-³H(N)]-D-Mannitol [13] | Quantitative measurement of glucose uptake and distribution |
| Hormone Assays | GIP ELISA, GLP-1 active chemiluminescent ELISA [13] | Precise quantification of incretin secretion |
| BBM Isolation Reagents | M100 buffer, MgCl₂, protease inhibitors [13] | Isolation of apical membranes for transporter quantification |
Contrasting Roles: SGLT1 vs. GLUT2 in Intestinal Glucose Sensing
The prevailing model that GLUT2 recruitment to the apical membrane contributes significantly to intestinal glucose absorption at high luminal concentrations has been challenged by recent evidence. While some studies proposed that GLUT2 can be recruited to the brush border membrane after a high luminal glucose bolus to allow bulk absorption [13], knockout mouse studies tell a different story:
- GLUT2-deficient animals exhibited higher, not lower, tracer glucose contents in intestinal tissues than wild-type animals [13].
- Glucose-induced incretin secretion remained completely intact in GLUT2 knockout mice [13].
- Western blot analysis of apical membrane fractions revealed that detected GLUT2 primarily resulted from contamination with basolateral membranes rather than authentic apical insertion [13].
These findings suggest that SGLT1 is unequivocally the prime intestinal glucose transporter even at high luminal glucose concentrations, and question the physiological significance of apical GLUT2 in intestinal glucose absorption or sensing.
Therapeutic Implications and Future Directions
SGLT1 Inhibition for Enhancing Incretin Secretion
Paradoxically, inhibiting SGLT1 in the proximal intestine represents a promising strategy for enhancing GLP-1 secretion. By delaying glucose absorption, SGLT1 inhibitors allow more glucose to reach distal intestinal L-cells, which then stimulates GLP-1 secretion via SGLT1 receptors in these regions [67]. This mechanism underlies the therapeutic potential of:
- Selective SGLT1 inhibitors like mizagliflozin, developed for chronic constipation and potentially for diabetes [67].
- Dual SGLT1/2 inhibitors like sotagliflozin, which blocks renal glucose reabsorption while modulating intestinal glucose sensing [26].
- Low-absorbable SGLT1 inhibitors like SGL5213, which act primarily within the intestinal lumen without significant systemic effects [67].
Integration with Entero-Pancreatic Hormone Therapeutics
The understanding of SGLT1's sensory function complements the development of entero-pancreatic hormone-based therapies. GLP-1 receptor agonists have established efficacy in obesity and type 2 diabetes, with newer agents like tirzepatide (dual GLP-1/GIP receptor agonist) and retatrutide (GLP-1/GIP/glucagon receptor agonist) showing enhanced efficacy [68]. Manipulating endogenous incretin secretion through SGLT1 modulation may provide an alternative or complementary approach to receptor activation.
SGLT1 serves a dual role in intestinal physiology—as the primary transporter for apical glucose uptake and as a critical sensor that directly regulates incretin hormone secretion. The experimental evidence from knockout models and pharmacological studies consistently demonstrates that SGLT1, not GLUT2, is indispensable for glucose-induced GIP and GLP-1 secretion. This sensory function, coupled with its absorptive capacity, positions SGLT1 as a strategic therapeutic target for metabolic disorders. Future research should focus on tissue-specific SGLT1 modulation and its integration with other entero-pancreatic hormone therapies to optimize metabolic outcomes.
The sodium-glucose cotransporters (SGLTs) are integral membrane proteins responsible for the active uptake of glucose against its concentration gradient by harnessing the energy from sodium ion movement. Within the SLC5A gene family, SGLT1 and SGLT2 play distinct and critical roles in systemic glucose homeostasis, functioning as key gatekeepers in the intestine and kidney, respectively. Their coordinated action ensures efficient nutrient absorption and conservation, maintaining plasma glucose within narrow limits (4–10 mmol/L) [19]. Understanding the comparative biology of these transporters is fundamental to gastrointestinal physiology and has proven pivotal for developing targeted therapies for metabolic diseases like type 2 diabetes [42] [19].
This analysis directly contextualizes intestinal SGLT1 within the broader framework of glucose transporter research, particularly its partnership with the facilitative glucose transporter GLUT2. In the enterocyte, SGLT1 mediates the critical initial step of apical glucose uptake, which is a primary determinant of postprandial blood glucose levels [20] [46]. The mechanism of glucose absorption in the small intestine involves SGLT1 in the apical membrane of enterocytes and GLUT2 in the basolateral membrane [6]. Recent research continues to refine our understanding of this partnership and its regulation in health and disease [10] [23].
Comparative Transporter Profiles: Function, Kinetics, and Localization
The functional properties, kinetic parameters, and tissue-specific localization of SGLT1 and SGLT2 define their unique physiological contributions.
Table 1: Functional and Kinetic Properties of SGLT Transporters
| Parameter | Intestinal SGLT1 | Renal SGLT1 | Renal SGLT2 |
|---|---|---|---|
| Primary Tissue | Small Intestine (Enterocytes) [19] | Kidney (Proximal Tubule S3 segment) [19] | Kidney (Proximal Tubule S1/S2 segments) [19] |
| Physiological Role | Dietary glucose absorption [20] | "Mop up" residual glucose after SGLT2 reabsorption [19] | Reabsorb ~90% of filtered glucose load [19] |
| Apparent Glucose Km | ~2 mmol/L (High Affinity) [19] | ~2 mmol/L (High Affinity) [19] | ~5 mmol/L (Low Affinity) [19] |
| Na+:Glucose Coupling | 2:1 [19] | 2:1 [19] | 1:1 [19] |
| Inhibitor Example | Phlorizin [6] | Phlorizin [19] | Phlorizin; Canagliflozin, Dapagliflozin [42] |
Table 2: Quantitative Contributions to Glucose Absorption and Reabsorption
| Transporter | Contribution to Total Glucose Handling | Impact of Pharmacological Blockade |
|---|---|---|
| Intestinal SGLT1 | Major pathway for dietary glucose absorption [20]. At 100 mmol/L luminal glucose, SGLT1 blockade reduces absorption by ~60% [6]. | Combined luminal SGLT1 and GLUT2 blockade leaves ~30% of glucose absorption intact, suggesting a paracellular pathway [6]. |
| Renal SGLT2 | Reabsorbs the majority (~90%) of the filtered glucose load [19]. | SGLT2 inhibitors (e.g., Canagliflozin) increase urinary glucose excretion and lower blood glucose [42]. |
| Renal SGLT1 | Reabsorbs the remaining ~10% of filtered glucose [19]. | Dual SGLT1/SGLT2 inhibition (e.g., Sotagliflozin) may offer enhanced efficacy by targeting both renal and intestinal pathways [42]. |
The distribution of these transporters along the nephron is highly specialized. SGLT2 is exclusively located in the early proximal tubule (S1 and S2 segments), which is characterized by a high capacity but lower affinity for glucose. In contrast, renal SGLT1 is restricted to the later S3 segment, where its high affinity allows for the efficient reabsorption of the remaining glucose that escapes SGLT2 [19]. In the intestine, SGLT1 is abundantly expressed in the brush border membrane of enterocytes along the length of the small intestine, though its activity can be segmentally regulated by feeding status [23]. GLUT2 completes the transcellular journey by facilitating glucose exit from the enterocyte into the blood, a process critical for completing absorption [20].
Molecular Mechanisms and Regulatory Pathways
The function and expression of SGLT1 and SGLT2 are subject to complex regulatory controls, which differ between the intestine and kidney.
Intestinal SGLT1 Regulation
Intestinal SGLT1 is regulated by both short-term and long-term mechanisms to adapt to dietary intake. Long-term regulation involves changes in gene expression. For instance, a high-glucose diet can increase SGLT1 expression [20]. Furthermore, endocrine factors play a significant role; the adipose-tissue-derived secretome (ADS) in obesity has been shown to stimulate SGLT1 activity in intestinal epithelial cells by increasing the transporter's affinity for glucose through altered phosphorylation, without changing its protein expression levels [46]. Short-term regulation is also crucial. Intracellular signaling pathways involving Ca²⁺ and cAMP have been demonstrated to modulate ileal SGLT1-mediated glucose uptake, with Ca²⁺ signaling supporting and cAMP signaling potentially inhibiting transport activity [10].
Diagram 1: Intestinal SGLT1 Regulation. SGLT1 mediates active glucose uptake, regulated by Ca²⁺ and cAMP signaling.
Renal SGLT1 and SGLT2 Regulation
In the kidney, the reabsorption of glucose is a concerted effort between SGLT2 and SGLT1. The primary regulation is flow-dependent and determined by the filtered glucose load. The high-capacity SGLT2 in the early proximal tubule reabsorbs the bulk of glucose, while the high-affinity SGLT1 in the distal proximal tubule recovers the remainder. This sequential model ensures maximal efficiency and minimizes urinary glucose loss under normal physiological conditions [19]. The distinct stoichiometry of these transporters also has physiological implications; the 2:1 Na+:glucose coupling of SGLT1 results in a greater electrogenic response compared to the 1:1 coupling of SGLT2 [19].
Diagram 2: Renal Glucose Handling. SGLT2 and SGLT1 work sequentially to reabsorb filtered glucose.
Key Experimental Models and Methodologies
Research into the distinct functions of SGLT1 and SGLT2 relies on a suite of well-established experimental models and techniques.
The Scientist's Toolkit: Key Research Reagents and Models
Table 3: Essential Reagents and Models for SGLT Research
| Tool / Model | Function / Application | Key Findings Enabled |
|---|---|---|
| Phlorizin | Potent, non-selective SGLT inhibitor [6] [19]. | Established proof-of-concept that inhibiting renal glucose reabsorption lowers blood glucose [19]. |
| Phloretin | GLUT2 inhibitor [6]. | Used to dissect the contribution of GLUT2 to basolateral glucose efflux and putative apical uptake [6]. |
| SGLT2 Inhibitors (Gliflozins) | Selective SGLT2 antagonists (e.g., Canagliflozin, Dapagliflozin) [42]. | Demonstrated cardiorenal benefits and validated SGLT2 as a therapeutic target in T2D [42]. |
| Knockout Mouse Models | Genetic deletion of Sglt1, Sglt2, or Glut2 genes [19]. | Elucidated non-redundant physiological roles; SGLT1 is essential for intestinal absorption [19]. |
| Isolated Perfused Rat Intestine | In vitro model preserving epithelial polarity and vascular supply [6]. | Identified paracellular glucose transport and interactive regulation between SGLT1 and GLUT2 [6]. |
| Ussing Chamber | In vitro technique to measure ion and nutrient transport across epithelial tissues [10] [23]. | Revealed segment-specific (jejunum vs. ileum) regulation of SGLT1 activity by fasting/feeding [23]. |
| Caco-2/TC7 Cells | Differentiated human intestinal epithelial cell model [7]. | Studied drug and hormone effects (e.g., dexamethasone) on human SGLT1 expression and function [7]. |
Detailed Experimental Protocol: Glucose Absorption in the Isolated, Vascularly Perfused Rat Intestine
The isolated, vascularly perfused rat intestine model is a sophisticated ex vivo preparation that allows for the precise study of glucose absorption kinetics and pathways while maintaining tissue integrity and polarity [6].
Methodology:
- Tissue Preparation: A segment of the rat small intestine is surgically isolated while preserving its vascular connections. The intestine is cannulated and transferred to a perfusion chamber maintained at 37°C.
- Luminal and Vascular Perfusion: The intestinal lumen is perfused with a solution containing glucose at varying concentrations (e.g., from 55 mmol/L to 1100 mmol/L). Simultaneously, the mesenteric artery is perfused with an oxygenated, blood-free physiological salt solution containing a red cell substitute like albumin.
- Tracer Use and Sampling: The luminal perfusate contains radioactively labeled 14C-D-glucose to trace the absorptive flux. The venous effluent is collected at timed intervals.
- Quantification: The appearance of 14C-D-glucose in the venous effluent is quantified using scintillation counting, providing a sensitive and accurate measure of glucose absorption rates.
- Pharmacological Blockade: To dissect the contribution of specific transporters, inhibitors are added to the perfusates. Phlorizin (e.g., 1 μmol/L) is added to the luminal perfusate to block SGLT1, while phloretin (e.g., 1 mmol/L) is added to the vascular perfusate to block GLUT2.
- Paracellular Transport Assessment: 14C-D-mannitol, a marker for paracellular permeability, is often co-infused to assess the contribution of the paracellular route to total glucose absorption.
Key Applications:
- Kinetic Studies: This model demonstrated that glucose absorption does not saturate even at very high luminal concentrations (1100 mmol/L), suggesting the involvement of diffusive mechanisms beyond the saturable SGLT1 pathway [6].
- Pathway Dissection: Experiments using phlorizin showed that SGLT1 mediates approximately 60-70% of glucose absorption at 100 mmol/L luminal glucose. The remaining absorption is mediated by other pathways, including a phloretin-sensitive component (potentially apical GLUT2) and a significant paracellular component (~30% after combined SGLT1/GLUT2 blockade) [6].
- Regulatory Discovery: A key finding from this model was that blocking SGLT1 with phlorizin unexpectedly led to a marked increase in mannitol absorption, suggesting that SGLT1 activity may play a role in regulating tight junction permeability and paracellular transport [6].
Diagram 3: Isolated Perfused Intestine Workflow. Key experimental steps for studying glucose absorption pathways.
Implications for Drug Development and Therapeutic Targeting
The distinct functional profiles of intestinal and renal SGLTs have been successfully leveraged for therapeutic purposes. SGLT2 inhibitors (gliflozins) have become a cornerstone in the treatment of type 2 diabetes. By selectively blocking SGLT2 in the kidney, they promote urinary glucose excretion (UGE), thereby lowering plasma glucose levels independently of insulin [42]. Their efficacy is underscored by significant cardiorenal benefits, including reduced risk of hospitalization for heart failure and progression of chronic kidney disease, as demonstrated in large-scale outcome trials [42].
The role of intestinal SGLT1 presents another potential therapeutic avenue. Inhibiting SGLT1 could blunt the postprandial rise in blood glucose by reducing dietary glucose absorption. The dual SGLT1/SGLT2 inhibitor sotagliflozin was developed to target both pathways simultaneously, although its current FDA approval is for heart failure risk reduction rather than glycemic control [42]. Research also indicates that in obesity, the adipose tissue-derived secretome uniquely enhances SGLT1 affinity for glucose, potentially exacerbating hyperglycemia—a finding that highlights intestinal SGLT1 as a relevant target in metabolic disease [46]. Furthermore, dietary interventions, such as oat β-glucan, have been shown to depress SGLT1- and GLUT2-mediated glucose transport, offering non-pharmacological strategies for managing blood glucose [47].
SGLT1 in the intestine and SGLT1/SGLT2 in the kidney, while members of the same transporter family, have evolved specialized roles essential for maintaining glucose homeostasis. Intestinal SGLT1 serves as the primary gatekeeper for dietary glucose entry, is highly regulated by nutrients and hormones, and operates in concert with GLUT2. In contrast, the renal system employs a high-capacity, low-affinity transporter (SGLT2) for bulk reabsorption, followed by a high-affinity transporter (SGLT1) for final recovery. This comparative analysis underscores that their distinct kinetic properties, regional localization, and regulatory mechanisms define their unique contributions to physiology and their value as discrete therapeutic targets. Continued research into their regulation and interaction with other transport systems, like GLUT2, will further illuminate the complex control of glucose flux and identify new opportunities for treating metabolic disorders.
The validation of therapeutic targets represents a critical pathway in modern drug development, particularly for complex metabolic diseases such as diabetes mellitus. This whitepaper examines the validation trajectory of intestinal glucose transporters SGLT1 and GLUT2 as therapeutic targets, exploring the continuum from genetic deficiency studies to clinical drug outcomes. Within the broader context of intestinal glucose absorption research, we analyze how natural genetic variations, pharmacological interventions, and molecular signaling pathways have converged to validate these transporters as legitimate targets for managing hyperglycemia. The comprehensive assessment of experimental evidence and clinical translation frameworks provided herein offers researchers and drug development professionals a validated roadmap for target assessment in metabolic disease therapeutics.
Glucose absorption in the small intestine represents a critical gateway for maintaining systemic glucose homeostasis, with the coordinated activity of sodium-glucose cotransporter 1 (SGLT1/SLC5A1) and glucose transporter 2 (GLUT2/SLC2A2) serving as the principal molecular machinery for transepithelial glucose transport [56] [10]. The established model involves SGLT1-mediated active transport of glucose across the apical membrane of enterocytes, coupled with sodium influx, followed by GLUT2-mediated facilitative diffusion across the basolateral membrane into the circulation [56] [4]. These transporters exhibit complementary functions but distinct regulatory mechanisms, with SGLT1 demonstrating high affinity for glucose (Km ≈ 2 mM) while GLUT2 exhibits lower affinity (Km ≈ 17 mM) but higher capacity [4] [69].
Beyond their fundamental physiological roles, SGLT1 and GLUT2 have emerged as significant therapeutic targets for managing diabetes and related metabolic disorders. The validation pathway for these targets has traversed multiple evidence streams, from observations of natural genetic deficiencies to deliberate pharmacological interventions in clinical populations. This whitepaper examines the comprehensive validation framework for these transporters, incorporating genetic, physiological, pharmacological, and clinical evidence that has established their therapeutic relevance.
Table 1: Fundamental Characteristics of Intestinal Glucose Transporters
| Parameter | SGLT1 (SLC5A1) | GLUT2 (SLC2A2) |
|---|---|---|
| Transport Mechanism | Secondary active transport (Na+-coupled) | Facilitative diffusion |
| Cellular Localization | Apical membrane of enterocytes | Basolateral membrane of enterocytes |
| Glucose Affinity (Km) | ~2 mM | ~17 mM |
| Primary Regulation | Transcriptional, post-translational | Membrane trafficking, transcriptional |
| Additional Substrates | Galactose | Fructose, galactose, mannose |
Genetic and Physiological Validation Evidence
Insights from Genetic Deficiency States
Natural genetic deficiencies in both SGLT1 and GLUT2 have provided compelling evidence for their non-redundant physiological functions and validated their potential as therapeutic targets. In humans, congenital mutations in the SGLT1 gene result in glucose-galactose malabsorption (GGM), a disorder characterized by life-threatening watery diarrhea that manifests within days of birth [69]. This severe phenotype demonstrates the indispensable role of SGLT1 in intestinal glucose absorption and the limited compensatory capacity of alternative transport mechanisms under normal physiological conditions.
Similarly, studies of GLUT2 genetic deficiencies have revealed its critical role in glucose homeostasis. In Fanconi-Bickel syndrome, caused by mutations in the GLUT2 gene, patients exhibit impaired glucose transport alongside hepatorenal glycogen accumulation, galactose intolerance, and characteristic fanconi renal tubulopathy [4] [62]. Research in genetically modified mouse models has further elucidated the consequences of GLUT2 deficiency, with homozygous GLUT2 knockout mice displaying hyperglycemia, relative hypo-insulinemia, elevated free fatty acids, and failure to survive after weaning [4]. These genetic evidence streams collectively validate both transporters as essential components of systemic glucose homeostasis with non-overlapping functions.
Dynamic Regulation and Adaptive Responses
Beyond constitutive functions, both transporters exhibit dynamic regulation that further supports their relevance as modifiable therapeutic targets. GLUT2 demonstrates particularly interesting adaptive regulation, with studies revealing its translocation from basolateral to apical membranes under high luminal glucose conditions (>30 mM) to assist SGLT1 with glucose uptake [6] [10]. This redistribution represents a physiological adaptation to enhance absorptive capacity and indicates the potential for pharmacological modulation.
The regulation of these transporters involves complex signaling networks, including sweet taste receptors (T1R2/T1R3) and enteric nervous system participation. Recent research demonstrates that "luminal sweet sensing via T1R2-T1R3 and the enteroendocrine-derived GLP-2 are constituents of the regulatory pathway controlling GLUT2 expression" [62]. Similarly, SGLT1 expression is regulated through a pathway involving sweet taste receptor activation, GLP-2 secretion, enteric neuron activation, and neuropeptide release that stabilizes SGLT1 mRNA [62]. These sophisticated regulatory mechanisms highlight the potential for targeted interventions at multiple points in the signaling cascade.
Pharmacological Intervention Studies
Inhibitor Studies Elucidating Transport Mechanisms
Pharmacological inhibition studies have provided critical evidence validating the functional contributions of SGLT1 and GLUT2 to intestinal glucose absorption. Quantitative investigations using specific inhibitors have revealed the proportional contributions of various transport pathways, with implications for therapeutic targeting.
Table 2: Glucose Absorption Inhibition Profiles with Specific Transport Blockers
| Experimental Condition | Glucose Concentration | Remaining Absorption | Inference |
|---|---|---|---|
| SGLT1 blockade (phlorizin) | 100 mM | ~40% | SGLT1-independent pathways account for significant absorption |
| GLUT2 blockade (phloretin) | 100 mM | ~30% | GLUT2 essential for bulk of transcellular transport |
| Combined SGLT1 + GLUT2 blockade | 100 mM | ~30% | Paracellular pathway contributes substantially at high concentrations |
| SGLT1 blockade | 10 mM | ~30% | SGLT1 dominance at lower glucose concentrations |
In vascularly perfused rat intestine models, SGLT1 blockade with phlorizin reduced glucose absorption by approximately 60% at 100 mM luminal glucose concentration, while GLUT2 blockade with phloretin reduced absorption by approximately 70% at the same concentration [6]. Notably, even after combined SGLT1 and GLUT2 blockade, approximately 30% of glucose absorption remained, indicating significant contribution from paracellular pathways particularly in the proximal intestine [6]. These findings demonstrate both the primacy of transcellular transport and the potential limitations of targeting only one transport pathway.
Regional Specialization and Therapeutic Implications
The intestinal tract exhibits remarkable regional specialization in glucose transport mechanisms that carries significant implications for therapeutic targeting. Using chamber studies comparing different intestinal segments have revealed that "the distal ileum showed more pronounced glucose absorption via SGLT1" compared to duodenum and proximal jejunum [10]. This finding challenges conventional assumptions that glucose absorption occurs primarily in proximal segments and suggests potential compensatory mechanisms in distal segments that might be leveraged therapeutically.
The regional differences extend to regulatory mechanisms as well, with research demonstrating that "active glucose transport in the ileum is differentially regulated by intracellular Ca2+ and cAMP signaling" [10]. Specifically, activation of the 5-HT4R-cAMP-PKA pathway reduces ileal glucose uptake, while ileal SGLT1-mediated glucose uptake requires both intracellular and extracellular Ca2+ [10]. This regional specialization in regulatory mechanisms presents opportunities for segment-specific targeting that might maximize therapeutic effects while minimizing systemic consequences.
Experimental Models and Methodologies
Key Experimental Platforms for Transport Studies
The validation of SGLT1 and GLUT2 as therapeutic targets has relied on multiple experimental platforms, each offering distinct advantages for elucidating specific aspects of transporter biology. Isolated, vascularly perfused rat intestine preparations have proven particularly valuable for preserving the "polarity of the epithelial cells as well as the entire transport pathways" while ensuring adequate vascular perfusion of the mucosa [6]. This model maintains physiological relevance while permitting controlled experimental interventions.
Differentiated human Caco-2/TC7 intestinal cell monolayers have emerged as a standard in vitro model for human-relevant transport studies, particularly for pharmaceutical applications [7]. These cultures develop differentiated enterocyte characteristics and polarized transporter localization, enabling investigation of human-specific regulatory mechanisms. Complementary to these approaches, Ussing chamber experiments using intact intestinal tissues provide robust measurement of electrogenic transport processes and regional specialization [10].
Signaling Pathway Elucidation
The comprehensive understanding of SGLT1 and GLUT2 regulation has required meticulous mapping of the signaling pathways controlling their expression and activity. Research has revealed that sweet taste receptors (T1R2/T1R3) on enteroendocrine L-cells sense luminal sugars and sweeteners, triggering GLP-2 secretion [62]. This hormone then activates enteric neurons to release vasoactive intestinal peptide (VIP) or pituitary adenylate cyclase-activating polypeptide (PACAP), which ultimately stabilize SGLT1 mRNA and enhance transporter expression [62].
Diagram 1: Sweet Taste Receptor Signaling Pathway Regulating SGLT1 and GLUT2
Recent investigations have further established that the same T1R2-T1R3 and GLP-2 signaling pathway participates in regulating intestinal GLUT2 expression, demonstrating coordinated regulation of both transporters through common sensing mechanisms [62]. This coordinated regulation presents both challenges and opportunities for therapeutic intervention, as targeting upstream regulators might modulate both transport systems simultaneously.
The Scientist's Toolkit: Key Research Reagents
Target validation research for SGLT1 and GLUT2 has depended on a specialized toolkit of pharmacological agents, experimental models, and methodological approaches. The table below summarizes essential research reagents and their applications in intestinal glucose transport studies.
Table 3: Essential Research Reagents for Intestinal Glucose Transport Studies
| Reagent/Cell Line | Key Application | Experimental Utility |
|---|---|---|
| Phlorizin | Selective SGLT1 inhibition | Discriminates SGLT1-mediated transport; IC50 ~7 nM for SGLT1 |
| Phloretin | GLUT2 inhibition | Blocks facilitative glucose transport; used at 1 mM concentration |
| Caco-2/TC7 cells | Human intestinal model | Differentiated enterocytes expressing native SGLT1/GLUT2 |
| 14C-D-glucose | Glucose tracer | Sensitive quantification of absorptive fluxes |
| 3-O-methyl-d-glucose | Non-metabolizable analog | Measures transport independently of metabolism |
| D-glucose (25 mM) | SGLT1 activation standard | Induces short-circuit current (Isc) in Ussing chambers |
| GLP-2 | Endocrine regulator | Probes transporter regulation via hormonal pathways |
| T1R2-T1R3 agonists | Sweet receptor activation | Investigates nutrient-sensing pathways |
Clinical Translation and Therapeutic Outcomes
From Target Validation to Clinical Applications
The transition from target validation to clinical therapeutics has been most prominently demonstrated by the development and success of SGLT inhibitors as a novel class of antidiabetic medications. The natural product phlorizin, a non-selective SGLT inhibitor, served as the foundational compound that established the therapeutic principle of blocking renal glucose reabsorption to promote glycosuria and reduce hyperglycemia [70] [69]. However, its clinical utility was limited by poor oral bioavailability and non-selectivity.
The development of selective SGLT2 inhibitors (gliflozins) represented a strategic refinement based on the understanding that SGLT2 mediates the majority (~90%) of renal glucose reabsorption in the proximal tubule [69]. These agents, including dapagliflozin, empagliflozin, and canagliflozin, demonstrate 200- to 3000-fold selectivity for SGLT2 over SGLT1, optimizing the glucose-lowering effect while minimizing gastrointestinal side effects associated with SGLT1 inhibition [70] [69]. The clinical success of these agents has validated the fundamental premise that modulating glucose transporter activity can effectively manage hyperglycemia in diabetes.
Emerging Therapeutic Strategies
Building on the success of selective SGLT2 inhibitors, more recent therapeutic strategies have explored dual SGLT1/SGLT2 inhibition to leverage potential complementary benefits. Sotagliflozin, a dual SGLT1/SGLT2 inhibitor, demonstrates balanced activity against both transporters (IC50 of 1.8 nM for SGLT2 and 20 nM for SGLT1) and has shown efficacy in type 1 diabetes management [70]. The dual inhibition approach theoretically combines the postprandial glucose control benefits of intestinal SGLT1 blockade with the sustained glycemic control from renal SGLT2 inhibition.
Beyond diabetes applications, research has identified additional regulatory mechanisms that might be leveraged therapeutically. Studies have shown that dexamethasone "dose-dependently increased glucose transport by upregulating SGLT1 mRNA" in intestinal epithelial cells [7], providing insights into the mechanisms underlying steroid-induced hyperglycemia and potential intervention points. Similarly, investigations have revealed that in obesity, the "adipose tissue secretome stimulates SGLT1 in intestinal epithelial cells, leading to an increase in affinity for glucose" through altered phosphorylation [71], identifying a potentially modifiable pathway linking obesity to impaired glucose homeostasis.
The validation pathway for SGLT1 and GLUT2 as therapeutic targets exemplifies a successful translational research continuum from genetic observation to clinical application. Genetic deficiency states established the non-redundant physiological functions of these transporters, pharmacological studies quantified their contributions to overall glucose absorption, molecular investigations elucidated their regulatory mechanisms, and clinical trials demonstrated the therapeutic efficacy of their modulation. This comprehensive validation framework provides a template for assessing future transporter targets in metabolic disease.
Future directions in this field will likely include more sophisticated tissue-specific targeting approaches, exploitation of regional intestinal specialization, and combination therapies that modulate both transport and regulatory pathways. The continued refinement of dual SGLT1/2 inhibitors and the investigation of allosteric modulators represent promising avenues that may yield therapies with improved efficacy and reduced side effects. Furthermore, the emerging understanding of how intestinal glucose transporters integrate with systemic metabolism through gut-brain axes and neuroendocrine signaling opens additional possibilities for multi-system interventions. The validated framework presented herein provides both justification and direction for these continued investigations at the intersection of basic physiology and therapeutic development.
Intestinal glucose absorption is a critical process for maintaining systemic energy homeostasis, primarily mediated by the coordinated action of the sodium-glucose cotransporter 1 (SGLT1) at the apical membrane of enterocytes and glucose transporter 2 (GLUT2) at the basolateral membrane [56] [6]. While the fundamental role of these transporters is well-established, emerging research has revealed complex regulatory mechanisms influenced by hormonal signals, nutritional status, and pharmacological agents. Understanding these regulatory pathways is essential for developing novel therapeutic strategies for metabolic disorders such as diabetes and obesity. This review examines the impact of dexamethasone and other hormonal factors on the regulation of intestinal glucose transporters, focusing on molecular mechanisms, signaling pathways, and implications for glucose homeostasis.
Dexamethasone as a Potent Regulator of Intestinal Glucose Transport
Molecular Mechanisms of Dexamethasone Action
Dexamethasone, a potent synthetic glucocorticoid, has been identified as a significant regulator of intestinal glucose transporter expression and function. Recent investigations using differentiated human Caco-2/TC7 intestinal cell monolayers have demonstrated that dexamethasone dose-dependently increases glucose transport by upregulating SGLT1 mRNA expression [7] [72]. This upregulation occurs despite a concurrent reduction in GLUT2 mRNA, suggesting a primary role for SGLT1 in dexamethasone-mediated enhancement of intestinal glucose uptake.
The molecular mechanisms underlying dexamethasone's effect involve glucocorticoid receptor-mediated transcriptional regulation. In ileal enterocytes, dexamethasone similarly elevated SGLT1 expression, while in mouse models, it induced GLUT2 mRNA, supporting its role in enhancing intestinal glucose uptake capacity [72]. These findings provide a mechanistic explanation for the hyperglycaemic effects observed with chronic corticosteroid use, identifying enhanced intestinal glucose absorption as a contributing factor alongside the well-established effects on hepatic gluconeogenesis and peripheral insulin resistance.
Table 1: Effects of Dexamethasone on Intestinal Glucose Transporters
| Transporter | Effect of Dexamethasone | Experimental Model | Functional Outcome |
|---|---|---|---|
| SGLT1 | mRNA upregulation | Human Caco-2/TC7 cells | Increased apical glucose uptake |
| SGLT1 | Protein expression increased | Mouse ileal enterocytes | Enhanced glucose absorption capacity |
| GLUT2 | mRNA reduction | Human Caco-2/TC7 cells | Altered basolateral efflux mechanism |
| GLUT2 | mRNA induced | Mouse models | Species-specific regulatory differences |
Methodological Approaches for Investigating Dexamethasone Effects
The experimental protocols for elucidating dexamethasone's effects on glucose transporters involve sophisticated in vitro and in vivo models:
Cell Culture and Differentiation: Caco-2/TC7 cells are seeded in transwell plates with polyester filters (0.4 µm pore size) at a density of 0.1 × 10⁵ cells/cm² in complete DMEM medium supplemented with 20% fetal bovine serum (FBS). Cells are differentiated for 21 days, with FBS-free medium used in the apical compartment after day 7 [7].
Dexamethasone Treatment: Differentiated cell monolayers are treated with dexamethasone (5-20 µM) or DMSO vehicle control for 60 hours, with treatments administered twice daily. Prior to transport assays, cells are starved for 4 hours using glucose- and FBS-free DMEM medium in the presence of dexamethasone or DMSO [7].
Glucose Transport Assessment: Transport activity is measured using 2-deoxy-D-glucose, a non-metabolizable glucose analog. Fresh FBS- and glucose-free medium is added to the basolateral side, while the apical side receives medium containing the glucose analog with or without inhibitors [7].
Gene Expression Analysis: mRNA levels of SGLT1, GLUT2, and other relevant genes are quantified using High Capacity RNA-to-cDNA reverse transcription kits and TaqMan primers, with TBP as a reference gene [7].
Additional Hormonal and Nutrient-Sensing Regulatory Pathways
Sweet Taste Receptor Signaling
Beyond corticosteroid regulation, intestinal glucose transporters are modulated by nutrient-sensing mechanisms involving sweet taste receptors. The gut-expressed sweet taste receptor T1R2-T1R3 and associated G-protein α-gustducin participate in regulatory pathways controlling both SGLT1 and GLUT2 expression [62].
Experimental evidence from piglet models demonstrates that plant-based sweetener formulations induce a marked increase in GLUT2 expression, while sweeteners that do not activate pig T1R2-T1R3 fail to upregulate GLUT2 [62]. Similarly, sucralose supplementation in drinking water significantly increased GLUT2 expression in wild-type mice but not in T1R3 or gustducin knockout mice, confirming the essential role of sweet taste signaling in GLUT2 regulation.
This regulatory pathway involves enteroendocrine L-cells, which co-express T1R2, T1R3, α-gustducin, and gut peptides GLP-1 and GLP-2. In response to luminal sugars and sweeteners, these cells secrete GLP-2, which then binds to its receptor on enteric neurons, triggering the release of neuropeptides VIP or PACAP. These neuropeptides enhance intracellular cAMP and stabilize SGLT1 mRNA, resulting in increased transporter expression and activity [62].
Table 2: Hormonal Regulators of Intestinal Glucose Transporters
| Regulatory Factor | Target Transporter | Signaling Pathway | Physiological Outcome |
|---|---|---|---|
| GLP-2 | SGLT1 & GLUT2 | Enteric neuron → VIP/PACAP → cAMP | Increased glucose absorptive capacity |
| Sweet taste receptors (T1R2/T1R3) | SGLT1 & GLUT2 | Gα-gustducin → GLP-2 release | Diet-dependent transporter regulation |
| Intracellular Ca²⁺ | SGLT1 | Ca²⁺ signaling | Enhanced ileal glucose uptake |
| cAMP/PKA | SGLT1 | 5-HT4R-cAMP-PKA pathway | Reduced ileal glucose uptake |
Calcium and cAMP Signaling Pathways
The regulation of intestinal glucose transporters involves complex intracellular signaling networks, particularly calcium and cAMP pathways. Using chamber experiments with mouse intestinal tissues have revealed that ileal SGLT1-mediated glucose uptake operates more efficiently in the presence of both intracellular and extracellular Ca²⁺ than under Ca²⁺-free conditions [10]. This Ca²⁺-dependent enhancement requires Na⁺/H⁺ or Na⁺/Ca²⁺ exchange mechanisms, highlighting the integrated nature of ion and nutrient transport systems.
In contrast to the stimulatory effect of Ca²⁺, activation of the 5-HT4 receptor-cAMP-PKA pathway reduces ileal glucose uptake [10]. This opposing regulation demonstrates the complex balance of signaling inputs that fine-tune glucose absorption according to physiological needs, potentially offering targets for therapeutic intervention in metabolic disorders.
Experimental Models and Methodologies for Studying Transporter Regulation
Vascularly Perfused Rat Intestine Model
The isolated vascularly perfused rat intestine preparation represents a valuable experimental model for studying glucose absorption mechanisms while preserving the polarity of epithelial cells and the entire transport pathway [6]. This model provides clear advantages over other in vitro systems by ensuring adequate vascular perfusion of the mucosa, more closely mimicking in vivo conditions.
In this model, glucose absorption is traced using ¹⁴C-D-glucose, allowing sensitive and accurate quantification. SGLT1 and GLUT2 activities are selectively blocked using phlorizin and phloretin, respectively, while ¹⁴C-D-mannitol serves as an indicator of paracellular absorption [6]. Experiments using this approach have demonstrated that glucose absorption involves both active transcellular transport (mediated by SGLT1/GLUT2) and passive paracellular mechanisms, with approximately 30% of glucose absorption remaining after combined SGLT1 and GLUT2 blockade [6].
Using Chamber Techniques for Regional Absorption Analysis
Using chamber experiments allow detailed functional assessment of glucose transport across specific intestinal segments. This methodology involves mounting mucosa-submucosa specimens in chambers with circular windows, with mucosal and serosal sides filled with oxygenated Ringer's solution maintained at 37°C [23].
Short-circuit current (Isc) measurements under short-circuit conditions provide a sensitive indicator of electrogenic glucose transport primarily mediated by SGLT1. This technique has revealed segment-specific differences in glucose absorption, with the distal ileum showing more pronounced glucose-induced Isc compared to duodenum and proximal jejunum in fed mice [10] [23]. Furthermore, fasting conditions robustly increase glucose-induced Isc in the jejunum, indicating adaptive regulation of transport capacity according to nutritional status [23].
Research Reagent Solutions for Investigating Transporter Regulation
Table 3: Essential Research Reagents for Studying Glucose Transporter Regulation
| Reagent/Cell Line | Application | Key Features | Experimental Use |
|---|---|---|---|
| Caco-2/TC7 cells | Intestinal transport model | Human colon carcinoma-derived, form polarized monolayers | Dexamethasone treatment studies, glucose uptake assays |
| Phlorizin | SGLT1 inhibitor | Competitive inhibitor, blocks apical glucose uptake | Assessing SGLT1 contribution to total glucose absorption |
| Phloretin | GLUT2 inhibitor | Blocks facilitated glucose transport | Determining GLUT2 role in basolateral efflux |
| 2-deoxy-D-glucose | Glucose uptake tracer | Non-metabolizable glucose analog | Specific measurement of glucose transport activity |
| ¹⁴C-D-glucose | Radioactive glucose tracer | Sensitive quantification of absorption | Measuring glucose flux in vascularly perfused models |
| ¹⁴C-D-mannitol | Paracellular marker | Indicates passive permeability | Assessing paracellular glucose transport component |
| Dexamethasone | Glucocorticoid receptor agonist | Potent synthetic corticosteroid | Studying hormonal regulation of transporters |
| TaqMan primers (SGLT1, GLUT2) | Gene expression analysis | Specific quantification of mRNA levels | Assessing transcriptional regulation of transporters |
Signaling Pathway Visualizations
Diagram 1: Dexamethasone Regulation of Glucose Transporters. This pathway illustrates how dexamethasone binds to the glucocorticoid receptor (GR), leading to upregulation of SGLT1 gene expression and downregulation of GLUT2, ultimately enhancing intestinal glucose absorption and contributing to hyperglycemia [7] [72].
Diagram 2: Sweet Taste Receptor Signaling Pathway. This diagram shows how luminal sugars activate T1R2-T1R3 receptors on L-cells, triggering GLP-2 release, which through enteric neurons and VIP signaling increases cAMP, stabilizes SGLT1 mRNA, and enhances expression of both SGLT1 and GLUT2 transporters [62].
The regulation of intestinal glucose transporters GLUT2 and SGLT1 involves complex hormonal and nutrient-sensing mechanisms that extend beyond their fundamental roles in glucose absorption. Dexamethasone emerges as a potent regulator, primarily through upregulation of SGLT1 expression, providing new insights into the metabolic side effects of corticosteroid therapy. Additional regulatory pathways involving sweet taste receptors, GLP-2, and intracellular signaling molecules further illustrate the sophisticated adaptive mechanisms that control intestinal glucose absorption. Understanding these emerging regulatory mechanisms offers promising avenues for developing targeted therapies for metabolic disorders, potentially by modulating intestinal glucose absorption to improve systemic glycemic control. Future research should focus on elucidating the precise molecular interactions and identifying tissue-specific regulatory elements that could serve as selective drug targets.
Intestinal glucose absorption is a critical process for maintaining systemic energy homeostasis, primarily mediated by the coordinated actions of the sodium-glucose cotransporter 1 (SGLT1/SLC5A1) and the facilitative glucose transporter 2 (GLUT2/SLC2A2). While the jejunum is traditionally considered the major site for nutrient absorption, the ileum possesses unique functional characteristics and regulatory mechanisms. This review synthesizes current research on the divergent roles of these intestinal segments, focusing on the distinct behavior of SGLT1 and GLUT2 transporters, which is of paramount importance for understanding nutrient absorption physiology and developing targeted therapeutic strategies for metabolic disorders.
Quantitative Comparison of Jejunal and Ileal Glucose Transport
The functional divergence between jejunal and ileal glucose absorption is demonstrated through distinct kinetic parameters, regulatory mechanisms, and molecular expression patterns. The table below summarizes key quantitative differences identified in experimental models.
Table 1: Comparative characteristics of glucose transport in the jejunum versus ileum
| Parameter | Jejunum | Ileum | Experimental Context |
|---|---|---|---|
| SGLT1-Mediated Active Transport Capacity | Higher | Lower | Brush border membrane vesicles, rats [73] |
| Glucose Transport Rate | 2-3 times faster | 2-3 times slower | Isolated brush border membranes, rats [73] |
| Response to Luminal Glucose (25 mM) | Moderate Isc response | Stronger Isc response | Ussing chamber, mouse tissue [10] |
| Dependence on SGLT1 for Mass Absorption | Critical (≈97%) [27] | Critical | Sglt1−/− mice, radiotracer gavage [27] [14] |
| Regulation by Ca²⁺ Signaling | Standard | Enhanced, involves Cav1.3 [3] [10] | Ussing chamber, pharmacological modulation [10] |
| Regulation by cAMP/PKA Signaling | Standard | Potent inhibition [10] | Ussing chamber, 5-HT4R activation [10] |
| GLUT2 Contribution to Apical Influx | Controversial, minor under high load [14] | Controversial, minor under high load [14] | Glut2 knockout mouse models [28] [14] |
Molecular Mechanisms and Regulatory Pathways
Core Transport Mechanisms
The established model of intestinal glucose absorption involves a two-step process across the enterocyte. First, SGLT1 at the apical membrane mediates active, sodium-dependent glucose uptake against its concentration gradient. This transport is electrogenic, with a stoichiometry of 2 Na⁺ ions per glucose molecule [1]. Second, glucose exits the cell across the basolateral membrane into the circulation via GLUT2, a high-capacity facilitative diffuser [1] [74]. While this core mechanism is shared, its regulation and efficiency differ markedly between the jejunum and ileum.
Regional Regulatory Divergence
A key functional divergence lies in the differential regulation by second messengers. Research indicates that ileal glucose absorption is highly dependent on intracellular and extracellular Ca²⁺, a regulation that is less pronounced in the jejunum [10]. This Ca²⁺ signaling occurs through a pathway involving Cav1.3, an L-type voltage-gated calcium channel. The influx of Ca²⁺ triggers a cascade that involves myosin II light chain phosphorylation and the translocation of GLUT2 to the apical membrane, providing a mechanism for the rapid upregulation of absorptive capacity in the ileum [3] [10].
In contrast, the ileal transport is uniquely sensitive to inhibition by the cAMP/PKA pathway. Activation of the serotonin 4 receptor (5-HT4R), which elevates intracellular cAMP, leads to a significant reduction in SGLT1-mediated ileal glucose uptake, a effect not observed in the proximal intestine [10]. This creates a distinct neuroendocrine checkpoint in the ileum.
Figure 1: Regulatory Pathways of Ileal Glucose Absorption. The diagram highlights the Ca²⁺-dependent activation pathway and the unique serotonin-mediated cAMP inhibition pathway in the ileum.
Experimental Models and Methodologies
Key Experimental Approaches
Investigating regional glucose transport requires specialized techniques that allow for the functional assessment of specific intestinal segments.
Table 2: Essential research reagents and experimental tools for investigating intestinal glucose transport
| Category / Reagent | Specific Example | Function / Application |
|---|---|---|
| SGLT1 Inhibitor | Phlorizin | Blocks active Na⁺-dependent glucose transport via SGLT1. Used to isolate SGLT1-mediated component [27] [10]. |
| Non-Metabolizable Glucose Analog | 3-O-Methyl-D-glucose (3-OMG) / α-Methyl-D-glucoside (AMG) | Tracks SGLT1-specific uptake without subsequent metabolism [27] [10]. |
| Ca²⁺ Signaling Modulators | Nifedipine, 2-APB, SKF-96365 | Inhibits specific calcium channels (e.g., Cav1.3, store-operated Ca²⁺ entry) to dissect Ca²⁺-dependent regulation [10]. |
| cAMP Pathway Activator | Forskolin | Directly activates adenylate cyclase, elevating cAMP to study PKA-mediated inhibition of transport [10]. |
| Radiolabeled Tracers | ¹⁴C-D-glucose, ³H-Mannitol | Enables quantification of tissue-specific glucose uptake and correction for adherent fluid [14]. |
| Genetically Modified Mouse Models | Sglt1−/−, GLUT2ΔIEC (inducible intestinal knockout) | Determines the essential role of specific transporters in different gut regions [27] [28] [14]. |
1Using Chamber Technique
This ex vivo method involves mounting a segment of isolated intestinal tissue between two chambers, allowing for the direct measurement of electrogenic ion transport. The addition of D-glucose to the mucosal side generates a short-circuit current (Isc), which is a sensitive, real-time indicator of active, SGLT1-mediated glucose transport [10]. This technique is ideal for pharmacologically dissecting signaling pathways using specific agonists and antagonists.
Protocol Summary:
- Isolate and open segments of jejunum and ileum longitudinally.
- Mount tissues in Using chambers with an exposed surface area.
- Bathe both mucosal and serosal sides in oxygenated Ringer's solution.
- Measure the baseline Isc.
- Add D-glucose (e.g., 25 mM) to the mucosal reservoir.
- Record the resultant change in Isc (ΔIsc).
- Apply modulators (e.g., phlorizin, Ca²⁺ blockers, forskolin) to investigate regulatory mechanisms [10].
2In Vivo Radiotracer Gavage
This approach assesses glucose absorption and tissue retention under more physiological conditions.
Protocol Summary:
- Fast animals (e.g., 6-16 hours).
- Administer an oral gavage containing a high glucose load (e.g., 40% solution, 4 g/kg body weight) mixed with radiolabeled [¹⁴C]-D-glucose and a non-absorbable marker like [³H]-mannitol.
- After a set period (e.g., 15 minutes), collect blood via the retro-orbital plexus and euthanize the animal.
- Quickly remove and evert the entire small intestine.
- Segment the intestine (e.g., 1 cm segments) and quantify retained ¹⁴C radioactivity in each segment, using the ³H-mannitol signal to correct for adherent luminal fluid [14].
- Express results as nmol of glucose retained per cm of tissue, providing a spatial profile of absorption capacity.
Figure 2: Experimental Workflow for Investigating Jejunal and Ileal Transport. The diagram outlines a multi-method approach to characterize regional glucose absorption, combining functional, kinetic, and genetic validation strategies.
Implications for Drug Development and Disease
Understanding the functional divergence between jejunal and ileal transport opens avenues for targeted therapeutic interventions. The permanent apical localization of GLUT2 in insulin-resistant and diabetic states contributes to pathologically high glucose absorption [3]. This makes apical GLUT2 a potential drug target for modulating postprandial hyperglycemia. Furthermore, the unique sensitivity of the ileum to neuroendocrine regulation (e.g., via serotonin) suggests that region-specific targeting could enhance glycemic control with minimized systemic side effects.
The role of SGLT1 in triggering incretin secretion (GIP and GLP-1) is well-established [27] [1] [14]. Strategies that modulate the rate of glucose delivery to the distal intestine, where L-cells are abundant, can potentiate GLP-1 release, offering a mechanism for new diabetes and obesity treatments. The induction of moderate glucose malabsorption through intestinal-specific GLUT2 inhibition has been shown to mimic a calorie-restricted state, improving glucose tolerance and reducing body weight gain [28].
The jejunum and ileum play distinct yet complementary roles in intestinal glucose handling. The jejunum is the high-capacity workhorse for absorption, while the ileum acts as a finely tuned regulatory segment, equipped with unique Ca²⁺-dependent enhancement and cAMP-dependent inhibition mechanisms. The core transporter SGLT1 is pivotal in both regions, but its functional context is segment-specific. The controversial role of apical GLUT2 warrants further investigation, particularly in pathological states. A precise understanding of this functional divergence is crucial for developing the next generation of therapeutics aimed at modulating nutrient absorption for metabolic diseases.
Conclusion
The intricate partnership of SGLT1 and GLUT2 is fundamental to intestinal glucose absorption, with SGLT1 unequivocally serving as the primary apical transporter and a critical mediator of incretin secretion. While the role of basolateral GLUT2 is well-established, its proposed apical recruitment remains a subject of active debate, necessitating rigorous methodological approaches to resolve. The validation of these transporters as drug targets is exemplified by the success of SGLT inhibitors in diabetes care, highlighting the therapeutic potential of modulating intestinal glucose handling. Future research must focus on elucidating the precise regulatory signals governing transporter trafficking, exploring their roles in gut-brain axis communication and mucosal immunity, and developing next-generation, tissue-specific modulators. For drug development professionals, a deepened understanding of these transporters offers promising avenues not only for managing diabetes and obesity but also for addressing a broader spectrum of metabolic and inflammatory diseases.
References
- 1. Sodium Glucose Cotransporter 1 - an overview [https://www.sciencedirect.com/topics/medicine-and-dentistry/sodium-glucose-cotransporter-1]
- 2. Structure and mechanism of the SGLT family of glucose ... [https://pmc.ncbi.nlm.nih.gov/articles/PMC9482448/]
- 3. Sugar absorption in the intestine: the role of GLUT2 [https://pubmed.ncbi.nlm.nih.gov/18393659/]
- 4. The role of GLUT2 in glucose metabolism in multiple organs ... [https://pmc.ncbi.nlm.nih.gov/articles/PMC10374759/]
- 5. Structural mechanism of SGLT1 inhibitors - PMC [https://pmc.ncbi.nlm.nih.gov/articles/PMC9616851/]
- 6. Glucose absorption by isolated, vascularly perfused rat intestine [https://pmc.ncbi.nlm.nih.gov/articles/PMC11971594/]
- 7. Dexamethasone enhances intestinal glucose absorption ... [https://www.nature.com/articles/s41598-025-22312-8]
- 8. What are the therapeutic applications for SGLT1 inhibitors? [https://synapse.patsnap.com/article/what-are-the-therapeutic-applications-for-sglt1-inhibitors]
- 9. Mechanisms of Glucose Absorption in the Small Intestine in ... [https://pmc.ncbi.nlm.nih.gov/articles/PMC8308647/]
- 10. Glucose transports in the ileum: mechanism, regulation ... [https://www.sciencedirect.com/science/article/abs/pii/S0006291X25013920]
- 11. Physiology of renal glucose handling via SGLT1, SGLT2 ... [https://pmc.ncbi.nlm.nih.gov/articles/PMC6133168/]
- 12. GLUT2/SLC2A2 is a bi-directional urate transporter - PMC [https://pmc.ncbi.nlm.nih.gov/articles/PMC12143617/]
- 13. The Role of SGLT1 and GLUT2 in Intestinal Glucose ... [https://pmc.ncbi.nlm.nih.gov/articles/PMC3935955/]
- 14. The Role of SGLT1 and GLUT2 in Intestinal Glucose Transport ... [https://journals.plos.org/plosone/article?id=10.1371/journal.pone.0089977]
- 15. Computational Modelling of Glucose Uptake by SGLT1 and ... [https://www.frontiersin.org/journals/physiology/articles/10.3389/fphys.2021.699152/full]
- 16. Mechanisms of Glucose Uptake in Intestinal Cell Lines [https://pmc.ncbi.nlm.nih.gov/articles/PMC3237888/]
- 17. The role of SGLT1 and GLUT2 in intestinal glucose ... [https://pubmed.ncbi.nlm.nih.gov/24587162/]
- 18. Development of SGLT1 and SGLT2 inhibitors - PMC [https://pmc.ncbi.nlm.nih.gov/articles/PMC6124499/]
- 19. Physiology of renal glucose handling via SGLT1, SGLT2 ... [https://link.springer.com/article/10.1007/s00125-018-4656-5]
- 20. Mechanisms of Glucose Absorption in the Small Intestine ... [https://www.mdpi.com/2072-6643/13/7/2474]
- 21. Glucose transporters in the small intestine in health and ... [https://link.springer.com/article/10.1007/s00424-020-02439-5]
- 22. Sodium-Glucose Cotransporter-2 Inhibitors in Diabetes ... [https://www.mdpi.com/1420-3049/30/20/4125]
- 23. Regulatory mechanisms of glucose absorption in the ... [https://www.nature.com/articles/s41598-023-38024-w]
- 24. Dexamethasone enhances intestinal glucose absorption and ... [https://pmc.ncbi.nlm.nih.gov/articles/PMC12583508/]
- 25. Glucose transporters in the small intestine in health and disease [https://pmc.ncbi.nlm.nih.gov/articles/PMC7462918/]
- 26. Sodium glucose cotransporter SGLT1 as a therapeutic target ... [https://pmc.ncbi.nlm.nih.gov/articles/PMC5045806/]
- 27. Na+-d-glucose Cotransporter SGLT1 is Pivotal for Intestinal ... [https://pmc.ncbi.nlm.nih.gov/articles/PMC3237647/]
- 28. Intestinal invalidation of the glucose transporter GLUT2 ... [https://pmc.ncbi.nlm.nih.gov/articles/PMC5220280/]
- 29. Sodium-dependent glucose transporter 1 and ... [https://foodandnutritionresearch.net/index.php/fnr/article/view/3745]
- 30. Metformin-regulated glucose flux from the circulation to ... [https://www.nature.com/articles/s43856-025-00755-4]
- 31. Intestinal glucose excretion: A potential mechanism for ... [https://www.sciencedirect.com/science/article/abs/pii/S0026049523003475]
- 32. Identification of phlorizin binding domains in sodium ... [https://www.sciencedirect.com/science/article/abs/pii/S0300908415001741]
- 33. Phloretin Improves Ultrafiltration and Reduces Glucose ... [https://pmc.ncbi.nlm.nih.gov/articles/PMC9528341/]
- 34. Transport and inhibition mechanism of the human SGLT2– ... [https://www.nature.com/articles/s41594-023-01134-0]
- 35. Inhibition of glucose transport into brain by phlorizin, ... [https://pubmed.ncbi.nlm.nih.gov/1182174/]
- 36. Characterization of SGLT1-mediated glucose transport in ... [https://www.sciencedirect.com/science/article/abs/pii/S0014299921000789]
- 37. Glucose absorption by isolated, vascularly perfused rat intestine: A significant paracellular contribution augmented by SGLT1 inhibition - PubMed [https://pubmed.ncbi.nlm.nih.gov/40186371/]
- 38. Sodium glucose transport modulation in type 2 diabetes ... [https://www.sciencedirect.com/science/article/pii/S1550728916300533]
- 39. SGLT2 inhibitors across various patient populations in the ... [https://pmc.ncbi.nlm.nih.gov/articles/PMC12217734/]
- 40. SGLT2 inhibitors across various patient populations in the ... [https://www.nature.com/articles/s44324-025-00068-z]
- 41. Navigating the therapeutic landscape of SGLT2 inhibitors ... [https://www.explorationpub.com/Journals/em/Article/1001255]
- 42. Sodium-Glucose Transport 2 (SGLT2) Inhibitors - NCBI - NIH [https://www.ncbi.nlm.nih.gov/books/NBK576405/]
- 43. SGLT2 Inhibitors: From Molecular Mechanisms to Clinical ... [https://www.mdpi.com/1420-3049/30/15/3112]
- 44. Regulation of Intestinal by Ion Channels and... Glucose Absorption [https://pubmed.ncbi.nlm.nih.gov/26784222/]
- 45. Luminal Sweet Sensing and Enteric Nervous System ... [https://pmc.ncbi.nlm.nih.gov/articles/PMC12073725/]
- 46. The Adipose Tissue-Derived Secretome (ADS) in Obesity ... [https://www.mdpi.com/2073-4409/14/16/1241]
- 47. Oat β-glucan depresses SGLT1- and GLUT2-mediated ... [https://www.sciencedirect.com/science/article/abs/pii/S0271531716000452]
- 48. Oat β-glucan depresses SGLT1- and GLUT2-mediated ... [https://pubmed.ncbi.nlm.nih.gov/27188900/]
- 49. Role of intestinal glucose absorption in glucose tolerance [https://www.sciencedirect.com/science/article/abs/pii/S147148922030120X]
- 50. Does apical membrane GLUT2 have a role in intestinal ... [https://pmc.ncbi.nlm.nih.gov/articles/PMC4309173/]
- 51. Mechanisms of glucose uptake in intestinal cell lines [https://www.sciencedirect.com/science/article/abs/pii/S0039606011003618]
- 52. The role of GLUT2 in glucose metabolism in multiple ... [https://link.springer.com/article/10.1007/s11033-023-08535-w]
- 53. A biologically validated mathematical model for decoding ... [https://pubmed.ncbi.nlm.nih.gov/37899750/]
- 54. Para- and Transcellular Transport Kinetics of Nanoparticles ... [https://pmc.ncbi.nlm.nih.gov/articles/PMC10923144/]
- 55. Regulation of Intestinal Glucose Absorption by Ion ... [https://pmc.ncbi.nlm.nih.gov/articles/PMC4728656/]
- 56. Physiological functions of glucose transporter-2: From cell ... [https://www.sciencedirect.com/science/article/pii/S2405844024014907]
- 57. Glucose absorption in the duodenum is modulated by an ... [https://pubmed.ncbi.nlm.nih.gov/40716951/]
- 58. Differential changes in anatomical, molecular and functional ... [https://pmc.ncbi.nlm.nih.gov/articles/PMC12325091/]
- 59. Intestinal invalidation of the glucose transporter GLUT2 ... [https://www.sciencedirect.com/science/article/pii/S2212877816302162]
- 60. Ghrelin Facilitates GLUT2-, SGLT1- and SGLT2-mediated ... [https://www.nature.com/articles/srep45024]
- 61. Dependent Glucose Co-Transporters in Chicken Kidneys ... [https://www.mdpi.com/1467-3045/46/12/854]
- 62. Luminal Sweet Sensing and Enteric Nervous System ... [https://www.mdpi.com/2072-6643/17/9/1547]
- 63. Glucose absorption in the duodenum is modulated by an ... [https://pmc.ncbi.nlm.nih.gov/articles/PMC12306370/]
- 64. Thyroid Hormones Regulate Postprandial Glucose ... [https://www.mdpi.com/1422-0067/26/18/8854]
- 65. Gut Mechanisms Linking Intestinal Sweet Sensing to ... [https://www.frontiersin.org/journals/endocrinology/articles/10.3389/fendo.2018.00741/full]
- 66. Glycaemia and body weight are regulated by sodium ... [https://www.sciencedirect.com/science/article/pii/S2212877822000278]
- 67. SGL5213, a novel and potent intestinal SGLT1 inhibitor ... [https://www.sciencedirect.com/science/article/abs/pii/S0014299919301785]
- 68. What is the pipeline for future medications for obesity? [https://www.nature.com/articles/s41366-024-01473-y]
- 69. Probing SGLT2 as a therapeutic target for diabetes [https://pmc.ncbi.nlm.nih.gov/articles/PMC5886707/]
- 70. Dual-Target Compounds against Type 2 Diabetes Mellitus [https://pmc.ncbi.nlm.nih.gov/articles/PMC8071193/]
- 71. The Adipose Tissue-Derived Secretome (ADS) in Obesity ... [https://pubmed.ncbi.nlm.nih.gov/40862720/]
- 72. Dexamethasone enhances intestinal glucose absorption ... [https://pubmed.ncbi.nlm.nih.gov/41184395/]
- 73. Jejunal and ileal D-glucose transport in isolated brush ... [https://pubmed.ncbi.nlm.nih.gov/1252511/]
- 74. Human Glucose Transporters in Health and Selected ... [https://www.mdpi.com/1422-0067/26/15/7392]