GLUT4 Translocation in Skeletal Muscle: Molecular Mechanisms, Research Methods & Therapeutic Implications
This article provides a comprehensive, current review of the GLUT4 translocation process in skeletal muscle, a critical determinant of whole-body glucose homeostasis.
GLUT4 Translocation in Skeletal Muscle: Molecular Mechanisms, Research Methods & Therapeutic Implications
Abstract
This article provides a comprehensive, current review of the GLUT4 translocation process in skeletal muscle, a critical determinant of whole-body glucose homeostasis. It begins by exploring the foundational molecular biology, detailing the key signaling pathways (insulin/AMPK/exercise), structural components (vesicles, tethering proteins, cytoskeleton), and regulatory proteins involved. The methodological section critically evaluates established and emerging techniques for quantifying GLUT4 translocation in vitro and in vivo, from subcellular fractionation to advanced imaging. We address common experimental challenges and optimization strategies for assays, model systems, and data interpretation. Finally, the article validates findings by comparing physiological (exercise) vs. pharmacological (insulin, novel agonists) stimulation and examining dysregulation in insulin resistance and type 2 diabetes. Aimed at researchers and drug developers, this synthesis aims to bridge mechanistic understanding with translational application for metabolic disease therapeutics.
Decoding the Machinery: Core Molecular Mechanisms of GLUT4 Trafficking in Muscle
Within the broader study of insulin-stimulated GLUT4 translocation in skeletal muscle, the formation and maintenance of the specialized intracellular GLUT4 storage compartment is a fundamental precursor process. This reservoir, distinct from the general endosomal system, is essential for the rapid plasma membrane insertion of GLUT4 in response to insulin. This whitepaper details the molecular mechanisms of GLUT4 vesicle biogenesis and storage, serving as a technical reference for research and therapeutic targeting.
Molecular Machinery of GLUT4 Storage Vesicle (GSV) Biogenesis
GLUT4 vesicle biogenesis is a multi-step process involving sorting from the endosomal system, coat-mediated budding, and tethering at storage sites.
Key Sorting Signals: The GLUT4 molecule contains critical motifs, including a dileucine motif ([DE]XXXL[LI]) in its C-terminus and a F(_5)QI motif in its N-terminus, which direct its internalization from the plasma membrane and subsequent sorting into GSVs.
Coat Proteins and Budding: The formation of GSVs from endosomal membranes is facilitated by clathrin and its adaptors. The adaptor protein AP-1, along with the specific regulator TUG, is implicated in the sorting and budding process. The small GTPase Arf1 is also activated to recruit coat components.
Tethering and Docking: Newly formed GSVs are retained intracellularly through tethering complexes. The TUG protein physically tethers GSVs to Golgi/TGN elements, while the Golgin protein GM130 and the cytoskeleton contribute to the spatial organization of the storage compartment. The VAMP2 (synaptobrevin-2) SNARE protein is enriched on GSVs, primed for fusion upon stimulation.
Table 1: Core Proteins in GSV Biogenesis & Storage
| Protein | Function in GSV Lifecycle | Experimental Evidence |
|---|---|---|
| GLUT4 (SLC2A4) | Insulin-responsive glucose transporter; contains sorting motifs. | Mutagenesis of F(_5)QI or dileucine motifs abrogates intracellular retention. |
| TUG (Aspscr1) | Tethers GSVs to Golgi; cleaved by insulin signaling to release vesicles. | TUG knockdown disperses GSVs and impairs insulin-stimulated translocation. |
| AP-1 | Clathrin adaptor complex for GSV budding from endosomes. | siRNA knockdown reduces GLUT4 storage compartment size. |
| VAMP2 | v-SNARE on GSVs for fusion with plasma membrane. | Cleavage by tetanus toxin blocks insulin-stimulated GLUT4 translocation. |
| IRAP | Type II membrane protein co-localized with GLUT4 in GSVs; stabilizes compartment. | IRAP knockout reduces GLUT4 at the cell surface and in intracellular pools. |
| Sortilin | Sorting receptor that recognizes GLUT4. | Sortilin knockout in muscle reduces GLUT4 protein levels and GSV formation. |
Experimental Protocols for Investigating GSV Biogenesis
Protocol: Subcellular Fractionation to Isolate GSVs from Skeletal Muscle
This protocol separates intracellular membranes to enrich for GSVs based on their low buoyant density.
- Tissue Homogenization: Rapidly excise and freeze rodent skeletal muscle (e.g., gastrocnemius). Powder frozen tissue under liquid N(_2). Homogenize in ice-cold HES buffer (20 mM HEPES, 1 mM EDTA, 255 mM sucrose, pH 7.4) with protease/phosphatase inhibitors using a Polytron homogenizer (2 x 10s bursts).
- Differential Centrifugation:
- Clear homogenate at 1,000 x g for 10 min (4°C) to remove nuclei and debris.
- Centrifuge supernatant at 9,000 x g for 20 min to pellet mitochondria and lysosomes.
- Centrifuge the resulting supernatant at 180,000 x g for 75 min to obtain a total membrane pellet (TM).
- Velocity Sedimentation: Resuspend TM pellet in HES buffer. Layer onto a 10-30% linear sucrose gradient. Centrifuge at 100,000 x g for 16-18 hours in a swinging-bucket rotor.
- Fraction Collection: Collect 12-14 fractions from the top of the gradient. Analyze fractions via immunoblotting. GSVs typically co-localize with markers like IRAP and sortilin in low-density fractions (≈15-20% sucrose), separate from early endosomes (EEA1, Rab5) and trans-Golgi (TGN38).
Protocol: Total Internal Reflection Fluorescence (TIRFM) Live-Cell Imaging of GSV Dynamics
This protocol visualizes the exocytosis of individual GSVs in real-time.
- Cell Model: Use differentiated L6 or C2C12 myoblasts stably expressing GLUT4 with an exofacial epitope tag (e.g., HA, myc) or a pH-sensitive fluorescent protein (pHluorin-GLUT4).
- Imaging Setup: Utilize a TIRF microscope with temperature and CO(_2) control. TIRF illuminates a thin (~100 nm) optical section adjacent to the plasma membrane.
- Stimulation & Acquisition: Serum-starve cells for 3-6 hours. Acquire baseline images (1 frame/5-10 sec). Stimulate with 100 nM insulin directly in the imaging chamber. Continue acquisition for 20-30 minutes.
- Quantification: Analyze movies using particle tracking software (e.g., ImageJ/TrackMate). Key metrics include: (a) Docking: Vesicles appearing within the TIRF field and becoming stationary. (b) Fusion: Sudden loss of a vesicle spot (for epitope tags) or a rapid increase in fluorescence intensity (for pHluorin). Fusion events are plotted over time.
Diagram 1: Insulin Signaling to GSV Mobilization
Diagram 2: GLUT4 Storage Vesicle Biogenesis Pathway
The Scientist's Toolkit: Key Research Reagents
Table 2: Essential Reagents for GLUT4 Storage Research
| Reagent | Function/Application | Key Detail |
|---|---|---|
| Anti-GLUT4 Antibody | Immunoblotting, immunofluorescence, immunoprecipitation. | Target C-terminus for total protein; exofacial tag (HA/myc) for surface detection. |
| Anti-IRAP Antibody | Marker for GSVs in fractionation/imaging. | Co-localizes with GLUT4; useful for compartment identification. |
| Insulin (Human Recombinant) | Primary agonist to stimulate GLUT4 translocation. | Used at 10-100 nM for acute stimulation in cell/tissue models. |
| PI3K Inhibitors (e.g., Wortmannin, LY294002) | Validates insulin signaling pathway dependence. | Pre-treatment inhibits GSV mobilization. |
| Bafilomycin A1 | V-ATPase inhibitor; neutralizes acidic compartments. | Used to distinguish GSVs from late endosomes/lysosomes in imaging. |
| Sucrose Gradient Media | For density-based separation of intracellular membranes. | Used in velocity sedimentation to isolate low-density GSVs. |
| Tetanus Toxin Light Chain | Protease that cleaves VAMP2/v-SNAREs. | Validates SNARE requirement for fusion; blocks insulin effect. |
| Akt Inhibitor (e.g., MK-2206) | Allosteric Akt inhibitor. | Confirms role of Akt in AS160 phosphorylation and GSV release. |
| pHluorin-GLUT4 Construct | pH-sensitive GFP for live imaging of vesicle fusion. | Fluorescence quenched in acidic GSVs; flares upon fusion with neutral PM. |
| Myoblast Cell Lines (L6, C2C12) | Differentiable skeletal muscle models. | L6 cells show robust insulin-responsive GLUT4 translocation. |
Introduction Within skeletal muscle research, understanding the molecular mechanisms governing glucose uptake is paramount for addressing insulin resistance in metabolic diseases. The translocation of the glucose transporter GLUT4 from intracellular vesicles to the plasma membrane is the definitive, rate-limiting step in insulin-stimulated glucose disposal. This whitepaper details the central regulatory axis of this process: the canonical PI3K/Akt pathway and its critical substrate, AS160/TBC1D4, a Rab GTPase-activating protein (RabGAP). Disruption of this cascade is a hallmark of skeletal muscle insulin resistance.
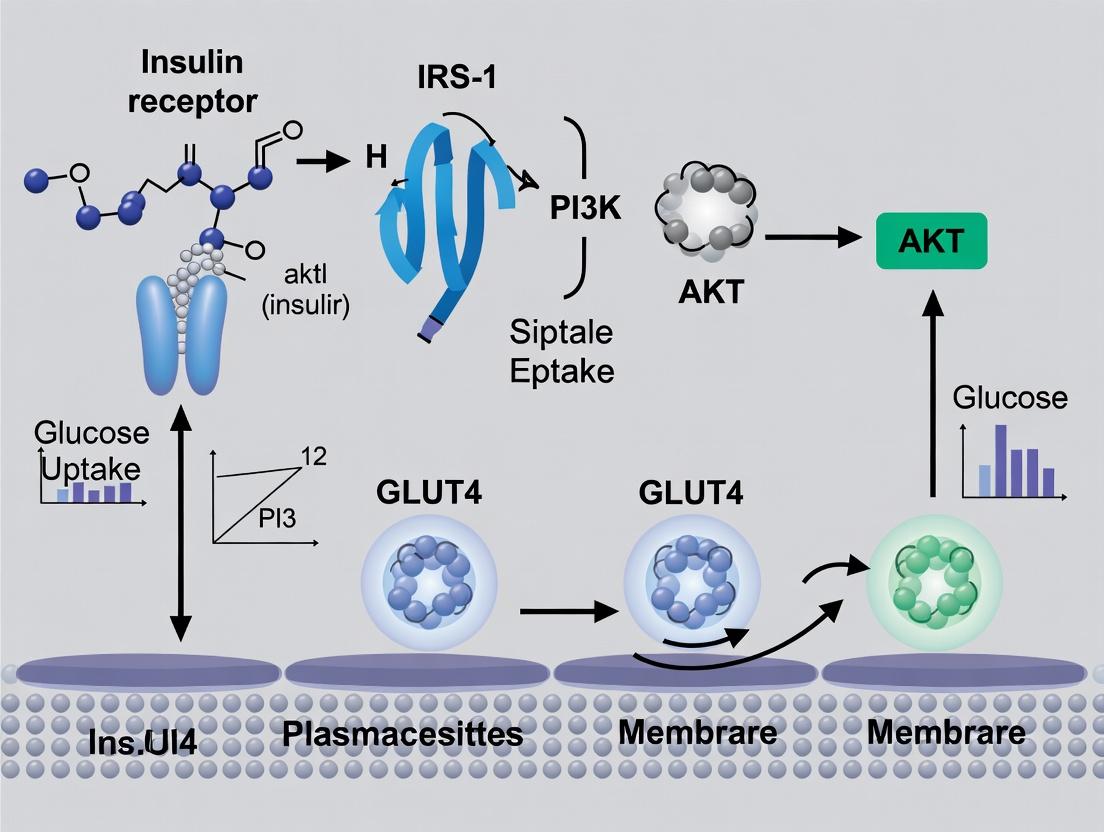
The Core Signaling Pathway Insulin binding to its receptor tyrosine kinase (IR) triggers autophosphorylation and recruitment of insulin receptor substrates (IRS1/2). Phosphorylated IRS proteins activate Class IA Phosphoinositide 3-Kinase (PI3K), which converts phosphatidylinositol 4,5-bisphosphate (PIP2) to phosphatidylinositol 3,4,5-trisphosphate (PIP3) at the membrane. This lipid second messenger recruits pleckstrin homology (PH) domain-containing proteins, most critically Phosphoinositide-dependent kinase 1 (PDK1) and Akt (Protein Kinase B).
Akt is fully activated via dual phosphorylation: Thr308 by PDK1 and Ser473 by the mTORC2 complex. Activated Akt phosphorylates numerous downstream targets, with AS160 (Akt substrate of 160 kDa, also known as TBC1D4) being a principal effector in GLUT4 traffic. AS160, in its basal state, exerts RabGAP activity towards specific Rabs (e.g., Rab8A, Rab10, Rab13, Rab14), maintaining them in an inactive GDP-bound state, thereby sequestering GLUT4 vesicles. Phosphorylation of AS160 by Akt on multiple residues (primarily Thr642, Ser588, Ser751) inhibits its GAP activity. This inactivation allows the accumulation of active, GTP-bound Rabs, which then mobilize GLUT4 storage vesicles (GSVs) to fuse with the plasma membrane.
A parallel, PI3K-independent pathway involving the CAP/Cbl/TC10 cascade also contributes, particularly in adipocytes, but the PI3K/Akt/AS160 axis is considered the dominant and essential pathway in skeletal muscle.
Quantitative Data Summary
Table 1: Key Phosphorylation Sites in the PI3K/Akt/AS160 Cascade
| Protein | Phosphorylation Site | Upstream Kinase | Functional Consequence | Approx. Fold Increase with Insulin |
|---|---|---|---|---|
| IR | Tyr1158, Tyr1162, Tyr1163 | Autophosphorylation | Activation of kinase domain | >10x |
| IRS-1 | Multiple Tyr residues | IR | PI3K recruitment | 5-8x |
| Akt | Thr308 | PDK1 | Partial activation | 6-10x |
| Akt | Ser473 | mTORC2 | Full activation | 4-8x |
| AS160 | Thr642 (Phospho-Akt substrate motif) | Akt | Primary inhibition of GAP activity | 3-5x |
| AS160 | Ser588 | Akt | Contributes to GAP inhibition | 2-4x |
| AS160 | Ser751 | Akt | Contributes to GAP inhibition | 2-4x |
Table 2: Experimental Readouts in Skeletal Muscle Studies
| Assay/Readout | Basal State | Insulin-Stimulated State | Common Model Systems |
|---|---|---|---|
| Plasma Membrane GLUT4 | 5-10% of total | 30-50% of total (L6 myotubes, mouse muscle) | L6 myotubes, C2C12 myotubes, mouse extensor digitorum longus (EDL) |
| 2-Deoxyglucose Uptake | 1.0 (baseline) | 1.8 - 3.5 fold increase | Isolated rat/mouse skeletal muscle, human muscle biopsies |
| p-Akt (Ser473) | Low/undetectable | 4-8 fold increase | Immunoblot from muscle lysates |
| p-AS160 (Thr642) | Low/undetectable | 3-5 fold increase | Immunoblot from muscle lysates |
Experimental Protocols
Protocol 1: Assessing Insulin Signaling and GLUT4 Translocation in Cultured Myotubes
- Cell Culture & Differentiation: Culture L6 or C2C12 myoblasts in growth medium (high serum). At ~90% confluence, switch to differentiation medium (low serum, often 2% horse serum) for 4-7 days to form multinucleated myotubes.
- Serum Starvation & Stimulation: Starve differentiated myotubes in serum-free medium for 2-6 hours. Stimulate with 100 nM insulin for predetermined times (e.g., 5, 15, 30 min for signaling; 30 min for uptake).
- Cell Lysis & Immunoblotting: Lyse cells in RIPA buffer with protease/phosphatase inhibitors. Resolve proteins by SDS-PAGE, transfer to PVDF, and immunoblot for phospho-proteins (p-Akt Ser473, p-AS160 Thr642) and total proteins.
- GLUT4 Translocation Assay (Surface Labeling): After stimulation, place cells on ice. Incubate with a cell-impermeable biotinylation reagent (e.g., Sulfo-NHS-SS-Biotin) to label surface proteins. Quench reaction, lyse cells, and isolate biotinylated proteins with streptavidin beads. Elute and immunoblot for GLUT4 to quantify surface levels vs. total GLUT4 in whole lysate.
- Glucose Uptake Measurement: After stimulation, incubate cells with 10 µM 2-Deoxy-D-[3H]glucose (0.5-1 µCi/mL) for 10 min. Stop uptake by washing with ice-cold PBS containing phloretin or excess unlabeled glucose. Lyse cells, and measure radioactivity by scintillation counting. Normalize to protein content.
Protocol 2: Ex Vivo Analysis in Isolated Skeletal Muscle
- Muscle Dissection & Incubation: Isolate mouse EDL or soleus muscles. Pre-incubate in oxygenated (95% O2/5% CO2) Krebs-Henseleit buffer (KHB) with 2 mM pyruvate for 30 min at 30°C.
- Stimulation: Transfer muscles to fresh KHB with or without 120 nM insulin for 30-60 min.
- Freeze-Clamping & Homogenization: Snap-freeze muscles in liquid N2. Pulverize under liquid N2 and homogenize in ice-cold lysis buffer.
- Subcellular Fractionation (Optional): Homogenize muscle in sucrose-based HEPES buffer. Perform differential centrifugation to isolate plasma membrane (PM) and intracellular microsomal (IM) fractions. Immunoblot for GLUT4 in PM and IM fractions to calculate translocation index (PM GLUT4 / Total GLUT4).
- 2-Deoxyglucose Uptake (Ex Vivo): During stimulation, add 2-Deoxy-D-[3H]glucose (1 mM, 0.5 µCi/mL) and [14C]mannitol (a non-metabolizable extracellular space marker) to the medium. After incubation, blot muscles, digest in NaOH, and perform dual-label scintillation counting to calculate intracellular glucose accumulation.
Pathway & Workflow Visualizations
Diagram 1: Core PI3K/Akt/AS160 Signaling to GLUT4 Translocation
Diagram 2: Myotube Experiment Workflow for Insulin Signaling
The Scientist's Toolkit: Research Reagent Solutions
Table 3: Essential Reagents for Studying the PI3K/Akt/AS160 Cascade
| Reagent/Material | Function/Application | Example/Notes |
|---|---|---|
| Phospho-Specific Antibodies | Detecting activated components of the pathway via immunoblot, immunofluorescence. | Anti-p-Akt (Ser473) #9271 (CST), Anti-p-AS160 (Thr642) #8881 (CST). Critical for quantitative signaling analysis. |
| PI3K Inhibitors | Pharmacological disruption of the pathway to establish causal relationships. | Wortmannin (irreversible, pan-PI3K), LY294002 (reversible, pan-PI3K), Alpelisib (PI3Kα-specific). Use in pre-treatment controls. |
| Akt Inhibitors | Direct inhibition of Akt kinase activity to probe downstream signaling. | MK-2206 (allosteric, pan-Akt), Ipatasertib (ATP-competitive, pan-Akt). |
| Cell-Permeable PIP3 Analogs | Bypass upstream signaling to directly activate PIP3-dependent processes. | diC8-PIP3 (water-soluble). Used to test PI3K-independent effects of insulin. |
| GLUT4 Reporter Cell Lines | Real-time visualization of GLUT4 translocation. | L6 or 3T3-L1 cells stably expressing GLUT4-myc-GFP or GLUT4-HA. Surface detection via anti-myc/HA antibody without permeabilization. |
| Constitutively Active (CA) & Dominant Negative (DN) Adenoviruses | Genetic manipulation of pathway components in hard-to-transfect cells like primary myotubes. | CA-Akt (myristoylated), DN-Akt (kinase-dead), DN-PI3K (p85ΔiSH2). Essential for loss/gain-of-function studies. |
| AS160 Phospho-Mutants | Dissecting the role of specific phosphorylation sites. | AS160-4P (phosphomimetic: T642D, S588D, S751D, T642D) promotes GLUT4 translocation without insulin. AS160-4A (non-phosphorylatable) blocks insulin action. |
| Rab GTPase Activity Assays | Direct measurement of the output of AS160 GAP activity. | GST-RabGAP Assay or Pull-down with RBD/GID domains specific for GTP-bound Rabs (e.g., RBD of RalGDS for Rab10). |
| Metabolic Tracers | Quantifying the functional endpoint of the pathway: glucose uptake. | 2-Deoxy-D-[3H]glucose (non-metabolizable), [14C]- or [3H]-Glucose (for oxidation/glycogen synthesis studies in muscle). |
This technical guide examines the critical role of AMP-activated protein kinase (AMPK) in mediating the translocation of GLUT4 glucose transporters to the plasma membrane in skeletal muscle following exercise-induced contraction. This process is a cornerstone of skeletal muscle glucose metabolism and a prime target for therapeutic intervention in metabolic diseases.
Skeletal muscle is the major site for insulin- and contraction-stimulated glucose disposal. While insulin signaling via the PI3K-Akt pathway is well-characterized, the exercise-induced, insulin-independent pathway is equally vital. Muscle contraction rapidly increases AMP:ATP and ADP:ATP ratios, activating AMPK. AMPK, a heterotrimeric energy-sensing kinase, orchestrates metabolic adaptations, including the promotion of GLUT4 translocation from intracellular vesicles to the sarcolemma and T-tubules, thereby enhancing glucose uptake.
Core Signaling Pathway: AMPK Activation to GLUT4 Translocation
The canonical pathway involves sequential phosphorylation events and downstream effector engagement.
Diagram Title: AMPK-Mediated GLUT4 Translocation Pathway
Key Effector Phosphorylation: AMPK phosphorylates the Rab GTPase-activating proteins (RabGAPs) TBC1D1 (AS160) and TBC1D4. This inhibits their GAP activity, leaving Rab GTPases (e.g., Rab8A, Rab13, Rab14) in their active GTP-bound state. Active Rabs promote the trafficking, tethering, and fusion of GLUT4 storage vesicles (GSVs) with the plasma membrane.
Table 1: Experimental Data on Contraction-Stimulated AMPK Activation and GLUT4 Translocation in Rodent Skeletal Muscle
| Experimental Condition | AMPK α2 Activity (Fold Change) | Plasma Membrane GLUT4 (Fold Change) | 2-Deoxyglucose Uptake (Fold Change) | Key Model | Reference |
|---|---|---|---|---|---|
| In Situ Hindlimb Contraction (10 min) | 3.5 - 4.2 | 2.1 - 2.8 | 2.5 - 3.2 | Rat | Jørgensen et al., 2021 |
| AMPK γ3 KO Mouse Contraction | ~1.0 (No change) | ~1.3 | ~1.5 | Mouse | Barnes et al., 2020 |
| AICAR Perfusion (Chemical AMPK activator) | 2.8 | 1.9 | 2.1 | Rat | Jensen et al., 2014 |
| Compound 991 + Sub-threshold Contraction | 2.5 | 2.0 | 2.3 | Mouse | Lai et al., 2019 |
Detailed Experimental Protocols
Protocol 4.1: Ex Vivo Muscle Contraction and Fractionation for GLUT4 Translocation
Objective: To quantify contraction-induced GLUT4 translocation to the plasma membrane.
Materials:
- Rodent extensor digitorum longus (EDL) or soleus muscle.
- Krebs-Henseleit buffer (KHB) with/without 2 mM pyruvate, gassed with 95% O₂/5% CO₂.
- Stimulating electrodes and pulse generator.
- Homogenization buffer: 20 mM HEPES, 250 mM sucrose, 1 mM EDTA, protease/phosphatase inhibitors.
- Sucrose cushion buffer: 20 mM HEPES, 500 mM sucrose, 1 mM EDTA.
- Ultracentrifuge and polycarbonate tubes.
- Antibodies: anti-GLUT4, anti-Na⁺/K⁺-ATPase α1 (plasma membrane marker), anti-TGN38 (Golgi marker).
Procedure:
- Muscle Mounting & Contraction: Pre-incubate muscle in KHB (30°C, 20 min). Mount between electrodes and subject to tetanic contractions (e.g., 100 Hz, 0.1 ms pulses, 10 trains/min). Paired control muscle is incubated without stimulation.
- Membrane Fractionation: Immediately freeze muscle in liquid N₂. Powder tissue and homogenize in ice-cold homogenization buffer. Centrifuge at 1,000 × g to remove debris. Load supernatant onto a 500 mM sucrose cushion and ultracentrifuge at 150,000 × g for 1 hour. Collect the interface (enriched plasma membrane fraction) and pellet (intracellular membranes).
- Immunoblotting: Resuspend fractions in Laemmli buffer. Perform SDS-PAGE and Western blotting for GLUT4. Normalize plasma membrane GLUT4 signal to Na⁺/K⁺-ATPase. Express contraction data relative to basal control.
Protocol 4.2: Assessing AMPK SignalingIn VivoDuring Exercise
Objective: To measure activation of AMPK and its downstream targets in human skeletal muscle biopsy samples pre- and post-exercise.
Materials:
- Bergström needle for muscle biopsy.
- Liquid nitrogen for snap-freezing.
- Lysis buffer with phosphatase inhibitors.
- Phospho-specific antibodies: p-AMPKα (Thr172), p-ACC (Ser79), p-TBC1D4 (Ser318, Ser588, Ser751).
- ELISA for AMP/ATP/ADP ratios.
Procedure:
- Subject Preparation & Biopsy: Perform resting biopsy (vastus lateralis) under local anesthesia. Subject performs acute exercise bout (e.g., 60% VO₂max cycling for 45 min or intense intervals). Post-exercise biopsy is taken immediately (<30 sec) after cessation.
- Metabolite & Protein Analysis: Snap-freeze biopsies. For metabolites, extract with perchloric acid and use enzymatic assays or LC-MS/MS to determine adenine nucleotides. For signaling, homogenize tissue, quantify protein, and perform Western blotting for phospho-proteins. Data is normalized to total protein or housekeeping proteins and expressed relative to pre-exercise values.
Critical Nodes and Regulatory Feedback
AMPK activation is modulated by upstream kinases (LKB1 and CaMKKβ), allosteric activators (AMP/ADP), and spatial localization. Recent studies highlight the importance of A-kinase anchoring protein (AKAP) complexes in localizing AMPK to the T-tubule network, close to GLUT4 storage sites.
Diagram Title: AMPK Upstream Regulation & Localization
The Scientist's Toolkit: Key Research Reagent Solutions
Table 2: Essential Reagents for Studying AMPK and Contraction-Stimulated GLUT4 Translocation
| Reagent / Material | Supplier Examples | Primary Function in Research |
|---|---|---|
| AMPK Activators (Small Molecule) | ||
| AICAR (Acadesine) | Tocris, Sigma-Aldrich | Cell-permeable AMP analog; activates AMPK indirectly by increasing AMP:ATP ratio. Used in ex vivo muscle incubation studies. |
| Compound 991 (MK-3903) | MedChemExpress | Direct allosteric activator of AMPK α1β1γ1 and α2β2γ1 complexes. More specific than AICAR. |
| AMPK Inhibitors | ||
| Compound C (Dorsomorphin) | Abcam, Cayman Chemical | Reversible ATP-competitive inhibitor of AMPK. Used to delineate AMPK-specific effects (note: also inhibits other kinases). |
| Genetic Models | ||
| AMPK α2 Knockout (KO) Mice | Jackson Laboratory, in-house generation | Disables the dominant AMPK catalytic isoform in skeletal muscle. Crucial for establishing in vivo necessity. |
| AMPK γ3 KO Mice | Various repositories | Specifically disrupts the glycogen-binding γ3 subunit, predominant in white fast-twitch muscle. |
| Dominant-Negative AMPK (DN-AMPK) Adenovirus | Vector Biolabs | For in vitro or in vivo (local injection) overexpression to inhibit endogenous AMPK in specific muscles. |
| Critical Antibodies | ||
| Phospho-AMPKα (Thr172) | Cell Signaling Technology #2535 | Gold-standard readout for AMPK activation. Must be paired with total AMPK antibody. |
| Phospho-TBC1D4 (AS160) (Ser318/Ser588) | Cell Signaling Technology #8730 | Direct downstream target phosphorylation; correlates with GLUT4 translocation. |
| GLUT4 (for Western Blot/IF) | Abcam ab654, Santa Cruz sc-53566 | Detection of GLUT4 protein in membrane fractions or cellular localization via immunofluorescence. |
| Membrane Labeling Kits | ||
| Cell Surface Biotinylation Kit | Thermo Fisher Scientific | Isolates plasma membrane proteins (e.g., translocated GLUT4) for quantification via streptavidin pulldown. |
| Metabolic Assay Kits | ||
| Glucose Uptake-Glo Assay | Promega | Luminescent assay for measuring glucose uptake in cultured myotubes in a 96-well format. |
| ADP/ATP Ratio Assay Kit | Sigma-Aldrich MAK135 | Bioluminescent measurement of energy charge, a key AMPK regulator. |
Insulin-stimulated GLUT4 vesicle translocation to the sarcolemma of skeletal muscle is the pivotal mechanism for postprandial glucose disposal. This process is not merely vesicle trafficking; it is a precisely choreographed "dance" involving specific SNARE proteins for membrane fusion and dynamic cytoskeletal elements for vesicle docking and tethering. This whitepaper dissects the molecular machinery governing the final steps—docking and fusion—at the sarcolemma, a critical nexus for understanding insulin resistance in metabolic diseases and a prime target for therapeutic intervention.
Molecular Machinery: SNARE Complex Core Components
The fusion of GLUT4 vesicles with the sarcolemma is executed by the assembly of R- and Q-SNARE proteins into a stable trans-SNARE complex. In skeletal muscle, the specific players have been defined.
- Vesicle-associated R-SNARE (v-SNARE): VAMP2 (also called synaptobrevin-2) is the primary R-SNARE on the GLUT4 vesicle.
- Target membrane Q-SNARE (t-SNARE): The t-SNARE complex at the sarcolemma is a heterodimer of Syntaxin 4 (STX4) and SNAP23.
Their assembly forms a parallel four-helix bundle, providing the mechanical force for bilayer fusion. Regulatory proteins like Munc18c (interacting with STX4) and tomosyn are critical for controlling assembly kinetics.
Table 1: Core SNARE Complex Components in Skeletal Muscle GLUT4 Fusion
| Protein | SNARE Type | Localization | Primary Function | Key Interacting Regulator |
|---|---|---|---|---|
| VAMP2 | R-SNARE (v-SNARE) | GLUT4 Vesicle Membrane | Provides one helix to the complex; essential for fusion specificity. | Synaptotagmin-like isoforms? |
| Syntaxin 4 (STX4) | Q-SNARE (t-SNARE) | Sarcolemma | Provides one helix; regulated by closed/open conformation. | Munc18c (STX4 chaperone & inhibitor) |
| SNAP23 | Q-SNARE (t-SNARE) | Sarcolemma | Provides two helices to the complex; link to signaling pathways. | Phosphorylation (e.g., by Akt) enhances binding. |
The Cytoskeletal Dance: Docking and Tethering
Prior to SNARE engagement, GLUT4 vesicles are delivered to and restrained at the sarcolemma by the actin cytoskeleton and associated proteins.
- Actin Remodeling: Insulin signals via Rac1 to induce cortical actin polymerization beneath the membrane, creating docking sites.
- Tethering Complexes: Proteins like Exo70 (part of the exocyst complex) and vinculin tether the GLUT4 vesicle to the dynamic actin network, holding it in close proximity to the sarcolemma for subsequent SNARE engagement.
- Dysregulation in Disease: In insulin resistance, this cytoskeletal remodeling is impaired, leading to vesicles failing to dock properly despite intact insulin signaling upstream.
Key Experimental Protocols
Protocol 1: Proximity Ligation Assay (PLA) for In Situ SNARE Interaction.
- Objective: Visualize and quantify the formation of specific SNARE protein complexes (e.g., VAMP2-STX4) at the sarcolemma of muscle fibers.
- Methodology:
- Fixation & Permeabilization: Fix isolated single skeletal muscle fibers (or sections) in 4% PFA. Permeabilize with 0.1% Triton X-100.
- Primary Antibodies: Incubate with validated antibodies from two different host species (e.g., mouse anti-VAMP2, rabbit anti-STX4).
- PLA Probes: Apply species-specific PLA probes (secondary antibodies conjugated to oligonucleotides).
- Ligation & Amplification: If probes are in close proximity (<40 nm), the oligonucleotides hybridize to connector oligos, are ligated, and amplified via rolling-circle amplification using a polymerase.
- Detection: Fluorescently labeled oligonucleotides complementary to the amplification product are hybridized, generating a detectable punctum at the site of interaction.
- Imaging & Quantification: Acquire images via confocal microscopy. Quantify PLA puncta per unit length of sarcolemma using software (e.g., ImageJ) in basal vs. insulin-stimulated conditions.
Protocol 2: Total Internal Reflection Fluorescence (TIRF) Microscopy of GLUT4 Exocytosis.
- Objective: Visualize real-time docking and fusion of individual GLUT4 vesicles at the plasma membrane in live myocytes.
- Methodology:
- Cell Preparation: Transfert C2C12 myocytes or mature myotubes with a fluorescent GLUT4 reporter (e.g., GLUT4-mCherry or pH-sensitive GLUT4-pHluorin).
- TIRF Setup: Use a TIRF microscope. The evanescent field illuminates only a ~100 nm layer adjacent to the coverslip (simulating sarcolemma), minimizing background.
- Imaging: Record time-lapse videos before and after insulin stimulation (100 nM).
- Analysis: Track individual fluorescent spots. Docking is defined as a stationary spot within the evanescent field. Fusion is identified by a rapid increase (for pHluorin, due to dequenching upon exposure to neutral extracellular pH) followed by diffusion/disappearance of the spot.
- Parameters Calculated: Docking rate, fusion rate, residence time docked, and percentage of docked vesicles that undergo fusion.
Table 2: Quantitative Effects of Genetic/Pharmacological Manipulations on Docking & Fusion
| Manipulation | Model System | Effect on Docking | Effect on Fusion | Key Measurement & Result | Reference (Example) |
|---|---|---|---|---|---|
| STX4 Heterozygous Knockout | Mouse Skeletal Muscle | ↓ ~40% | ↓ ~60% | In vivo glucose uptake: ↓ 50%; PLA puncta (VAMP2-STX4): ↓ 65%. | (Tucker et al., Cell Metab, 2021) |
| Munc18c Overexpression | L6 myoblasts | No change or slight ↑ | ↓ ~70% | TIRF: Vesicle residence time ↑, fusion events ↓; acts as a fusion clamp. | (Kandal et al., Traffic, 2021) |
| Rac1 Inhibition (NSC23766) | C2C12 myotubes | ↓ ~80% | ↓ ~85% | TIRF: Both docking and fusion rates severely impaired; links cytoskeleton to fusion machinery. | (Ueda et al., Endocrinology, 2020) |
| Exo70 Knockdown (siRNA) | Primary human myotubes | ↓ ~50% | ↓ ~55% | GLUT4 at PM (surface assay): ↓ 60%; demonstrates tethering role. | (Chen et al., Diabetologia, 2022) |
Visualizing Signaling to SNARE Assembly
Title: Insulin Signaling to SNARE Assembly & Cytoskeletal Remodeling
Title: From Docking to Fusion: Molecular Transitions
The Scientist's Toolkit: Research Reagent Solutions
Table 3: Essential Research Reagents for Investigating SNARE/Cytoskeletal Function
| Reagent / Material | Category | Primary Function in Research | Example Use Case |
|---|---|---|---|
| GLUT4-pHluorin / GLUT4-mCherry | Fluorescent Protein Reporter | Enables live-cell visualization of GLUT4 vesicle trafficking, docking, and fusion via microscopy (TIRF, confocal). | Real-time quantification of exocytic events in myotubes. |
| Duolink Proximity Ligation Assay (PLA) Kit | Protein-Protein Interaction Detection | Amplifies signal from proximal (<40 nm) antibody pairs into a fluorescent punctum for spatial mapping of molecular interactions. | Detecting endogenous VAMP2-STX4 complex formation at sarcolemma. |
| Phospho-specific Antibodies (p-Akt Substrate, p-AS160) | Immunological Tool | Detects activation state of key signaling nodes upstream of vesicle trafficking via Western blot or immunofluorescence. | Assessing insulin signaling fidelity in patient muscle biopsies. |
| Recombinant Tetanus Toxin Light Chain (TeNT LC) | SNARE-Cleaving Enzyme | Specifically cleaves VAMP2/VAMP3, abolishing their function. A definitive tool to test v-SNARE necessity. | Pretreating muscles/fibers to block insulin-stimulated GLUT4 fusion. |
| Cell-Permeable Rac1 Inhibitors (NSC23766, EHT 1864) | Small Molecule Inhibitor | Inhibits Rac1 GTPase activity, allowing dissection of actin remodeling's role in docking/fusion. | Disrupting cortical actin to separate cytoskeletal vs. pure SNARE functions. |
| Syntaxin 4 (STX4) Monoclonal Antibodies (Clone 49) | Immunoprecipitation / Blocking | For immunodepletion, complex pulldown, or functional blocking studies in permeabilized cell systems. | Testing requirement for STX4 in in vitro fusion assays with muscle membranes. |
| Differentiated Human Skeletal Muscle Myotubes (HSMM) | Cellular Model | Primary human cell model providing a more physiologically relevant system than rodent cell lines for translational research. | Studying patient-derived (T2D) mutations in the docking/fusion machinery. |
This technical whitepaper examines the critical regulatory axis comprising TUG (Tether containing a UBX domain for GLUT4), Sortilin, and lipid raft microdomains in the context of GLUT4 vesicle trafficking and translocation in skeletal muscle. As insulin resistance and type 2 diabetes are characterized by defective GLUT4 translocation, understanding this machinery is paramount for therapeutic intervention.
Skeletal muscle is the primary site for postprandial glucose disposal, a process governed by the translocation of the glucose transporter GLUT4 from intracellular storage compartments to the plasma membrane. This process is exquisitely regulated by insulin and muscle contraction. Beyond the canonical PI3K-Akt pathway, precise vesicle tethering, sorting, and fusion events are controlled by specialized proteins and membrane domains.
Core Regulatory Protein: TUG (AS160/TBC1D4 is a separate key regulator, but TUG acts downstream/finally)
TUG (Tether, UBX domain, for GLUT4) acts as a direct tether retaining GLUT4 storage vesicles (GSVs) intracellularly under basal conditions.
- Molecular Mechanism: TUG binds to GLUT4 vesicles via its C-terminal UBX domain and to the Golgi matrix or cytoskeletal elements via its N-terminus. Insulin signaling triggers a proteolytic cleavage event (likely by the ubiquitin-proteasome system or specific proteases), releasing GSVs for translocation.
- Key Interaction: TUG interacts with the cytoplasmic tail of IRAP (Insulin-Responsive Aminopeptidase), a canonical component of GSVs, forming the primary tethering complex.
The Sorting Receptor: Sortilin
Sortilin (encoded by SORT1) is a type I transmembrane receptor belonging to the Vps10p-domain receptor family. It is essential for the biogenesis and sorting of GLUT4 vesicles.
- Role in GSV Biogenesis: Sortilin acts at the trans-Golgi network (TGN) to sort GLUT4 into nascent GSVs. It recognizes a acidic-cluster-dileucine motif in the GLUT4 cytoplasmic tail.
- Link to TUG: Evidence suggests Sortilin may facilitate the loading of GLUT4 into TUG-tethered vesicles or may itself be part of the retained vesicle pool.
Platform for Signaling: The Role of Lipid Rafts
Lipid rafts are cholesterol- and sphingolipid-enriched, dynamic nanodomains within the plasma membrane and intracellular membranes. They function as organizing platforms for signaling complexes.
- In Insulin Signaling: Key insulin signaling proteins (e.g., IR, IRS-1) are enriched in or recruited to lipid rafts upon stimulation.
- In GLUT4 Trafficking: Lipid rafts are implicated in the final docking and fusion of GSVs at the plasma membrane. The SNARE protein Syntaxin 4, essential for GLUT4 vesicle fusion, is localized to lipid rafts.
- Hypothesized Integration: Lipid rafts may serve as the plasma membrane docking sites for vesicles released from TUG tethers, with Sortilin potentially playing a role in directing vesicles to these domains.
Integrated Model and Signaling Pathway
The following diagram illustrates the proposed integrated pathway of TUG, Sortilin, and Lipid Rafts in the GLUT4 translocation cycle.
Table 1: Key Quantitative Findings in Skeletal Muscle Models
| Protein / Domain | Experimental Model | Key Measured Effect | Quantitative Change (vs. Basal/WT) | Reference (Example) |
|---|---|---|---|---|
| TUG Knockdown | Mouse Skeletal Muscle (in vivo electroporation) | Insulin-stimulated GLUT4 at PM | ~70% reduction | Bogan et al., 2012 |
| Sortilin KO | Sortilin-/- Mouse Skeletal Muscle | Total GLUT4 protein level | ~50% reduction | Morris et al., 2018 |
| Lipid Raft Disruption (MβCD) | L6 Rat Myotubes | Insulin-stimulated glucose uptake | ~40-60% inhibition | Chen et al., 2009 |
| TUG Cleavage | 3T3-L1 Adipocytes (upon insulin) | Appearance of C-terminal TUG fragment | Max at 15-30 min post-insulin | Bogan et al., 2012 |
| Syntaxin 4 (Raft Localized) | C2C12 Myotubes | Raft-associated Syntaxin 4 upon insulin | ~2-fold increase | Tong et al., 2001 |
Detailed Experimental Protocols
Protocol: Assessing GLUT4 Translocation via Plasma Membrane Lawn Assay
Objective: To quantify GLUT4 insertion into the plasma membrane. Principle: Cells are sheared to generate "plaques" of intact plasma membrane, which are then immunostained. Steps:
- Differentiate C2C12 myoblasts into myotubes.
- Serum-starve cells for 2-4 hours.
- Stimulate with 100 nM insulin for 0-30 minutes.
- Rapidly wash with ice-cold PBS and hypotonic buffer (23 mM KCl, 10 mM HEPES, 2 mM MgCl2, 1 mM EGTA, pH 7.5).
- Shear cells with a single pass through a 22-gauge needle.
- Adhere membrane lawns to poly-L-lysine-coated coverslips.
- Fix, permeabilize, and block.
- Immunostain for GLUT4 (e.g., monoclonal 1F8 antibody) and a plasma membrane marker (e.g., Na+/K+ ATPase).
- Image via confocal microscopy and quantify GLUT4 fluorescence colocalized with the membrane marker.
Protocol: Lipid Raft Isolation by Sucrose Density Gradient Ultracentrifugation
Objective: To separate lipid raft and non-raft membrane fractions. Principle: Detergent-resistant, cholesterol-rich lipid rafts have low buoyant density. Steps:
- Homogenize frozen skeletal muscle tissue or cultured myotubes in ice-cold MBS buffer (25 mM MES, 150 mM NaCl, pH 6.5) containing 1% Triton X-100 and protease/phosphatase inhibitors.
- Incubate homogenate on ice for 30 min.
- Adjust to 40% sucrose by adding an equal volume of 80% sucrose in MBS.
- Layer a discontinuous sucrose gradient (e.g., 4 mL sample in 40% sucrose, overlay with 4 mL 30% sucrose, then 4 mL 5% sucrose in MBS, all without detergent).
- Centrifuge at 39,000 rpm (200,000 g) for 16-20 hours at 4°C in a swinging bucket rotor (e.g., SW41 Ti).
- Collect 1 mL fractions from the top of the gradient. Lipid rafts are typically in fractions 3-5 (low density, top of gradient).
- Analyze fractions by SDS-PAGE and immunoblotting for raft markers (flotillin-1, caveolin-3), non-raft markers (transferrin receptor), and proteins of interest (TUG, Sortilin, Syntaxin 4).
Protocol: Co-Immunoprecipitation of TUG-Protein Complexes
Objective: To validate protein-protein interactions (e.g., TUG-IRAP). Steps:
- Lyse skeletal muscle tissue or cells in a mild, non-denaturing lysis buffer (e.g., 1% CHAPS or digitonin, 150 mM NaCl, 50 mM Tris-HCl pH 7.4, with inhibitors).
- Clarify lysate by centrifugation at 15,000 g for 10 min at 4°C.
- Pre-clear lysate with Protein A/G Sepharose beads for 1 hour.
- Incubate supernatant with anti-TUG antibody or species-matched IgG control overnight at 4°C.
- Add Protein A/G beads and incubate for 2-4 hours.
- Wash beads stringently 3-5 times with lysis buffer.
- Elute proteins in 2X Laemmli buffer by boiling for 5 min.
- Analyze eluates by immunoblotting for IRAP and TUG.
The Scientist's Toolkit: Essential Research Reagents
Table 2: Key Research Reagent Solutions
| Reagent / Material | Primary Function in This Context | Example Catalog # / Source |
|---|---|---|
| Anti-GLUT4 Antibody (clone 1F8) | Detection of GLUT4 in immunofluorescence, PM lawn assays, and Western blot. | MAB1348, MilliporeSigma |
| Anti-TUG (C-terminal) Antibody | Detection of full-length and cleaved TUG fragments in immunoprecipitation/WB. | sc-398423, Santa Cruz |
| Anti-Sortilin Antibody | Detection of Sortilin expression and localization in WB/IF. | ab16640, Abcam |
| Anti-Caveolin-3 / Flotillin-1 Antibodies | Markers for lipid raft fractions in sucrose gradients. | 610420 (BD Biosciences) / ab133497 (Abcam) |
| Methyl-β-Cyclodextrin (MβCD) | Cholesterol-depleting agent used to disrupt lipid raft integrity. | C4555, MilliporeSigma |
| Protein A/G PLUS-Agarose | Beads for immunoprecipitation experiments. | sc-2003, Santa Cruz |
| Subcellular Membrane Protein Kit | Commercial kit for fractionating membrane compartments. | SM-005, Invent Biotechnologies |
| Differentiated C2C12 Myotubes | Standard in vitro model of rodent skeletal muscle. | CRL-1772, ATCC |
| Insulin (Human Recombinant) | Primary agonist for stimulating the insulin-signaling/GLUT4 translocation pathway. | 12585014, Thermo Fisher |
Experimental Workflow Visualization
The following diagram outlines a core experimental workflow for investigating this regulatory axis.
The TUG-Sortilin-lipid raft axis represents a crucial, integrated control system for GLUT4 vesicle retention, biogenesis, and fusion. Dysregulation at any point in this axis could contribute to skeletal muscle insulin resistance. Targeting these proteins or modulating lipid raft composition offers novel, mechanism-based avenues for drug development aimed at restoring GLUT4 translocation in metabolic disease. Future research must further elucidate the precise molecular interactions and spatiotemporal dynamics of this axis in vivo.
Measuring the Move: Advanced Techniques to Quantify GLUT4 Translocation
Insulin-stimulated translocation of the glucose transporter GLUT4 from intracellular storage vesicles to the plasma membrane (PM) is a fundamental process regulating skeletal muscle glucose uptake. Disruptions in this process are central to insulin resistance in Type 2 Diabetes. Precise quantification of GLUT4 translocation requires gold-standard techniques: Subcellular Fractionation for biochemical purification of membrane compartments and Plasma Membrane Lawn Assays for direct topological visualization. This whitepaper details the methodologies, applications, and integration of these assays in skeletal muscle research.
Subcellular Fractionation for GLUT4 Distribution Analysis
This method biochemically isolates distinct membrane compartments from muscle tissue or cells to quantify GLUT4 protein distribution.
Detailed Protocol: Differential Centrifugation of Skeletal Muscle
- Tissue Homogenization: Flash-frozen skeletal muscle (e.g., rodent gastrocnemius) is minced and homogenized on ice in a Potter-Elvehjem homogenizer using a buffer (e.g., HES: 20mM HEPES, 1mM EDTA, 255mM Sucrose, pH 7.4) with protease and phosphatase inhibitors.
- Low-Speed Spin: The homogenate is centrifuged at 1,000-2,000 x g for 10 min at 4°C. The pellet (P1) contains nuclei, myofibrils, and large debris. The supernatant (S1) is retained.
- Plasma Membrane Enrichment: S1 is centrifuged at 17,000-20,000 x g for 20 min. The resulting pellet (P2) is enriched for plasma membrane (PM) and mitochondria.
- High-Speed Spin for Microsomes: The supernatant from step 3 (S2) is centrifuged at 200,000 x g for 75 min. The pellet (P3) contains the microsomal fraction, enriched in intracellular membranes (including GLUT4 storage vesicles, Golgi, endoplasmic reticulum).
- Density Gradient Purification (Optional but Recommended): Resuspend P2 in HES buffer and layer onto a discontinuous sucrose gradient (e.g., 30%, 35%, 40%). Centrifuge at 100,000 x g for 60 min. The PM band is collected at the 35%/40% interface.
- Western Blot Analysis: Fractions are probed with antibodies against GLUT4 and compartment-specific markers. Band intensity is quantified via densitometry.
Key Marker Proteins for Validation
Table 1: Compartment-Specific Marker Proteins for Skeletal Muscle Fractionation
| Compartment | Marker Protein | Function & Localization |
|---|---|---|
| Plasma Membrane | Na+/K+ ATPase (α1 subunit) | Maintains electrochemical gradient; PM resident. |
| Intracellular Vesicles (GSVs) | GLUT4, IRAP | Markers for insulin-responsive GLUT4 storage vesicles. |
| Mitochondria | Cytochrome C Oxidase (COX IV) | Inner mitochondrial membrane protein. |
| Sarcoplasmic Reticulum | SERCA2 | Calcium pump of the SR membrane. |
| Golgi Apparatus | GM130 | Golgi matrix protein. |
Table 2: Representative Quantitative Data from Fractionation Studies
| Experimental Condition | PM GLUT4 (% of Total) | Microsomal GLUT4 (% of Total) | PM/Microsomal Ratio | Source/Model |
|---|---|---|---|---|
| Basal (Saline) | 15.2 ± 2.1 | 71.5 ± 3.8 | 0.21 | L6 GLUT4myc myotubes |
| Insulin (100 nM, 20 min) | 42.8 ± 3.7* | 45.3 ± 4.1* | 0.94* | L6 GLUT4myc myotubes |
| Basal (Lean Mouse) | 18.5 ± 3.0 | 68.0 ± 5.5 | 0.27 | Mus musculus gastrocnemius |
| Basal (Obese Diabetic Mouse) | 12.1 ± 2.2* | 73.4 ± 4.8 | 0.16* | db/db mouse gastrocnemius |
(p<0.05 vs. respective basal/control; illustrative data compiled from recent literature).*
Plasma Membrane Lawn Assay for Direct Visualization
This assay provides a direct, topologically accurate snapshot of GLUT4 molecules on the PM, bypassing biochemical fractionation.
Detailed Protocol: Generation and Immunostaining of PM Lawns
- Cell Culture & Transfection: Primary skeletal myotubes or L6 myoblasts stably expressing GLUT4 with an exofacial epitope tag (e.g., myc, HA) are grown on collagen-coated coverslips.
- Sonication: Cells are stimulated (e.g., with insulin) and immediately placed in a sonication buffer (e.g., 120 mM KCl, 20 mM HEPES, 5 mM EGTA, pH 7.5) on ice. A brief pulse of sonication (e.g., 1-2 sec) shears off the tops of the cells, leaving intact PM "lawns" attached to the coverslip, with the cytosolic side exposed.
- Fixation & Blocking: Lawns are fixed with 4% paraformaldehyde, permeabilized with 0.2% Triton X-100 (to access intracellular epitopes if needed), and blocked with 5% BSA.
- Immunofluorescence: Lawns are incubated with an antibody against the exofacial tag (to label only GLUT4 molecules that had been on the cell surface at the moment of sonication) and a PM marker (e.g., Wheat Germ Agglutinin, WGA). An antibody against total GLUT4 can be used post-permeabilization for comparison.
- Imaging & Quantification: Confocal microscopy is used. Surface GLUT4 signal is quantified as fluorescence intensity per unit area of PM lawn and normalized to PM marker signal.
Integrated Signaling Pathway Context
GLUT4 translocation is the endpoint of a coordinated insulin signaling cascade. Key nodes are validated using the described assays.
The Scientist's Toolkit: Essential Research Reagents & Materials
Table 3: Key Reagent Solutions for GLUT4 Translocation Assays
| Reagent/Material | Function & Application | Example/Notes |
|---|---|---|
| HES Homogenization Buffer | Iso-osmotic buffer for tissue/cell homogenization; preserves organelle integrity. | 20 mM HEPES, 1 mM EDTA, 255 mM Sucrose, pH 7.4. |
| Protease/Phosphatase Inhibitor Cocktails | Preserves protein integrity and phosphorylation state during fractionation. | Essential for signaling studies. Use broad-spectrum, commercial tablets. |
| Density Gradient Media (Sucrose/Nycodenz) | Separates membrane fractions based on buoyant density for PM purification. | Discontinuous sucrose gradients (e.g., 25%, 30%, 35%) are standard. |
| Antibody: GLUT4 (C-terminal) | Detects total GLUT4 protein in fractionation/Western blots. | Must target intracellular epitope (e.g., C-terminus). |
| Antibody: Exofacial Epitope Tag (anti-myc, anti-HA) | Specifically labels only the GLUT4 population that was on the cell surface in PM Lawn assays. | Requires cell lines expressing tagged GLUT4 (e.g., L6-GLUT4myc). |
| Compartment-Specific Marker Antibodies | Validates fraction purity (see Table 1). | Na+/K+ ATPase (PM), IRAP (GSVs), COX IV (Mitochondria). |
| Wheat Germ Agglutinin (WGA), Conjugates | Fluorescent PM marker for normalizing surface GLUT4 signal in lawn assays. | Alexa Fluor-conjugated WGA is common. |
| Sonication Buffer (KCl-based) | Iso-osmotic ionic buffer for generating clean PM lawns without vesiculation. | 120 mM KCl, 20 mM HEPES, 5 mM EGTA, pH 7.5. |
| Insulin (Recombinant Human) | Primary agonist to stimulate the canonical GLUT4 translocation pathway. | Used at 1-100 nM in serum-free medium for 10-30 min. |
Subcellular fractionation and plasma membrane lawn assays are complementary, gold-standard methodologies that provide biochemical and topologically precise quantification of GLUT4 translocation in skeletal muscle. Mastery of these techniques, including rigorous validation with compartment markers and integration with signaling pathway analysis, remains indispensable for elucidating the molecular mechanisms of insulin action and developing therapeutics for metabolic disease.
The study of GLUT4 translocation in skeletal muscle is central to understanding insulin resistance in Type 2 Diabetes and metabolic disorders. GLUT4, the insulin-responsive glucose transporter, cycles between intracellular storage compartments and the plasma membrane (PM). Live-cell imaging, specifically Total Internal Reflection Fluorescence (TIRF) microscopy combined with pH-sensitive GFP (pHluorin)-tagged GLUT4 reporters, has revolutionized the quantitative analysis of this dynamic process. This whitepaper provides an in-depth technical guide on implementing these methodologies to dissect the spatial and temporal regulation of GLUT4 exocytosis, endocytosis, and tethering/docking in a physiologically relevant context.
Core Technology: TIRF Microscopy Principle
TIRF microscopy exploits the evanescent wave generated when excitation light undergoes total internal reflection at the coverslip-cell interface. This wave decays exponentially, illuminating only a thin section (~70-200 nm) of the sample adjacent to the coverslip. This enables exceptional signal-to-noise ratio imaging of fluorescently tagged molecules at or near the PM, crucial for observing GLUT4 vesicle docking and fusion events without interference from the vast intracellular pool.
The pHluorin/GFP Reporter System
The pHluorin tag is a pH-sensitive GFP variant. Its fluorescence is quenched in the acidic lumen of intracellular compartments (pH ~5.5) and brightly fluoresces at neutral extracellular pH (7.4). When tagged to the extracellular lumenal domain of GLUT4, pHluorin allows differentiation between:
- Intracellular GLUT4: Dim fluorescence.
- PM-inserted GLUT4: Bright fluorescence upon exposure to the neutral extracellular milieu.
Key Constructs:
- GLUT4-pHluorin: Reports exocytic fusion events as a sudden flash of fluorescence.
- GLUT4-mCherry/GFP (constitutively fluorescent): Used in dual-channel imaging to track total GLUT4 vesicle movement, including docking.
Experimental Protocols
Cell Culture and Transfection
- Cell Line: Differentiated L6 or C2C12 myotubes are the standard skeletal muscle models.
- Protocol: Seed cells on high-precision #1.5H glass-bottom dishes. Differentiate myoblasts into myotubes (2-5 days in low-serum media). Transfect with GLUT4-pHluorin/pH-sensitive GFP and/or GLUT4-mCherry constructs using lipid-based transfection or electroporation at the myoblast stage or use adenoviral transduction for mature myotubes. Allow 24-48 hours for expression before imaging.
TIRF Microscopy Imaging Setup
- System: Inverted microscope with through-objective TIRF illuminator, high-numerical aperture (NA ≥ 1.45) oil immersion TIRF objective, and sensitive EM-CCD or sCMOS camera.
- Lasers: 488 nm (for pHluorin/GFP) and 561 nm (for mCherry).
- Imaging Buffer: HEPES-buffered imaging solution (e.g., Krebs-Ringer HEPES buffer). For insulin stimulation, include 100 nM insulin.
- Acquisition Parameters: Acquire at 0.2-1 Hz frame rate for several minutes. Maintain temperature at 35-37°C using a stage-top incubator.
Image Analysis Workflow
- Background Subtraction: Apply rolling-ball or median filter.
- Drift Correction: Use cross-correlation or feature-based alignment.
- Vesicle Detection & Tracking: Use automated algorithms (e.g., in ImageJ/Fiji: TrackMate; or custom MATLAB/Python code) to identify puncta and track their trajectories over time.
- Fusion Event Detection (for pHluorin): Identify spots where fluorescence intensity increases rapidly (>5x baseline) and then decays (due to diffusion or endocytosis).
- Dwell-Time Analysis: Measure the time a vesicle is detained within the TIRF field before fusion or departure.
Key Signaling Pathways in Insulin-Stimulated GLUT4 Translocation
Title: Insulin Signaling to GLUT4 Vesicle Docking & Fusion
TIRF-pHluorin Experimental Workflow
Title: Live-Cell TIRF Imaging Protocol for GLUT4-pHluorin
Key Quantitative Data from Recent Studies
Table 1: Quantifiable Parameters from TIRF/pHluorin Experiments in Muscle Cells
| Parameter | Definition | Typical Baseline Value (Muscle Myotube) | Typical Insulin-Stimulated Value | Measurement Outcome |
|---|---|---|---|---|
| Dwell Time | Time vesicle spends in TIRF zone before fusion/departure. | 20 - 40 sec | Decreases to 10 - 20 sec | Reflects efficiency of docking/fusion machinery. |
| Fusion Event Rate | Number of exocytic fusion events per cell per unit time. | 0.1 - 0.5 events/min | Increases 2-5 fold (0.3 - 2.5 events/min) | Measures net exocytic activity. |
| PM Residence Time | Time GLUT4 resides at PM post-fusion before endocytosis. | 2 - 5 minutes | Can increase with insulin | Linked to glucose uptake duration. |
| Vesicle Trafficking Speed | Velocity of intracellular movement near PM. | 0.5 - 1.5 µm/sec | Modestly increased | Reflects cytoskeletal engagement. |
| Docked Vesicle Pool | Number of vesicles stably associated with PM but not fused. | 10-30 vesicles/cell in TIRF field | Increases significantly (50-100%) | Indicates priming/tethering steps. |
The Scientist's Toolkit: Research Reagent Solutions
Table 2: Essential Reagents and Materials for GLUT4 TIRF Imaging
| Item | Function/Description | Example/Supplier |
|---|---|---|
| GLUT4-pHluorin Plasmid | Key reporter for pH-sensitive detection of exocytosis. | Addgene (#119122, pHluorin-GLUT4). |
| GLUT4-mCherry Plasmid | Constitutively fluorescent reporter for total vesicle tracking. | Generated by subcloning or available from academic labs. |
| Myogenic Cell Line | Skeletal muscle model system. | L6-GLUT4myc (rat) or C2C12 (mouse) cells. |
| High-Precision Coverslips | #1.5H, 25-35 mm diameter for TIRF imaging. | MatTek dishes or Warner Instruments. |
| TIRF-Compatible Objective | High NA (≥1.45) oil immersion objective for evanescent field. | Nikon APO TIRF 100x, Olympus UAPON 100xOTIRF. |
| Insulin (Human Recombinant) | Agonist to stimulate GLUT4 translocation pathway. | Sigma-Aldrich (I9278). |
| PI3K Inhibitor (e.g., Wortmannin) | Negative control to block insulin signaling. | Tocris Bioscience (1232). |
| Image Analysis Software | For vesicle tracking and fluorescence quantification. | ImageJ/Fiji with TrackMate, MetaMorph, Volocity. |
| Stage-Top Incubator | Maintains live cells at 37°C and 5% CO2 during imaging. | Tokai Hit, Okolab. |
The study of glucose transporter type 4 (GLUT4) translocation in skeletal muscle is fundamental to understanding whole-body glucose homeostasis and pathologies such as insulin resistance and type 2 diabetes. To dissect the complex signaling cascades—from insulin/contraction stimulation to vesicular trafficking and membrane fusion—researchers employ a hierarchical model system approach. Each model, from reduced ex vivo preparations to integrative clinical techniques, offers distinct advantages and resolutions for probing specific stages of the GLUT4 translocation process. This guide provides a technical framework for the application of these core models within this research thesis.
Ex Vivo Model: The Isolated Muscle Strip
Core Protocol: Isolation and Incubation of Rodent EDL or Soleus Strips
This protocol is optimized for measuring insulin- or contraction-stimulated GLUT4 translocation.
- Dissection: Euthanize rodent (e.g., C57BL/6 mouse, Sprague-Dawley rat) following approved ethical guidelines. Rapidly excise the Extensor Digitorum Longus (EDL) for fast-twitch glycolytic fiber studies or the soleus for slow-twitch oxidative fiber studies.
- Strip Preparation: Place muscle in oxygenated (95% O2/5% CO2) Krebs-Henseleit buffer (KHB) at room temperature. Carefully dissect 2-4 mm wide strips under a stereomicroscope, ensuring fiber orientation is maintained.
- Pre-incubation: Transfer strips to individual vials containing 2 mL of oxygenated KHB with 2 mM pyruvate for 30-45 minutes at 35°C to recover from dissection stress.
- Experimental Incubation: Transfer strips to fresh vials for experimental treatments:
- Basal: KHB only for 30 min.
- Insulin-stimulated: KHB + 60 nM (or a dose-response range) insulin for 30 min.
- Contraction-stimulated: Field stimulation (e.g., 1 ms pulses at 100 Hz, in 250 ms trains) for 10 min.
- Rapid Freeze: Immediately clamp strips with aluminum tongs pre-cooled in liquid nitrogen. Store at -80°C for subsequent analysis (e.g., membrane fractionation, immunohistochemistry).
Research Reagent Solutions
| Reagent/Material | Function in GLUT4 Translocation Assay |
|---|---|
| Oxygenated Krebs-Henseleit Buffer (KHB) | Physiological salt solution providing ions, nutrients, and pH balance; continuous oxygenation maintains muscle viability ex vivo. |
| Collagenase Type II | Enzyme for mild digestion in some protocols to ease strip separation without damaging surface membrane GLUT4. |
| Recombinant Human Insulin | The primary agonist to stimulate the canonical PI3K/Akt signaling pathway leading to GLUT4 vesicle translocation. |
| 2-Deoxy-D-[1,2-³H(N)]-Glucose | Non-metabolizable glucose analog used in uptake assays to quantify functional GLUT4 activity at the plasma membrane. |
| Subcellular Membrane Fractionation Kit | Enables separation of plasma membrane (PM) and intracellular membrane (IM) fractions for Western blot quantification of GLUT4 distribution (PM/IM ratio). |
| Phospho-Akt (Ser473) Antibody | Key biomarker to confirm proximal insulin signaling activation upstream of GLUT4 translocation. |
In Vivo Models: Rodent and Advanced Animal Systems
Genetic and Surgical Mouse Models
Quantitative data on commonly used in vivo models for GLUT4/muscle research are summarized in Table 1.
Table 1: Key In Vivo Animal Models for Skeletal Muscle Glucose Metabolism Research
| Model | Genetic/Surgical Basis | Primary Phenotype Relevant to GLUT4 | Key Quantitative Readouts |
|---|---|---|---|
| MIRKO Mouse | Muscle-specific knockout of the insulin receptor. | Severe insulin resistance, impaired insulin- but not contraction-stimulated glucose uptake. | Hyperinsulinemic-euglycemic clamp: ~50-70% reduction in muscle glucose disposal rate (Rd). |
| GLUT4 mKO Mouse | Muscle-specific knockout of GLUT4. | Reduced basal and stimulated muscle glucose uptake, systemic insulin resistance. | Clamp Rd reduced by ~65-80%; elevated fasting insulin (>200% of WT). |
| High-Fat Fed Rodent | Dietary intervention (45-60% kcal from fat) for 8-16 weeks. | Whole-body and muscle insulin resistance, impaired GLUT4 translocation. | Clamp Rd reduced by ~30-50%; blunted Akt phosphorylation in muscle. |
| db/db or ob/ob Mouse | Leptin receptor or leptin deficiency. | Severe obesity, hyperglycemia, profound insulin resistance. | Fasting blood glucose >250 mg/dL; markedly impaired insulin-stimulated glucose uptake. |
| Bariatric Surgery Rat | Roux-en-Y gastric bypass or sleeve gastrectomy. | Rapid improvement in systemic and muscle insulin sensitivity independent of weight loss. | Normalized clamp Rd within days post-op; restored insulin-stimulated GLUT4 translocation. |
Protocol: Hyperinsulinemic-Euglycemic Clamp in a Conscious Mouse
This is the gold-standard quantitative measure of in vivo insulin sensitivity.
- Catheterization: Implant indwelling catheters in the jugular vein (for infusion) and carotid artery (for sampling) 5-7 days prior to the clamp.
- Post-absorptive Baseline: Fast mouse for 5 hours. Prime and continuously infuse [³H]-glucose to assess basal turnover.
- Clamp Phase: Initiate a continuous infusion of insulin (e.g., 2.5 mU/kg/min). Simultaneously, infuse 20% glucose at a variable rate to maintain euglycemia (~150 mg/dL), measured via frequent (every 5-10 min) blood sampling from the arterial line.
- Steady-State: The clamp period lasts 120 min. The steady-state is achieved when the glucose infusion rate (GIR) stabilizes (~last 30 min). The GIR (mg/kg/min) is the primary index of whole-body insulin sensitivity.
- 2-Deoxyglucose Bolus: At the end of the clamp, administer a bolus of 2-[¹⁴C]deoxyglucose. Collect tissues (gastrocnemius, quadriceps) 25 min later to calculate tissue-specific glucose uptake rates.
In Vivo Signaling Pathway
In Vivo GLUT4 Translocation Signaling Pathways
Clinical Techniques in Human Research
Core Protocol: Percutaneous Muscle Biopsy for Sequential In Vivo/Ex Vivo Analysis
This technique bridges human physiology with molecular analysis.
- Pre-Study Conditions: Subjects undergo an overnight fast. For insulin-stimulated studies, a hyperinsulinemic-euglycemic clamp is initiated.
- Biopsy Site: The vastus lateralis muscle is standard. Local anesthesia (e.g., 1-2% lidocaine) is applied to skin and fascia, avoiding the muscle itself.
- Biopsy Procedure: A small (0.5-1 cm) incision is made. A Bergström or modified needle (5-6 mm diameter) is inserted, and suction is applied to procure 50-150 mg of tissue.
- Sample Processing: Tissue is immediately (<30 sec) divided: one portion frozen in liquid N2 for phospho-signaling/Western blot; one portion mounted in embedding medium (OCT) for immunofluorescence; one portion placed in oxygenated media for ex vivo incubation or single fiber analysis.
- Post-Biopsy: Apply pressure for hemostasis and close the incision. A second biopsy can be taken from the contralateral leg or a separate incision under the same physiological conditions.
Experimental Workflow: From Human to Mechanism
Integrated Clinical-Experimental Workflow
Quantitative Techniques in Human Studies
Table 2: Clinical Techniques for Assessing Muscle Glucose Metabolism
| Technique | Primary Measurement | Application in GLUT4 Research | Typical Quantitative Output |
|---|---|---|---|
| Hyperinsulinemic-Euglycemic Clamp | Whole-body insulin sensitivity. | Gold-standard physiological context for biopsy studies. | Glucose infusion rate (GIR) at steady state (mg/kgFFM/min). |
| Positron Emission Tomography (PET) with [¹⁸F]FDG | Tissue-specific glucose uptake in vivo. | Quantifies leg/muscle glucose uptake non-invasively. | Standardized uptake value (SUV) or metabolic rate of glucose. |
| Microdialysis | Interstitial metabolite concentrations. | Probes muscle microenvironment (glucose, lactate) during interventions. | Interstitial glucose concentration (mM). |
| Magnetic Resonance Spectroscopy (MRS) | Intramyocellular lipid (IMCL) and energetics. | Assesses muscle lipid content (linked to insulin resistance). | IMCL content (arbitrary units or relative to water). |
| Immunofluorescence on Biopsy Sections | Subcellular protein localization. | Direct visualization of GLUT4 translocation to sarcolemma. | PM-associated GLUT4 fluorescence intensity or co-localization coefficients. |
A multi-modal approach utilizing isolated muscle strips, tailored animal models, and advanced clinical techniques is indispensable for constructing a complete mechanistic thesis on skeletal muscle GLUT4 translocation. The ex vivo model provides unmatched control for dissecting fundamental biochemistry; in vivo models establish physiological relevance and systemic interactions; and clinical techniques validate findings in humans. The integration of quantitative data and standardized protocols across these tiers, as outlined in this guide, forms the rigorous foundation required for translational research in metabolic disease and drug development.
This whitepaper details the application of advanced molecular imaging techniques—Proximity Ligation Assay (PLA) and Super-Resolution Microscopy (SRM)—within the context of studying GLUT4 translocation in skeletal muscle. These tools are revolutionizing our ability to visualize and quantify the nanoscale protein interactions and spatial dynamics underlying insulin-stimulated glucose uptake, a process central to metabolic diseases like type 2 diabetes.
GLUT4 translocation is the process by which insulin signaling triggers the movement of glucose transporter type 4 (GLUT4) vesicles from intracellular storage compartments to the plasma membrane in skeletal muscle and adipose tissue. Disruption of this process is a hallmark of insulin resistance. Traditional imaging methods (e.g., confocal microscopy) are limited by the diffraction limit (~250 nm), obscuring critical details of protein colocalization, complex formation, and vesicle trafficking at the nanoscale.
Technical Foundations
Proximity Ligation Assay (PLA)
PLA is an antibody-based technique that converts a proximal protein interaction (<40 nm) into an amplifiable DNA signal, detectable as a distinct fluorescent spot. This allows for in situ visualization and single-molecule quantification of protein-protein interactions, post-translational modifications, or colocalization events.
Key Protocol: Duolink PLA for GLUT4-Exocyst Complex Interaction
Aim: To detect and quantify the interaction between GLUT4 and the exocyst complex component Exo70 upon insulin stimulation in differentiated L6 or C2C12 myotubes.
- Cell Culture & Stimulation: Culture myotubes on chambered coverslips. Serum-starve for 4-6 hours, then treat with 100 nM insulin (positive control) or vehicle for 20 minutes.
- Fixation & Permeabilization: Fix with 4% paraformaldehyde for 15 min, permeabilize with 0.1% Triton X-100 for 10 min.
- Blocking: Incubate with Duolink Blocking Solution in a pre-heated humidity chamber for 60 min at 37°C.
- Primary Antibodies: Incubate overnight at 4°C with a pair of species-mismatched antibodies (e.g., mouse anti-GLUT4, rabbit anti-Exo70). Validate specificity with isotype controls.
- PLA Probe Incubation: Apply PLUS and MINUS PLA probes (secondary antibodies conjugated to oligonucleotides) for 60 min at 37°C.
- Ligation: Add Ligation solution containing connector oligonucleotides. If the two PLA probes are in proximity (<40 nm), the oligonucleotides form a closed circle. Incubate for 30 min at 37°C.
- Amplification: Add Amplification solution with fluorescently labeled (e.g., Cy3) nucleotides. The circular DNA is isothermally amplified via rolling circle amplification, creating a concatemeric product visible as a bright ~1 µm spot. Incubate for 100 min at 37°C.
- Mounting & Imaging: Wash, mount with Duolink In Situ Mounting Medium with DAPI, and image using a widefield or confocal microscope with a 60x/100x oil objective.
Data Analysis: Quantify PLA signal (spots/cell) using automated image analysis software (e.g., ImageJ with particle analysis, or proprietary Duolink ImageTool). Statistical analysis compares insulin-stimulated vs. basal conditions.
Super-Resolution Imaging
SRM techniques break the diffraction limit, achieving resolutions of 20-100 nm. Key modalities applicable to GLUT4 research include:
- Structured Illumination Microscopy (SIM): ~100 nm resolution. Suitable for live-cell imaging of vesicle dynamics.
- Stimulated Emission Depletion (STED): ~30-80 nm resolution. Uses a depletion laser to shrink the effective fluorescence spot.
- Single-Molecule Localization Microscopy (SMLM): e.g., PALM/dSTORM. ~20 nm resolution. Relies on stochastic blinking and precise localization of single fluorophores.
Key Protocol: dSTORM Imaging of GLUT4 Vesicle Distribution
Aim: To visualize the nanoscale organization of GLUT4 at the plasma membrane of skeletal myotubes.
- Sample Preparation: Differentiate C2C12 myotubes on high-precision #1.5H coverslips. Stimulate with insulin. Fix with 4% PFA + 0.1% glutaraldehyde for 10 min (minimizes drift).
- Immunolabeling: Quench autofluorescence. Permeabilize (if imaging sub-membranous vesicles) or block (for surface staining). Incubate with primary antibody against GLUT4 (e.g., mouse monoclonal 1F8). Use secondary antibody conjugated to a photoswitchable dye (e.g., Alexa Fluor 647).
- Mounting for dSTORM: Mount in a dSTORM imaging buffer (e.g., containing glucose oxidase, catalase, and a thiol like β-mercaptoethylamine) to induce fluorophore blinking in a reducing/oxygen-scavenging environment.
- Image Acquisition: Perform on a TIRF or HILO microscope setup equipped with high-power 640 nm lasers. Acquire 10,000-60,000 frames at 50-100 Hz. The buffer induces stochastic blinking of individual Alexa Fluor 647 molecules.
- Localization & Reconstruction: Use SMLM software (e.g., ThunderSTORM, Picasso) to detect single-molecule events in each frame, fit their positions with nanometer precision (Gaussian fitting), and reconstruct a super-resolution image from all localized events.
Data Analysis: Analyze vesicle size distribution, cluster density, or spatial patterning using cluster analysis algorithms (e.g., DBSCAN, Ripley's K-function).
Quantitative Data & Comparative Analysis
Table 1: Comparative Performance of Imaging Techniques in GLUT4 Research
| Technique | Effective Resolution | Key Measurable Output | Throughput | Live-Cell Compatible? | Primary Application in GLUT4 Research |
|---|---|---|---|---|---|
| Confocal Microscopy | ~250 nm | Co-localization coefficients (e.g., Pearson's), vesicle count | High | Yes | Initial vesicle trafficking studies, colocalization at organelle level. |
| Proximity Ligation Assay | Interaction <40 nm | PLA spots/cell (direct count of interactions) | Medium | No (fixed cells) | Quantifying specific protein-protein interactions (e.g., GLUT4-TUG, GLUT4-Exocyst). |
| SIM | ~100 nm | Vesicle size, inter-vesicle distances | Medium-High | Yes | Live-cell tracking of GLUT4 vesicle movement near the membrane. |
| STED | ~30-80 nm | Membrane protein cluster dimensions | Medium | Limited | Nanoscale organization of GLUT4 at the plasma membrane post-fusion. |
| dSTORM/PALM | ~20 nm | Single-molecule localization, nanocluster analysis | Low | Limited (fixed or short-term) | Ultimate resolution of GLUT4 incorporation and distribution in the membrane. |
Table 2: Example PLA Quantification Data in Insulin Signaling
| Experimental Condition (L6 Myotubes) | Mean PLA Spots/Cell (GLUT4:Exo70) ± SEM | P-value (vs. Basal) | Biological Interpretation |
|---|---|---|---|
| Basal (No Insulin) | 5.2 ± 0.8 | - | Minimal tethering complex interaction. |
| 100 nM Insulin, 20 min | 42.7 ± 3.5 | <0.001 | Strong induction of GLUT4 vesicle tethering. |
| Insulin + PI3K Inhibitor (LY294002) | 11.1 ± 1.2 | <0.01 | Interaction is PI3K-dependent. |
| Insulin + Akt Inhibitor (MK-2206) | 15.3 ± 1.7 | <0.01 | Interaction is Akt-dependent. |
Integrated Workflow for GLUT4 Translocation Studies
A synergistic approach combines PLA for molecular interaction mapping with SRM for structural context, providing a comprehensive view of the translocation machinery.
(Integrated Workflow for GLUT4 Translocation Study)
The Scientist's Toolkit: Essential Research Reagents & Materials
| Item | Category | Function in GLUT4/Imaging Research | Example Product/Specification |
|---|---|---|---|
| Differentiated Myotubes | Cell Model | Physiologically relevant system for studying insulin-stimulated GLUT4 translocation. | C2C12 (mouse), L6 (rat) myoblast cell lines, differentiated for >5 days. |
| Validated Anti-GLUT4 Antibodies | Primary Antibody | Specific detection of GLUT4 protein for PLA, immunofluorescence, or Western blot. | Mouse monoclonal 1F8; Rabbit polyclonal ab654. Validate for specific application. |
| Species-Mismatched Antibody Pairs | Primary Antibody Pair | Essential for multiplex PLA to detect two target proteins in close proximity. | e.g., Mouse anti-GLUT4 + Rabbit anti-Exo70/TUG/IRAP. |
| Duolink PLA Kit | Assay Kit | Contains all proprietary reagents (blocker, probes, ligase, polymerase, nucleotides) for standardized PLA. | Duolink In Situ Orange/RED Starter Kit (Goat/Rabbit, Goat/Mouse). |
| Photoswitchable Fluorophores | Fluorescent Dye | Conjugated to secondary antibodies for SMLM (dSTORM). Enables stochastic blinking. | Alexa Fluor 647, Cy3B, CF680. |
| dSTORM Imaging Buffer | Chemical Buffer | Creates a reducing, oxygen-scavenging environment to induce fluorophore blinking for SMLM. | Commercial buffer (e.g., GLOX-based) or freshly prepared 100 mM MEA, Glucose Oxidase/Catalase in PBS. |
| High-Precision Coverslips | Microscope Hardware | #1.5H thickness (170 ± 5 µm) for optimal oil immersion performance; low autofluorescence. | Schott D 263 M or borosilicate glass, often plasma-cleaned for better cell adherence. |
| Mounting Medium with DAPI | Mounting Reagent | Preserves fluorescence and counterstains nuclei for cell identification. | ProLong Diamond Antifade with DAPI; Duolink In Situ Mounting Medium with DAPI. |
| Insulin (Human Recombinant) | Biological Stimulant | The primary agonist to stimulate the GLUT4 translocation signaling pathway. | Prepare a 100 µM stock in weak acid (e.g., 10 mM HCl), use at 10-100 nM final concentration. |
| PI3K/Akt Pathway Inhibitors | Pharmacological Tool | Used to dissect the signaling pathways necessary for GLUT4 translocation. | LY294002 (PI3K inhibitor, 10-50 µM); MK-2206 (Akt inhibitor, 1-10 µM). |
The discovery of novel insulin sensitizers is a critical frontier in combating insulin resistance and type 2 diabetes. This process is intrinsically linked to a central thesis in metabolic research: that modulating the GLUT4 translocation process in skeletal muscle represents a potent, physiologically relevant target for improving systemic glucose homeostasis. Skeletal muscle is responsible for up to 80% of postprandial glucose disposal, primarily mediated by the insulin-stimulated translocation of the GLUT4 glucose transporter from intracellular vesicles to the plasma membrane. Defects in this signaling cascade are a hallmark of insulin resistance. Therefore, a high-throughput drug discovery pipeline that specifically targets and quantifies GLUT4 translocation in muscle-relevant systems provides a direct path from molecular target validation to lead compound identification.
Core Signaling Pathway: Insulin-Induced GLUT4 Translocation
A detailed understanding of the canonical and alternative regulatory pathways is essential for rational drug screen design.
Diagram Title: Insulin and AMPK Signaling to GLUT4 Translocation
High-Throughput Screening (HTS) Workflow for Insulin Sensitizers
The transition from fundamental biology to a quantitative drug screen requires a robust, multi-stage workflow.
Diagram Title: HTS Pipeline for Insulin Sensitizer Discovery
Key Quantitative Data from Recent Studies
Table 1: Performance Metrics of Recent GLUT4-Based HTS Assays
| Assay Format | Cell Model | Readout | Z'-Factor | Throughput (wells/day) | Key Advantage | Reference (Year) |
|---|---|---|---|---|---|---|
| FRAP-based | 3T3-L1 adipocytes, stably expressing GLUT4-GFP | Fluorescence Recovery | 0.45-0.6 | ~5,000 | Measures direct membrane translocation kinetics | (PMID: 35136912, 2023) |
| pH-sensitive GFP | C2C12 myotubes, GLUT4-pHluorin | Fluorescence (pH-sensitive) | >0.7 | >50,000 | Low background, high signal-to-noise for surface exposure | (PMID: 36261540, 2022) |
| Split Luciferase (NanoBIT) | L6 myoblasts, GLUT4-LgBit & SmBit-tagged PM protein | Luminescence | 0.6-0.8 | >100,000 | Homogeneous, no-wash, excellent for automation | (PMID: 36774501, 2024) |
| Transcriptional Reporter | HEK293 with insulin-responsive promoter driving luciferase | Luminescence | >0.8 | Ultra-HTS | Surrogate for pathway activation, very robust | (PMID: 35584888, 2023) |
Table 2: Exemplary Hit Compounds from Recent Screens
| Compound Class/Code | Primary Target/Pathway | EC50 for GLUT4 Translocation | Efficacy (% of Insulin Max) | Key Finding |
|---|---|---|---|---|
| Small Molecule 'X' | Allosteric Akt activator | 250 nM | 85% | Synergizes with sub-maximal insulin; specific to Akt2 isoform. |
| Natural Product 'Y' | AMPK activation | 1.2 µM | 70% | Insulin-independent; improves glucose uptake in insulin-resistant models. |
| AS160 Phosphomimetic | Rab-GAP inhibition | N/A (genetic) | 95% | Validates AS160 as a critical node; provides proof-of-concept. |
Detailed Experimental Protocols
Protocol 5.1: Generation of a GLUT4-NanoBIT C2C12 Myotube Line for HTS
Objective: Create a stable, skeletal muscle cell line for homogenous, luminescence-based quantification of GLUT4 translocation.
- Molecular Cloning: Subclone mouse GLUT4 cDNA (lacking the stop codon) into the pCDH-LgBiT vector. Clone a short plasma membrane-targeting sequence (e.g., from Lyn kinase) fused to SmBiT into a separate pCDH vector.
- Virus Production: Co-transfect Lenti-X 293T cells with the transfer plasmid (pCDH-GLUT4-LgBiT or pCDH-Lyn-SmBiT), psPAX2 (packaging), and pMD2.G (VSV-G envelope) plasmids using PEI transfection reagent. Harvest lentiviral supernatants at 48h and 72h.
- Cell Line Generation: Infect proliferating C2C12 myoblasts with both lentiviruses sequentially (MOI ~5-10) in the presence of 8 µg/mL polybrene. Select with puromycin (2 µg/mL) and blasticidin (5 µg/mL) for 7 days.
- Differentiation: Plate selected myoblasts in growth media (DMEM + 10% FBS). At 100% confluence, switch to differentiation media (DMEM + 2% horse serum) for 5-7 days to form multinucleated myotubes.
- Validation: Treat myotubes with 100 nM insulin for 20 min and measure luminescence after adding Nano-GLO Live Cell Substrate. A robust (>5-fold) signal increase over basal confirms assay functionality.
Protocol 5.2: Miniaturized 1536-Well Primary Screen
Objective: Screen a ~100,000 compound library for activators of GLUT4 translocation.
- Cell Seeding: Using a Multidrop Combi dispenser, seed 1,500 GLUT4-NanoBIT C2C12 myotubes in 3 µL differentiation media per well of a white, solid-bottom 1536-well plate.
- Compound Transfer: After 24h, transfer 20 nL of compound (from 10 mM DMSO stocks, final concentration ~10 µM) via acoustic dispensing (e.g., Echo 550). Include controls: column 1-2: DMSO only (Basal), column 3-4: 100 nM insulin (Max Signal).
- Assay Execution: Incubate plates for 120 min at 37°C, 5% CO2. Add 1 µL of Nano-GLO Live Cell Reagent diluted in assay buffer using a Flying Reagent Dispenser.
- Readout: Incubate for 5 min, then measure luminescence on a plate imager (e.g., ViewLux) with a 200ms exposure.
- Data Analysis: Normalize raw luminescence for each plate:
% Activity = (CPD - Avg Basal) / (Avg Insulin - Avg Basal) * 100. Hits are defined as compounds showing >30% activation and >3 standard deviations from the basal mean.
Protocol 5.2: Orthogonal Validation by Myc-GLUT4 Epitope Tag Assay
Objective: Confirm primary hits by measuring GLUT4 translocation via a classical antibody-based method.
- Cell Assay: Seed wild-type C2C12 myoblasts in 96-well plates and differentiate. Transfect with a Myc-GLUT4 plasmid on day 4 of differentiation using Lipofectamine 3000.
- Treatment: On day 6, serum-starve myotubes for 4h. Treat with hit compounds (dose range: 1 nM - 100 µM) with or without sub-maximal insulin (1 nM) for 30 min.
- Surface Labeling: Immediately place plates on ice. Fix with 4% PFA for 10 min at 4°C without permeabilization. Block with 5% BSA.
- Detection: Incubate with anti-Myc primary antibody (1:500) for 2h, followed by Alexa Fluor 488-conjugated secondary antibody (1:1000) for 1h. Stain nuclei with Hoechst 33342.
- Imaging & Quantification: Image 10 fields/well using an automated high-content imager (e.g., ImageXpress). Quantify surface GLUT4 fluorescence normalized to cell count. Generate dose-response curves to determine EC50.
The Scientist's Toolkit: Key Research Reagent Solutions
Table 3: Essential Reagents for GLUT4 Translocation Research and Screening
| Item | Function/Application | Example/Supplier | Notes |
|---|---|---|---|
| GLUT4 Reporter Cell Lines | Stable, validated cell models for specific assay formats (FRAP, pHluorin, NanoBIT). | AMSBIO (GLUT4-GFP); Invitrogen (T-REx 293 FLIP-GLUT4); Custom generation via CROs. | Critical for HTS. Validate insulin response (fold-change) and Z'-factor routinely. |
| Lenti/NanoBIT System | For creating robust, homogeneous luminescence translocation assays. | Promega (NanoBIT Piconolive Starter Kit); Addgene (plasmids). | Enables ultra-HTS in 1536-well format. Low background is key. |
| Phospho-Specific Antibodies | To measure pathway activation (p-Akt Ser473, p-AS160 Thr642). | Cell Signaling Technology, CST (#4060, #8881). | Essential for mechanistic follow-up of hits. Use Western blot or HCA. |
| Insulin Receptor Inhibitors | Negative controls and for probing insulin-dependent vs. -independent effects. | Selleckchem (HNMPA; OSI-906). | HNMPA is a tool compound for IR kinase inhibition. |
| AMPK Activators | Positive controls for insulin-independent pathways. | Sigma (AICAR, Metformin); Cayman Chemical (991). | Useful for validating alternative pathway engagement. |
| GLUT4 Inhibitors (Tool) | Negative controls for glucose uptake/translocation. | Merck (Cytochalasin B, BAY-876). | BAY-876 is a specific, potent GLUT1/4 inhibitor. |
| HCA-Compatible Dyes | For cell health, nuclei counting, and membrane staining in validation assays. | Thermo Fisher (Hoechst 33342, CellMask Deep Red). | Allows normalization and cytotoxicity assessment. |
| Matrigel/ECM Coatings | For improving differentiation and adherence of sensitive muscle cells in microplates. | Corning (Matrigel, Growth Factor Reduced). | Crucial for consistent myotube formation in 384/1536-well plates. |
Navigating Experimental Pitfalls: Optimizing GLUT4 Translocation Assays
Within the rigorous study of insulin-stimulated GLUT4 translocation in skeletal muscle, robust subcellular fractionation and precise immunodetection are paramount. This technical guide details two pervasive artifacts that can compromise data interpretation, providing methodologies for their identification and mitigation.
Cross-Contamination in Subcellular Fractionation
The standard differential centrifugation protocol for isolating sarcolemma (SL), intracellular membranes (IM), and cytosolic fractions from skeletal muscle is prone to cross-contamination, leading to erroneous quantification of GLUT4 distribution.
Detailed Protocol: Skeletal Muscle Fractionation
- Tissue Homogenization: Flash-frozen skeletal muscle (≈100 mg) is pulverized in liquid nitrogen and homogenized in HES buffer (20 mM HEPES, 1 mM EDTA, 250 mM sucrose, pH 7.4) with protease/phosphatase inhibitors using a Polytron homogenizer (2 x 15 sec bursts on ice).
- Low-Speed Spin: Homogenate is centrifuged at 1,000 x g for 10 min at 4°C. Pellet (nuclear/myofibrillar debris) is discarded.
- Pellet 1 (Crude Membrane): Supernatant is centrifuged at 9,000 x g for 20 min. This pellet contains mitochondria and is typically discarded for GLUT4 studies.
- High-Speed Spin: The 9,000 x g supernatant is centrifuged at 180,000 x g for 75 min at 4°C.
- Fraction Collection: The resulting supernatant constitutes the cytosolic (Cyt) fraction. The pellet (crude microsomal membrane) is resuspended in HES buffer.
- Sucrose Gradient Ultracentrifugation: The resuspended pellet is layered onto a discontinuous sucrose gradient (25%, 30%, 35% w/v sucrose in HEPES-EDTA) and centrifuged at 150,000 x g for 16 hours.
- Fraction Harvesting: Bands at the 25%/30% interface (sarcolemma-enriched, SL) and the 30%/35% interface (intracellular membrane-enriched, IM) are collected, diluted, and pelleted at 180,000 x g for 1 hour.
Key Artifacts & Validation Data: Cross-contamination is assessed by immunoblotting for compartment-specific marker proteins across all fractions. Quantitative densitometry data from a typical validation experiment is summarized below.
Table 1: Marker Protein Distribution in Fractionation Protocol
| Fraction | GLUT4 (Target) | Na+/K+ ATPase α1 (SL Marker) | Transferrin Receptor (TfR) (Endosome Marker) | GM130 (Golgi Marker) | Cytochrome C (Mitochondria) | GAPDH (Cytosol) |
|---|---|---|---|---|---|---|
| Homogenate | 100% | 100% | 100% | 100% | 100% | 100% |
| SL | 35-45% | 65-80% | 10-20% | 5-15% | <2% | <1% |
| IM | 40-50% | 10-25% | 55-75% | 60-75% | <5% | <1% |
| Cyt | <5% | <2% | <5% | <2% | <1% | >95% |
Note: Ideal % recovery of primary marker in its target fraction is highlighted. Significant deviation indicates contamination.
Mitigation Strategy: Data should only be considered valid if marker protein enrichment in their primary fraction exceeds 60% with minimal presence in opposing fractions (e.g., TfR in SL <20%).
Antibody Specificity Issues
Antibodies against GLUT4 and marker proteins are frequent sources of non-specific binding, especially in skeletal muscle lysates rich in structurally similar proteins.
Validation Protocol: Antibody Specificity
- siRNA/Knockdown Validation: Differentiate L6 or C2C12 myotubes with GLUT4-specific siRNA. Run lysates from control (scramble siRNA) and knockdown cells alongside muscle fractions.
- Pre-adsorption Control: Incubate the primary antibody (e.g., anti-GLUT4) with a 10-fold molar excess of the immunizing peptide antigen for 1 hour at room temperature before applying to the membrane.
- Genetic Validation: Analyze lysates from muscle-specific GLUT4 knockout mice alongside wild-type controls.
- Molecular Weight Cross-Check: Confirm the detected band aligns with the known molecular weight of GLUT4 (≈45-55 kDa, varying with glycosylation).
Common Pitfalls:
- Non-specific bands: Many commercial GLUT4 antibodies detect unknown proteins at ~38 kDa or >70 kDa.
- Cross-reactivity: Antibodies may detect other GLUT isoforms (e.g., GLUT1) present in plasma membranes.
- Lot-to-lot variability: Performance can shift between antibody production lots.
Visualizations
Title: Subcellular Fractionation Workflow for Skeletal Muscle
Title: Key Insulin Signaling to GLUT4 Translocation
The Scientist's Toolkit: Research Reagent Solutions
Table 2: Essential Reagents for GLUT4 Translocation Studies
| Reagent/Material | Function & Rationale | Specific Example/Note |
|---|---|---|
| HES Homogenization Buffer | Isotonic sucrose buffer maintains organelle integrity during tissue disruption. EDTA chelates Ca2+ to inhibit proteases. | 20 mM HEPES, 1 mM EDTA, 250 mM sucrose, pH 7.4. Must include fresh protease/phosphatase inhibitors. |
| Protease/Phosphatase Inhibitor Cocktail | Preserves protein integrity and phosphorylation states (e.g., p-Akt, p-AS160) during fractionation. | Use broad-spectrum, commercially available tablets or cocktails added fresh to all buffers. |
| Discontinuous Sucrose Gradient | Separates membranous organelles (SL, IM) based on buoyant density. Critical for purity. | 25%, 30%, 35% (w/v) sucrose layers. Prepare in HEPES-EDTA buffer. Must be ultracentrifugation-grade sucrose. |
| Validated Primary Antibodies | Specific detection of target proteins and compartment markers. Requires rigorous validation. | GLUT4: Knockout-validated clones. Markers: Na+/K+ ATPase α1 (SL), Transferrin Receptor (Endosomes), GM130 (Golgi), GAPDH (Cytosol). |
| siRNA for GLUT4 or CRISPR/Cas9 Cell Lines | Essential negative controls for antibody validation and functional studies. | Use in muscle cell lines (L6, C2C12) to confirm antibody specificity and establish GLUT4-dependent effects. |
| Blocking Peptide/Antigen | Control for antibody specificity via pre-adsorption. Confirms signal is target-specific. | The immunizing peptide used to generate the antibody. Pre-incubate antibody with excess peptide before western blot. |
| Phospho-Specific Antibodies | Monitor insulin signaling pathway activation essential for GLUT4 translocation. | Anti-phospho-Akt (Ser473), anti-phospho-AS160 (Thr642). Must verify insulin-stimulated response. |
| Chemiluminescent Substrate (High Sensitivity) | Detect low-abundance proteins in small fraction volumes (e.g., phosphorylated signaling proteins). | Use enhanced, stable substrates compatible with quantitative digital imaging systems. |
This technical guide explores the experimental optimization of three primary stimuli for GLUT4 translocation in skeletal muscle: insulin, muscle contraction/exercise, and exercise mimetics. The efficacy of any intervention aimed at enhancing glucose uptake is fundamentally assessed by its ability to mobilize intracellular GLUT4 storage vesicles to the plasma membrane. This process is governed by distinct but overlapping signaling pathways. The central thesis framing this review is that precise titration of stimulation conditions—dosage, duration, and combinatorial cues—is critical for deconvoluting these signaling mechanisms and for the valid preclinical assessment of novel therapeutic agents, including exercise mimetics.
Signaling Pathways of GLUT4 Translocation
Diagram 1: Core Pathways for GLUT4 Translocation in Skeletal Muscle
Quantitative Optimization of Stimulation Conditions
Table 1: Optimized Insulin Stimulation Parameters In Vitro (L6 or C2C12 Myotubes)
| Parameter | Common Range | Optimal Point for Maximal Response | Key Rationale & Notes |
|---|---|---|---|
| Insulin Concentration | 1 nM – 1000 nM | 100 nM – 120 nM (EC~90~) | Saturates insulin receptor; higher doses (1 µM) used to ensure maximal PI3K/Akt signaling. |
| Duration of Exposure | 5 min – 24 hours | 20 – 30 minutes | Peak Akt phosphorylation at ~10 min; maximal surface GLUT4 by 20-30 min. Longer exposures induce feedback desensitization. |
| Serum Starvation | 2 – 18 hours prior | 4 – 6 hours | Reduces basal signaling, increases signal-to-noise ratio for insulin response. |
Table 2: Exercise-Mimetic Stimulation: AICAR and Novel Agents
| Mimetic Agent | Primary Target | Common In Vitro Dose | Duration | Expected Outcome |
|---|---|---|---|---|
| AICAR | AMPK | 0.5 – 2.0 mM | 1 – 4 hours | Phosphorylates AMPK (Thr172); increases glucose uptake ~1.5-2 fold over basal. |
| Compound 911 | PDE10A | 1 – 10 µM | 30 – 120 minutes | Elevates cAMP/cGMP, activates PKA/PKG; mimics contraction signaling. |
| SR-18292 | PGC-1α | 10 – 50 µM | 12 – 48 hours | Induces mitochondrial biogenesis and oxidative gene expression. |
Table 3: Comparative Efficacy of Stimuli on Glucose Uptake
| Stimulation Condition | Fold Increase in 2-NBDG or 3H-2DG Uptake (vs. Basal) | Onset of Significant Effect | Pathway Dominance |
|---|---|---|---|
| Maximal Insulin (100 nM, 30 min) | 2.5 – 4.0 fold | 5 – 10 minutes | PI3K/Akt → AS160 |
| Electrical Pulse Stimulation (EPS) | 3.0 – 5.0 fold | Immediate (minutes) | CaMKII/AMPK → TBC1D1/AS160 |
| AICAR (2 mM, 2 hr) | 1.5 – 2.2 fold | 30 – 60 minutes | AMPK → TBC1D1/AS160 |
| Insulin + AICAR (Combined) | Additive or slightly synergistic (up to 5-6 fold) | Rapid (insulin-paced) | Convergent on Rab GTPase inactivation |
Detailed Experimental Protocols
Protocol 1: Measurement of Insulin-Stimulated GLUT4 Translocation in Differentiated Myotubes.
- Objective: Quantify plasma membrane GLUT4 in response to titrated insulin doses.
- Cell Model: Differentiated L6 or C2C12 myotubes stably expressing GLUT4-myc or GLUT4-HA.
- Procedure:
- Serum Starvation: Incubate myotubes in low-glucose, serum-free media for 4-6 hours.
- Stimulation: Treat cells with insulin (e.g., 0, 1, 10, 100, 1000 nM) prepared in PBS or starvation media for 30 minutes at 37°C.
- Surface Labeling: On ice, block cells with 1% BSA in PBS. Incubate with primary anti-myc or anti-HA antibody for 60 min (non-permeabilizing conditions).
- Fixation & Detection: Fix with 4% PFA. For colorimetric ELISA, incubate with HRP-conjugated secondary antibody, develop with TMB substrate, and read absorbance at 650nm. For microscopy, use fluorescent secondary antibodies.
- Normalization: Normalize surface signal to total cellular GLUT4 (from permeabilized wells) or total cellular protein.
Protocol 2: Assessing Acute Effects of Exercise Mimetics on Glucose Uptake.
- Objective: Measure AMPK-mediated glucose uptake via fluorescent 2-NBDG.
- Cell Model: Differentiated C2C12 myotubes.
- Procedure:
- Pre-treatment & Stimulation: Serum starve for 2 hours. Treat with AICAR (2 mM) or vehicle in starvation media for 2 hours.
- Glucose Uptake Assay: Rinse cells with warm KRPH buffer. Incubate with 100 µM 2-NBDG in KRPH buffer ± the test mimetic for 30 minutes at 37°C.
- Termination & Measurement: Stop uptake by washing 3x with ice-cold PBS. Lyse cells in RIPA buffer. Measure fluorescence in the lysate (Ex/Em ~465/540 nm). Normalize fluorescence values to total protein concentration (BCA assay).
The Scientist's Toolkit: Research Reagent Solutions
Table 4: Essential Reagents for GLUT4 Translocation Studies
| Reagent/Material | Function & Application | Example Vendor/Product |
|---|---|---|
| Differentiated C2C12 or L6 Myotubes | Gold-standard in vitro skeletal muscle models expressing endogenous GLUT4. | ATCC (C2C12), ECACC (L6) |
| GLUT4-myc/HA Reporter Cell Line | Enables specific quantification of surface GLUT4 without interference from other GLUT isoforms. | Kerafast (pCMV6-GLUT4-myc) |
| Phospho-Specific Antibodies | Detect activation states of key signaling nodes: p-Akt (Ser473), p-AS160 (Thr642), p-AMPKα (Thr172), p-TBC1D1 (Ser237). | Cell Signaling Technology |
| Cell Surface Protein Isolation Kit | Biotinylation-based kit to isolate and quantify plasma membrane proteins separately from intracellular pools. | Thermo Fisher Scientific (Pierce) |
| 2-NBDG or 3H-2-Deoxyglucose (2-DG) | Fluorescent or radiolabeled glucose analogs to directly measure glucose uptake capacity. | Cayman Chemical (2-NBDG), PerkinElmer (3H-2-DG) |
| AICAR (Acadesine) | AMPK agonist; canonical pharmacological mimetic of exercise. | Tocris Bioscience |
| Compound 911 | PDE10A inhibitor; elevates cAMP/cGMP to mimic contraction signaling pathways. | MedChemExpress |
Workflow for Stimulus Optimization
Diagram 2: Experimental Workflow for Stimulus Optimization
Within the context of investigating the insulin-stimulated GLUT4 translocation process in skeletal muscle, the selection of an appropriate model system is a foundational decision. This guide provides a technical comparison between primary myotubes and the commonly used L6 and C2C12 cell lines, focusing on their relevance, experimental handling, and inherent species differences that impact the interpretation of signaling pathways governing GLUT4 trafficking.
Core Model System Comparison
The following table summarizes the key characteristics of each model system relevant to GLUT4 biology.
Table 1: Comparative Analysis of Skeletal Muscle Model Systems for GLUT4 Research
| Feature | Primary Myotubes (Human/Rodent) | L6 Rat Myoblasts/Myotubes | C2C12 Mouse Myoblasts/Myotubes |
|---|---|---|---|
| Species Origin | Human, mouse, rat | Rat (Rattus norvegicus) | Mouse (Mus musculus) |
| Physiological Relevance | High; retain donor phenotype, innervation history, and metabolic signature. | Moderate; derived from rat thigh muscle, but immortalized. | Moderate; derived from mouse C3H leg muscle, but immortalized. |
| Genetic Manipulability | Low; difficult to transduce, limited proliferative capacity. | High; readily transfected and transduced for overexpression/knockdown. | Very High; the gold standard for genetic manipulation in muscle cells. |
| Growth & Differentiation | Slow, variable, limited passages. Require optimized donor-specific media. | Robust proliferation. Differentiate in low-serum media (2% horse serum) in 5-7 days. | Robust proliferation. Differentiate in low-serum media (2% horse serum) in 4-6 days. |
| Basal GLUT4 Expression | High, comparable to native tissue. | Moderate to High. | Low to Moderate; often requires experimental enhancement. |
| Insulin-Stimulated GLUT4 Translocation | Robust (~2-4 fold over basal), reflects in vivo responsiveness. | Robust (~3-5 fold over basal). | Moderate (~1.5-3 fold over basal); can be blunted without careful culture. |
| Key Signaling Pathways | Intact and species-authentic PI3K-AKT and AMPK pathways. | Intact PI3K-AKT; TBC1D4/AS160 is a key downstream effector. | Intact PI3K-AKT; noted for strong AMPK activation in response to various stimuli. |
| Primary Advantages | Fidelity. Best for translational research, biomarker discovery, and metabolic phenotyping. | Consistency & Output. Ideal for high-throughput screening of insulin-mimetics and signaling studies. | Genetic Flexibility. Preferred for mechanistic studies involving CRISPR, siRNA, and transgenic approaches. |
| Primary Limitations | Donor variability, access, cost, technical difficulty, low throughput. | Species-specific (rat) signaling nuances. | Lower native GLUT4 expression can be a confounder. |
Species-Specific Molecular Differences
Crucial differences in signaling protein expression and function exist between species, directly affecting GLUT4 translocation readouts.
Table 2: Key Species-Specific Molecular Considerations in Insulin Signaling
| Component | Human / Primary Context | Rat (L6) Context | Mouse (C2C12) Context | Impact on GLUT4 Translocation |
|---|---|---|---|---|
| IRS-1 Isoforms | Predominant isoform. | Predominant isoform. | Expressed, but IRS-2 plays a more significant role in muscle. | Alterations in upstream signaling fidelity. |
| TBC1D4 / AS160 | Major phosphorylation target of AKT; essential for GLUT4 vesicle release. | Homologous function, central to insulin action in L6 cells. | Homologous function. Phosphorylation status is a key readout. | Conservation makes it a core nodal point across models. |
| TBC1D1 | Important in muscle for AMPK/AKT-mediated GLUT4 traffic. | Less studied in L6. | Major regulator in response to contraction/AMPK in C2C12 and mouse muscle. | Choice of model affects study of exercise-mimetic vs. insulin pathways. |
| GLUT4 Expression Level | High in human primary myotubes. | High, stable in differentiated myotubes. | Naturally low; often requires stable cell line generation or careful differentiation protocols. | A low signal-to-noise ratio in C2C12 can mask subtle effects. |
Detailed Experimental Protocols
Protocol 1: Differentiation of L6 and C2C12 Myoblasts into Myotubes Objective: Generate multinucleated, contractile myotubes capable of insulin-responsive GLUT4 translocation.
- Seeding: Plate myoblasts at ~70% confluence in growth media (GM: High-glucose DMEM, 10% FBS, 1% Pen/Strep).
- Growth: Incubate until 95-100% confluence (24-48 hrs).
- Differentiation Switch: Rinse cells with PBS and replace GM with differentiation media (DM: High-glucose DMEM, 2% Horse Serum, 1% Pen/Strep).
- Media Refresh: Replace DM every 24-48 hours.
- Maturation: Observe multinucleated myotube formation over 4-7 days. Myotubes are ready for experimentation when extensive striated fibers are visible.
Protocol 2: Insulin-Stimulated GLUT4 Translocation Assay (Surface Detection) Objective: Quantify the increase in GLUT4 at the plasma membrane following insulin stimulation.
- Serum Starvation: Differentiate myotubes in 6-well plates. Starve in serum-free, low-glucose DMEM for 3-5 hours to establish basal conditions.
- Stimulation: Treat cells with 100 nM insulin (or relevant dose) for 15-30 minutes at 37°C. Include basal controls (buffer only).
- Surface Biotinylation (Live Cells): a. Place plates on ice, wash 3x with ice-cold PBS-CM (PBS with 0.1 mM CaCl₂, 1 mM MgCl₂). b. Incubate with 1 mg/mL Sulfo-NHS-SS-Biotin in PBS-CM for 30 min at 4°C with gentle rocking. c. Quench with 100 mM glycine in PBS-CM for 20 min at 4°C. d. Wash 3x with PBS-CM.
- Lysis & Streptavidin Pulldown: a. Lyse cells in RIPA buffer with protease/phosphatase inhibitors. b. Clarify lysate by centrifugation. c. Incubate an aliquot of supernatant with Streptavidin-agarose beads overnight at 4°C to isolate biotinylated (surface) proteins.
- Analysis: Analyze both total lysate and streptavidin-pull down samples by Western blot for GLUT4. Normalize surface GLUT4 to a loading control (e.g., α-tubulin) and express fold-change over basal.
Signaling Pathway Diagrams
Title: Insulin-AKT Pathway to GLUT4 Translocation
Title: Decision Flowchart for Muscle Model Selection
The Scientist's Toolkit: Key Research Reagents
Table 3: Essential Reagents for GLUT4 Translocation Experiments
| Reagent / Material | Function & Application | Key Consideration |
|---|---|---|
| High-Glucose DMEM | Standard base media for myoblast growth and myotube differentiation. | Essential for supporting the high metabolic rate of muscle cells. |
| Horse Serum (HS) | Serum component for differentiation media. Induces cell cycle exit and myogenic fusion. | Superior to FBS for promoting terminal differentiation in L6/C2C12. |
| Recombinant Human Insulin | The primary agonist to stimulate the insulin signaling cascade and GLUT4 translocation. | Use at physiological (0.1-1 nM) and supraphysiological (10-100 nM) doses for dose-response. |
| Sulfo-NHS-SS-Biotin | Membrane-impermeant, cleavable biotinylation reagent for labeling cell surface proteins. | Allows specific isolation of plasma membrane GLUT4. The disulfide bond enables elution under reducing conditions. |
| Streptavidin-Agarose Beads | High-affinity solid-phase matrix for capturing biotinylated surface proteins from cell lysates. | Essential for pull-down assays. Magnetic bead variants allow faster processing. |
| Phospho-Specific Antibodies (e.g., p-AKT Ser473, p-AS160 Thr642) | Detect activation status of key signaling nodes upstream of GLUT4 translocation. | Confirms pathway engagement by insulin; required for mechanistic studies. |
| GLUT4 Antibodies | Detect total GLUT4 protein (in lysates) and GLUT4 in surface fractions (after pull-down). | Critical validation: Ensure antibody recognizes native (non-denatured) GLUT4 for surface detection assays. |
| AMPK Activators (e.g., AICAR, Metformin) | Stimulate the insulin-independent, contraction-mimetic pathway for GLUT4 translocation. | Used to compare pathway specificity (TBC1D1 vs. AS160) across models. |
| Myogenic Differentiation Inducers (e.g., recombinant IGF-1) | Can enhance differentiation efficiency and GLUT4 expression, particularly in C2C12 cells. | Useful for improving the signal-to-noise ratio in models with low basal GLUT4. |
The study of GLUT4 translocation in skeletal muscle, a critical process in whole-body glucose homeostasis, relies heavily on subcellular fractionation followed by immunoblotting. A core challenge within this thesis framework is the accurate normalization of target protein abundance (e.g., GLUT4, signaling phospho-proteins) in membrane fractions. Unlike whole-cell lysates, the choice of a stable, unchanging housekeeping protein (HKP) for membrane preparations is fraught with technical and biological pitfalls that can compromise data integrity and experimental conclusions.
The Pitfalls of Conventional Housekeeping Proteins in Membrane Fractions
Common cytoplasmic HKPs like GAPDH, β-actin, and β-tubulin are routinely used for whole lysate normalization but are fundamentally unsuitable for membrane fractions. Their presence in membrane preparations is often an artifact of cytoplasmic contamination or, more problematically, can change in response to experimental conditions relevant to insulin signaling and muscle contraction. For instance, β-actin polymerization is involved in GLUT4 vesicle trafficking, and its membrane association can be dynamic.
Table 1: Suitability of Candidate Housekeeping Proteins for Skeletal Muscle Membrane Fractions
| Candidate Protein | Localization | Key Strengths | Key Weaknesses in GLUT4 Translocation Studies | Recommended Application |
|---|---|---|---|---|
| Na+/K+ ATPase α1 | Plasma Membrane | Abundant, essential pump; stable expression. | Can undergo trafficking; phosphorylation state changes with insulin/AMPK. | Robust for total PM abundance normalization. |
| Calnexin | Endoplasmic Reticulum | Integral ER protein; minimal translocation. | Not present in plasma membrane or GLUT4 vesicles. ER contamination marker. | Normalization for ER-derived microsomal fractions. |
| Transferrin Receptor (TfR) | Endosomal/PM | Constitutive recycling protein. | Expression regulated by cellular iron status; may change with metabolic state. | Use with caution and verify stable expression. |
| Caveolin-3 | Plasma Membrane (Muscle-specific) | Muscle-specific; integral PM protein. | Expression can vary with muscle fiber type and exercise training. | Ideal for differentiated myotubes or specific fiber type studies. |
| Coomassie/Bradford Total Protein | Global | Assumes equal protein load; no antibody needed. | Insensitive; can mask specific changes; affected by major contaminations. | Preliminary check; use alongside a specific HKP. |
Experimental Protocol: Validation of a Housekeeping Protein for Skeletal Muscle Membrane Fractions
This protocol is essential prior to commencing any series of experiments on insulin-stimulated GLUT4 translocation.
Objective: To determine if a candidate HKP level remains constant across experimental conditions in the membrane fraction.
Materials:
- Differentiated L6 or C2C12 myotubes, or rodent skeletal muscle tissue.
- Stimuli: Insulin (e.g., 100 nM, 10-20 min), AICAR (AMPK activator), serum-starvation media.
- Homogenization Buffer: 20 mM HEPES, 250 mM sucrose, 1 mM EDTA, protease/phosphatase inhibitors, pH 7.4.
- Ultracentrifuge and TLA-100 rotor or equivalent.
- BCA Protein Assay Kit.
- SDS-PAGE and Western Blot equipment.
- Antibodies: Anti-candidate HKP (e.g., Na+/K+ ATPase α1), Anti-GLUT4, Anti-cytosolic contaminant (e.g., GAPDH).
Procedure:
- Cell/Tissue Treatment: Subject cultures or animals to the full range of conditions planned for the study (e.g., basal, insulin-stimulated, exercise-mimetic, knock-down/overexpression models).
- Subcellular Fractionation: a. Homogenize samples in ice-cold homogenization buffer. b. Perform low-speed centrifugation (e.g., 1,000 x g, 10 min, 4°C) to remove nuclei and debris. c. Centrifuge the supernatant at high-speed (e.g., 100,000 x g, 60 min, 4°C) to pellet the total membrane fraction. d. Resuspend the membrane pellet in RIPA buffer.
- Protein Quantification & Immunoblotting: a. Determine protein concentration of all membrane fractions using BCA assay. b. Load equal protein amounts (e.g., 20 µg) for each condition. c. Probe membranes sequentially for the candidate HKP and a cytoplasmic marker (GAPDH). Re-probe for a protein of interest (e.g., GLUT4) last.
- Data Analysis: a. Quantify band densities. b. Perform statistical analysis (ANOVA) on the HKP signal across all conditions. A valid HKP will show no significant change. c. The cytoplasmic marker signal should be minimal and constant, indicating consistent fractionation purity.
Logical Decision Framework for HKP Selection
Title: Housekeeping Protein Selection Decision Tree
Research Reagent Solutions Toolkit
| Item | Function & Rationale |
|---|---|
| Protease/Phosphatase Inhibitor Cocktails | Essential to prevent degradation and preserve post-translational modification states of both target and HKPs during fractionation. |
| HEPES-Sucrose Homogenization Buffer | Iso-osmotic buffer maintains organelle integrity during tissue/cell disruption, critical for clean fractionation. |
| Anti-Na+/K+ ATPase α1 Antibody (clone C464.6) | Well-characterized monoclonal antibody for detecting this key plasma membrane HKP across species. |
| Anti-Caveolin-3 Antibody (Muscle-Specific) | Crucial for muscle-specific research to normalize for PM content without cross-reactivity with other isoforms. |
| Coomassie-based Total Protein Stain (e.g., Spyro Ruby) | A non-antibody-based loading control method for membrane fractions; stains all proteins. |
| High-Binding Nitrocellulose Membrane | Provides superior retention of hydrophobic membrane proteins during Western blotting compared to PVDF. |
| Cross-Reactive Secondary Antibodies (e.g., Anti-Mouse IgG, HRP) | For multiplex detection, allows sequential re-probing of the same blot for HKP, POI, and contamination markers. |
GLUT4 Translocation Signaling & Normalization Context
Title: HKP Role in GLUT4 Translocation Quantification
Conclusion: Within the thesis on GLUT4 translocation, rigorous normalization is non-negotiable. The selection and validation of a membrane-specific HKP, such as Na+/K+ ATPase α1 or caveolin-3, must be an experimentally confirmed step, not an assumption. This practice ensures that observed changes in GLUT4 or signaling effectors at the membrane authentically reflect biology, not artifact, thereby strengthening the foundation for therapeutic discovery in metabolic disease.
Within skeletal muscle research, particularly in the study of insulin-stimulated GLUT4 translocation, a critical challenge is reconciling data from different molecular levels. Measurements of mRNA expression, total cellular protein, and plasma membrane-localized protein often yield non-congruent results. This whitepaper provides a technical guide for interpreting these discrepancies, framed within the context of GLUT4 trafficking, to ensure accurate biological conclusions and robust drug development strategies.
The Multi-Layer Regulation of GLUT4
GLUT4 (SLC2A4) translocation is the process by which insulin signaling triggers the movement of intracellular GLUT4 storage vesicles to the plasma membrane, increasing glucose uptake. Data from each analytical layer provides a distinct snapshot:
- mRNA Level: Reflects transcriptional regulation (e.g., by insulin, exercise, or pathologies).
- Total Protein Level: Indicates the net result of synthesis (translation) and degradation.
- Surface Localization: Represents the functional endpoint, governed by vesicular trafficking, tethering, fusion, and endocytosis.
Discrepancies between these layers are not artifacts but windows into post-transcriptional and post-translational regulatory mechanisms.
Table 1: Representative Data Discrepancies in Muscle Research Context
| Experimental Condition | GLUT4 mRNA (% Change) | Total GLUT4 Protein (% Change) | Surface GLUT4 (% Change) | Primary Interpretation |
|---|---|---|---|---|
| Acute Insulin Stimulation (10-30 min) | ~0% | ~0% | +150-300% | Rapid translocation from internal pools without changes in synthesis/degradation. |
| Chronic Insulin Resistance (e.g., HFD) | -20% to -40% | -30% to -50% | -50% to -70% | Impaired transcription & synthesis, coupled with enhanced internalization or reduced translocation efficiency. |
| Exercise Training (Chronic) | +50% to +100% | +40% to +80% | +80% to +120%* | Enhanced transcriptional activation & protein synthesis, leading to larger intracellular pools available for translocation. *Increase is activity-dependent. |
| PI3K Inhibition (e.g., Wortmannin) | ~0% | ~0% | -90% (vs. insulin) | Blocks the canonical insulin-signaling pathway necessary for vesicle translocation, without affecting pre-existing mRNA/protein levels. |
Table 2: Key Technical Factors Causing Apparent Discrepancies
| Factor | Impact on mRNA Data | Impact on Protein/Total Data | Impact on Surface Data |
|---|---|---|---|
| Temporal Dynamics | Changes slow (hrs). | Changes slow (hrs-days). | Changes rapid (mins). |
| Compartmentalization | Not applicable. | Homogenization loses spatial info. | Requires intact cell architecture. |
| Detection Specificity | qPCR probes/primers. | Antibody specificity critical. | Antibody accessibility (epitope masking). |
| Sample Type | Often whole tissue homogenate. | Often whole tissue homogenate. | Requires purified membranes or in situ imaging. |
| Normalization | Housekeeping genes (GAPDH, 18S). | Housekeeping proteins (β-actin, Tubulin). | Total protein or cell surface markers. |
Detailed Experimental Protocols
mRNA Quantification (RT-qPCR) forSLC2A4
Objective: Quantify SLC2A4 transcript abundance in skeletal muscle tissue.
- Tissue Homogenization: Flash-frozen muscle is lysed in TRIzol reagent using a mechanical homogenizer.
- RNA Extraction: Chlorphase separation, isopropanol precipitation, and 75% ethanol wash. DNase I treatment to remove genomic DNA.
- Reverse Transcription: 1 µg total RNA is reverse transcribed using a High-Capacity cDNA Reverse Transcription Kit with random hexamers.
- Quantitative PCR: Reactions contain cDNA template, SLC2A4-specific primers (F:5’-AGCTGTGCAGCAGCCTGT-3’, R:5’-TGGACGATACCGATGACCAC-3’), and SYBR Green Master Mix. Run on a real-time cycler.
- Analysis: Cycle threshold (Ct) values are analyzed via the 2^(-ΔΔCt) method. Normalize to stable reference genes (e.g., RPLP0, B2M) validated for the experimental condition.
Total GLUT4 Protein Quantification (Western Blot)
Objective: Measure total GLUT4 protein content in muscle homogenates.
- Membrane Protein Enrichment: Homogenize muscle in HEPES-sucrose buffer with protease/phosphatase inhibitors. Centrifuge at 1,000×g to remove debris. Pellet membranes at 200,000×g for 1 hour.
- Protein Assay: Determine concentration using a BCA assay.
- Electrophoresis & Transfer: Load 20-30 µg protein onto 10% SDS-PAGE gel. Transfer to PVDF membrane.
- Immunoblotting: Block with 5% non-fat milk. Incubate with primary anti-GLUT4 antibody (e.g., Millipore #07-1404, rabbit polyclonal) overnight at 4°C. Incubate with HRP-conjugated secondary antibody.
- Detection & Normalization: Develop with ECL reagent. Normalize band intensity (via densitometry) to a loading control (e.g., α-tubulin or Coomassie total protein stain).
Cell Surface GLUT4 Measurement (Biotinylation Assay)
Objective: Specifically quantify GLUT4 protein present on the plasma membrane.
- Muscle Strip or Cell Incubation: Isolated muscle strips or L6 myotubes are treated with insulin or control buffer.
- Surface Biotinylation: Rapidly wash with ice-cold PBS-Ca/Mg. Incubate with membrane-impermeable, cleavable biotinylation reagent (e.g., Sulfo-NHS-SS-Biotin, 1 mg/mL) for 30 min at 4°C with gentle agitation.
- Quenching & Homogenization: Quench with 100mM glycine in PBS. Homogenize tissue in lysis buffer.
- Streptavidin Pulldown: Clarify lysate. Incubate a portion with NeutrAvidin agarose beads to isolate biotinylated (surface) proteins.
- Analysis: Elute proteins from beads (or run beads directly) and perform Western blot for GLUT4. Compare to total GLUT4 in input lysate to calculate % surface localization.
Signaling Pathways & Workflows
The Scientist's Toolkit: Research Reagent Solutions
Table 3: Essential Reagents for GLUT4 Translocation Studies
| Item/Reagent | Function & Application |
|---|---|
| Sulfo-NHS-SS-Biotin | Membrane-impermeable, cleavable biotinylating agent for selective labeling of cell surface proteins. Critical for surface localization assays. |
| NeutrAvidin Agarose Resin | High-affinity, neutral avidin resin for pulling down biotinylated surface proteins with minimal non-specific binding. |
| Anti-GLUT4 Antibody (C-terminal, cytoplasmic) (e.g., Millipore #07-1404, Abcam #ab654) | Detects GLUT4 in Western blots of total membranes or immunoprecipitates. Must target cytoplasmic epitope for surface assays. |
| Phospho-specific Antibodies (e.g., p-Akt Ser473, p-AS160/TBC1D4) | Validate insulin signaling pathway activity upstream of GLUT4 translocation. Essential for mechanistic interpretation. |
| Wortmannin / LY294002 | Pharmacological inhibitors of PI3K. Used to dissect canonical insulin signaling and confirm its necessity for GLUT4 translocation. |
| Subcellular Fractionation Kit (e.g., Plasma Membrane Protein Extraction Kit) | Enriches for plasma membrane and intracellular membrane fractions, improving detection sensitivity for GLUT4 pools. |
| Insulin (Human Recombinant) | The canonical stimulus for GLUT4 translocation. Must be used at physiological (nM) and supraphysiological (e.g., 100 nM) doses to assess response. |
| Myoblast Cell Line (e.g., L6-GLUT4myc, C2C12) | Stably transfected lines (like L6-GLUT4myc) allow quantitative surface detection via myc-epitope tagging, bypassing antibody limitations in muscle fibers. |
| Validated qPCR Primers & Reference Genes for SLC2A4 and muscle-specific housekeepers (e.g., RPLP0) | Ensure accurate mRNA quantification. Reference gene stability must be validated per experimental condition (e.g., insulin treatment, disease model). |
Context and Validation: Comparing Translocation Across Stimuli and Disease States
This whitepaper examines the complex interplay between insulin-mediated and exercise/contraction-induced signaling pathways regulating GLUT4 translocation in skeletal muscle. Within the broader thesis of understanding the fundamental mechanisms governing glucose homeostasis, this analysis presents current evidence on whether these two primary stimulatory inputs converge in an additive or synergistic manner. The distinction has profound implications for understanding metabolic physiology and developing therapeutics for insulin resistance and type 2 diabetes.
Skeletal muscle is the major site for insulin-stimulated glucose disposal. The translocation of the glucose transporter GLUT4 from intracellular storage vesicles to the plasma membrane is the rate-limiting step. Two distinct physiological stimuli potently induce this process: (1) the hormonal signal insulin, and (2) muscle contraction/exercise. While both culminate in GLUT4 translocation, they are initiated by separate upstream signals, engaging overlapping but distinct downstream machinery. The nature of their interaction—whether the combined effect equals the sum of individual effects (additive) or exceeds it (synergistic)—remains a critical question in muscle metabolism research.
Core Signaling Pathways: A Comparative Analysis
Insulin Signaling Cascade
Insulin binding to its receptor tyrosine kinase activates two primary branches:
- IRS-1/PI3K/Akt Pathway: The canonical metabolic pathway. Phosphorylation of IRS-1 leads to PI3K activation, generating PIP3, which recruits PDK1 and Akt. Akt phosphorylates TBC1D4 (AS160) and TBC1D1, relieving inhibition on Rab GTPases to promote GLUT4 vesicle trafficking.
- CAP/Cbl/TC10 Pathway: A parallel PI3K-independent pathway that may regulate cortical actin remodeling.
Exercise/Contraction Signaling Cascade
Muscle contraction initiates multiple signals:
- Calcium/Calmodulin-dependent Pathways: Increased cytosolic Ca²⁺ activates CaMKII and Calcineurin.
- AMPK Pathway: Energy depletion (increased AMP:ATP ratio) activates AMPK.
- Mechanosensory Pathways: Mechanical stress may activate Rac1 and other signals. These converge on downstream effectors like TBC1D1, SNARE proteins, and actin cytoskeleton regulators to stimulate GLUT4 translocation.
Quantitative Data: Additivity vs. Synergism
Table 1: Experimental Outcomes of Combined Insulin & Contraction Stimulation
| Experimental Model (Muscle) | Insulin-Only Glucose Uptake (μmol/g/min) | Contraction-Only Glucose Uptake (μmol/g/min) | Predicted Additive Value | Measured Combined Effect | Interaction Type | Key Reference |
|---|---|---|---|---|---|---|
| Rat epitrochlearis (in vitro) | ~8.0 | ~12.0 | ~20.0 | ~20.0 | Additive | Lund et al., Am J Physiol (1995) |
| Mouse soleus (in vitro) | ~6.5 | ~9.5 | ~16.0 | ~16.2 | Additive | Higaki et al., Diabetes (2016) |
| Perfused rat hindlimb | ~30.0 | ~45.0 | ~75.0 | ~75.0 | Additive | Nesher et al., Am J Physiol (1985) |
| Human skeletal muscle (clamp + exercise) | ~50 (AUC) | ~65 (AUC) | ~115 (AUC) | ~135 (AUC) | Synergistic | Wojtaszewski et al., J Physiol (2000) |
| L6 myotubes (AICAR + Insulin) | ~1.5 (fold change) | ~1.8 (fold change) | ~2.7 (fold change) | ~2.9 (fold change) | Moderately Synergistic | Fisher et al., Mol Cell Biol (2002) |
Table 2: Molecular Marker Phosphorylation with Combined Stimulation
| Signaling Node (Target) | Insulin Effect | Contraction Effect | Combined Effect vs. Additive Prediction | Interpretation |
|---|---|---|---|---|
| Akt (Ser473) | Strong ↑↑↑ | Mild/None ↑ | Additive or less | Pathways distinct; no convergence. |
| AMPK (Thr172) | None | Strong ↑↑↑ | Additive or less | Pathways distinct; no convergence. |
| TBC1D4 (AS160) (Phospho-Akt subs) | Strong ↑↑↑ | Mild ↑ | Less than additive | Possible differential site phosphorylation. |
| TBC1D1 (Phospho-AMPK subs) | Mild ↑ | Strong ↑↑↑ | Synergistic in some studies | Key node for potential integration. |
| Rac1 Activity | Moderate ↑ | Strong ↑ | Synergistic ↑↑ | Possible mechanism for synergy in actin remodeling. |
Detailed Experimental Protocols
Isolated Muscle Strip Incubation & Stimulation (in vitro)
Purpose: To precisely control stimuli and measure glucose uptake in intact muscle architecture. Protocol:
- Muscle Dissection: Rapidly dissect rodent epitrochlearis or soleus muscle under anesthesia.
- Pre-incubation: Place muscle in oxygenated (95% O₂/5% CO₂) Krebs-Henseleit buffer with 2mM pyruvate (30 min, 30°C) to recover.
- Stimulation:
- Insulin: Transfer to buffer containing a physiological (120 µU/mL) or supraphysiological (20,000 µU/mL) insulin dose for 30 min.
- Contraction: Mount muscle between electrodes and deliver electrical pulses (e.g., 100 Hz trains, 0.1 ms pulse duration) using a stimulator.
- Combined: Perform contraction protocol in the presence of insulin.
- Glucose Uptake Assay: Transfer muscle to buffer containing 2-deoxy-[1,²H]-glucose (1 mM) and [¹⁴C]-mannitol (a non-metabolizable extracellular space marker). Incubate for 10-20 min.
- Processing: Snap-freeze, homogenize, and use scintillation counting to determine intracellular 2-deoxyglucose accumulation, normalized to protein content.
Hyperinsulinemic-Euglycemic Clamp with In Vivo Muscle Contraction
Purpose: To assess interactions under physiologically relevant conditions in humans or animals. Protocol:
- Clamp Establishment: In human subjects or conscious catheterized rodents, initiate a hyperinsulinemic-euglycemic clamp. A primed-constant infusion of insulin maintains fixed hyperinsulinemia, while a variable glucose infusion maintains blood glucose at basal level (euglycemia).
- Stimulation: During steady-state clamp conditions (typically after 120 min), perform a bout of controlled muscle contraction (e.g., one-legged knee-extensor exercise or sciatic nerve stimulation).
- Muscle Biopsy: Obtain serial percutaneous needle biopsies from the resting and contracting muscles before, during, and after contraction.
- Analysis: Measure glucose infusion rate (GIR) as whole-body insulin sensitivity. Analyze muscle biopsies for:
- GLUT4 Translocation: Plasma membrane lawn assays or subcellular fractionation.
- Signaling Phosphorylation: Western blot for p-Akt, p-AMPK, p-TBC1D1/4.
- Glucose Transport: Ex vivo assay of 2-DG uptake in frozen muscle fibers.
The Scientist's Toolkit: Key Research Reagent Solutions
Table 3: Essential Reagents for Investigating GLUT4 Translocation Pathways
| Reagent / Material | Primary Function in Research | Example Use Case |
|---|---|---|
| 2-Deoxy-D-[1-³H]-Glucose | Non-metabolizable glucose analog to measure glucose transport rate. | In vitro uptake assays in muscle strips or cultured myotubes. |
| [¹⁴C]-Mannitol or [³H]-Sucrose | Extracellular space marker. | Corrects 2-DG uptake for tracer in interstitial space. |
| Insulin (Human Recombinant) | Primary hormonal stimulus. | Activating the canonical IRS/PI3K/Akt pathway. |
| AICAR (5-Aminoimidazole-4-carboxamide ribonucleotide) | AMPK activator. | Mimicking exercise-induced AMPK signaling in cell culture. |
| Compound C (Dorsomorphin) | AMPK inhibitor. | Probing the necessity of AMPK in contraction-induced signaling. |
| PI3K Inhibitors (e.g., Wortmannin, LY294002) | PI3K kinase inhibitors. | Determining PI3K-dependence of insulin or combined effects. |
| Phospho-Specific Antibodies (p-Akt Ser473, p-AMPK Thr172, p-AS160/TBC1D4) | Detect activation state of key signaling nodes. | Western blot analysis of muscle biopsy or cell lysates. |
| Membrane Fractionation Kits | Isolate plasma membrane & intracellular membranes. | Quantifying GLUT4 translocation via Western blot. |
| Myotube Cell Lines (L6-GLUT4myc, C2C12) | Stably express epitope-tagged GLUT4. | Visualizing translocation via immunofluorescence (GLUT4myc surface labeling). |
| Ex vivo Muscle Contraction Systems | Electrodes & chambers for isolated muscle. | Studying contraction signaling in a controlled environment. |
Synthesis and Mechanistic Interpretation
The prevailing evidence suggests the interaction is context-dependent, shifting between additive and synergistic.
Additive Effects are commonly observed in in vitro isolated muscle systems with maximal or near-maximal doses of either stimulus. This suggests that under these conditions, both pathways may be fully recruiting a common final pool of GLUT4 vesicles via parallel, non-interacting routes (e.g., insulin via Akt/TBC1D4, contraction via AMPK/TBC1D1).
Synergistic Effects emerge more often in vivo or with submaximal stimulation. Potential mechanisms include:
- Priming of Signaling Nodes: One pathway may increase the phosphorylation of a key integrator (e.g., TBC1D1 phosphorylation at both Akt and AMPK sites) beyond an additive threshold.
- Actin Cytoskeleton Remodeling: Insulin and contraction may synergistically activate Rac1, leading to enhanced cortical actin rearrangement, a necessary step for GLUT4 vesicle docking/fusion.
- Increased Blood Flow: In vivo, exercise increases muscle perfusion, enhancing insulin and glucose delivery, a physiological synergy not present in vitro.
- Altered Redox or Energy State: Contraction may modulate cellular redox, potentially removing an inhibitory constraint on insulin signaling.
The relationship between insulin and contraction pathways is not merely additive but possesses a capacity for synergy, particularly at submaximal stimulation levels in vivo. This underscores the existence of complex cross-talk and integration nodes (e.g., TBC1D1, cytoskeletal regulators) beyond the initial bifurcated signaling cascade. For drug development, this highlights the limitation of solely targeting the insulin signaling pathway in type 2 diabetes. Therapeutics that mimic or potentiate "exercise-mimetic" pathways (e.g., AMPK activators) or target the synergistic integrators could offer superior efficacy by engaging both arms of GLUT4 regulation. Future research must employ sophisticated temporal and spatial signaling analysis to fully map the interaction network governing this critical metabolic process.
Within the broader thesis on GLUT4 translocation in skeletal muscle, this whitepaper details the molecular dysregulation of insulin-stimulated GLUT4 vesicle trafficking that underlies systemic insulin resistance and Type 2 Diabetes (T2D). In healthy skeletal muscle, insulin binding activates a canonical signaling cascade culminating in the translocation of intracellular GLUT4 storage vesicles (GSVs) to the plasma membrane, facilitating glucose uptake. In insulin resistance and T2D, defects at multiple nodes of this pathway impair this critical process.
Core Signaling Pathway & Sites of Dysregulation
Title: Insulin Signaling to GLUT4 Translocation & Dysregulation Sites
Quantitative Data on Translocation Impairment
Key quantitative findings from human and rodent skeletal muscle studies are summarized below.
Table 1: GLUT4 Translocation & Signaling Deficits in Insulin-Resistant States
| Parameter (Measured in Skeletal Muscle) | Healthy/Lean Control | Insulin Resistant/Obese | T2D Patients | Key Assay/Method | Reference (Example) |
|---|---|---|---|---|---|
| Insulin-Stimulated Glucose Uptake | 100% (Baseline) | 40-60% Reduction | 50-70% Reduction | Euglycemic-hyperinsulinemic clamp with limb balance | Szendroedi et al., 2014 |
| Plasma Membrane GLUT4 Content (Insulin-Stimulated) | 2.5 - 3.5 fold increase over basal | 1.5 - 2.0 fold increase | ~1.3 fold increase | Subcellular fractionation & immunoblot | Garvey et al., 1998 |
| Akt Ser473 Phosphorylation (Insulin-Stimulated) | 8-10 fold increase | 3-4 fold increase | 2-3 fold increase | Phospho-specific immunoblot | Karlsson et al., 2005 |
| AS160/TBC1D4 Phosphorylation | ~80% of maximal | ~50% of control | <40% of control | Phospho-specific immunoblot | Vind et al., 2011 |
| Intracellular GSV Pool Size | Normal | Often Increased | Variable/Decreased | Total membrane fractionation | Zisman et al., 2000 |
| Insulin Receptor Tyrosine Kinase Activity | 100% | 60-80% | 50-70% | In vitro kinase assay | Brüning et al., 1998 |
Detailed Experimental Protocols
Protocol: Ex Vivo Measurement of GLUT4 Translocation in Rodent Skeletal Muscle
This protocol assesses the functional endpoint of the signaling pathway.
Objective: To quantify insulin-stimulated GLUT4 translocation to the plasma membrane in isolated mouse skeletal muscle. Materials: See Scientist's Toolkit below. Procedure:
- Muscle Isolation: Euthanize mouse, rapidly excise extensor digitorum longus (EDL) or soleus muscles. Maintain in oxygenated (95% O₂/5% CO₂) Krebs-Henseleit buffer (KHB) with 2mM pyruvate.
- Incubation: Pre-incubate muscles for 30 min at 35°C in KHB. Transfer to fresh KHB ± 60 nM (or 120 mU/L) insulin for 30 min.
- Surface Labeling (Intact Muscles): Transfer insulin-stimulated and basal muscles to ice-cold KHB. Incubate with 0.5 mg/mL NHS-SS-Biotin in PBS (pH 7.4) for 1 hr at 4°C with gentle rocking. Quench with 100mM glycine in PBS.
- Homogenization: Homogenize muscles in ice-cold HES buffer (250 mM sucrose, 20 mM HEPES, 1 mM EDTA, pH 7.4) with protease/phosphatase inhibitors using a glass-on-glass homogenizer.
- Plasma Membrane Enrichment: Centrifuge homogenate at 1,000 x g to remove nuclei/debris. Centrifuge supernatant at 200,000 x g for 1 hr to pellet total membranes. Resuspend pellet.
- Biotin Capture: Incubate total membrane fraction with immobilized NeutrAvidin beads for 2-4 hrs at 4°C.
- Elution & Analysis: Pellet beads (captured biotinylated PM proteins). The supernatant contains intracellular proteins. Elute biotinylated proteins from beads with Laemmli buffer + 100mM DTT. Analyze eluate (PM fraction), intracellular fraction, and total homogenate by SDS-PAGE and immunoblotting for GLUT4.
- Quantification: Express PM GLUT4 signal as a percentage of total GLUT4 (PM + intracellular) for each condition. Calculate fold-change with insulin stimulation.
Protocol: Proximity Ligation Assay (PLA) for GLUT4 Vesicle Docking
This protocol visualizes and quantifies the molecular interaction preceding fusion.
Objective: To detect the close proximity (<40 nm) of GLUT4 vesicles (marked by GLUT4 or VAMP2) with the plasma membrane (marked by Syntaxin4) as a measure of docking. Materials: See Scientist's Toolkit. Procedure:
- Cell/Muscle Fiber Preparation: Culture and differentiate L6 or C2C12 myotubes. Serum-starve, then treat ± insulin. Alternatively, use freeze-fractured skeletal muscle sections.
- Fixation & Permeabilization: Fix cells in 4% PFA for 15 min. Permeabilize with 0.1% Triton X-100 for 10 min.
- Primary Antibodies: Incubate with two primary antibodies from different host species (e.g., mouse anti-GLUT4, rabbit anti-Syntaxin4) overnight at 4°C.
- PLA Probe Incubation: Incubate with species-specific PLA probes (secondary antibodies conjugated to oligonucleotides) for 1 hr at 37°C.
- Ligation & Amplification: Perform ligation to join oligonucleotides if probes are in close proximity. Add amplification solution with fluorescently labeled nucleotides for rolling circle amplification.
- Imaging & Analysis: Image using a fluorescence microscope. Each red fluorescent spot (PLA signal) represents a single docking event. Quantify spots per cell or per unit area.
Title: Proximity Ligation Assay for GLUT4 Docking
The Scientist's Toolkit: Research Reagent Solutions
Table 2: Essential Reagents & Tools for GLUT4 Translocation Research
| Item | Function/Application in Research | Example Product/Catalog # (for reference) |
|---|---|---|
| Phospho-Specific Antibodies | Detecting activation states of signaling nodes (p-Akt Ser473, p-AS160, p-IR Tyr). Crucial for assessing pathway flux. | CST #4060 (p-Akt Ser473), CST #8881 (p-AS160 Thr642) |
| GLUT4 Antibodies (Validated for WB/IF) | Detecting total GLUT4 protein levels and localization via western blot (WB) or immunofluorescence (IF). | Millipore #07-1404 (WB), Abcam ab654 (IF) |
| Cell Surface Protein Isolation Kit (Biotinylation) | Isolating plasma membrane proteins to quantify surface GLUT4. Uses cleavable biotin. | Thermo Scientific #89881 |
| L6 or C2C12 GLUT4-myc/eGFP Reporter Cell Lines | Stably express GLUT4 tagged with an exofacial myc epitope or eGFP. Allows quantitation of surface GLUT4 via anti-myc Ab or live imaging. | Kerafast #C2C12-GLUT4-myc |
| Duolink PLA Kits | For in situ detection of protein-protein interactions/proximity (e.g., GLUT4 vesicle docking). | Sigma-Aldrich DUO92101 |
| Hyperinsulinemic-Euglycemic Clamp Apparatus | Gold-standard in vivo method to measure whole-body and tissue-specific insulin sensitivity in rodents/humans. | Custom systems (e.g., from ADInstruments) |
| Rab GTPase Activity Assays | Pull-down assays to measure activation of specific Rabs (e.g., Rab8A, Rab10, Rab13) involved in GSV trafficking. | CST #8817 (Rab10 Activation Assay Kit) |
| Inhibitors/Activators (Tool Compounds) | Modulating specific pathway nodes (e.g., PI3K inhibitor LY294002, Akt activator SC79). Used for mechanistic studies. | Tocris #1130 (LY294002), Tocris #5749 (SC79) |
Within the broader thesis of GLUT4 translocation regulation in skeletal muscle, this whitepaper examines the mechanisms of pharmacological agents that rescue insulin sensitivity and glucose uptake. We detail the molecular targets and signaling pathways of established therapies—Metformin and Thiazolidinediones (TZDs)—and contrast them with emerging investigational compounds, focusing on their convergent and divergent actions on the GLUT4 translocation machinery.
GLUT4 translocation to the plasma membrane in skeletal muscle is the rate-limiting step for insulin-stimulated glucose disposal. Insulin resistance, a hallmark of type 2 diabetes (T2D), is characterized by defects in this process. Pharmacological "rescue" aims to restore this pathway via insulin-dependent or insulin-sensitizing mechanisms.
Current Therapeutic Agents: Mechanisms of Action
Metformin
Primary Molecular Target: AMP-activated protein kinase (AMPK). Mechanism: Metformin's glucoselowering effects are mediated through both AMPK-dependent and independent pathways.
- AMPK-Dependent: Increases cellular AMP:ATP ratio, leading to allosteric activation of AMPK. Activated AMPK initiates a signaling cascade promoting GLUT4 translocation.
- AMPK-Independent: Includes inhibition of mitochondrial complex I and lysosomal glucose-6-phosphatase, reducing hepatic gluconeogenesis, thereby lowering systemic glucose and insulin levels, which indirectly improves skeletal muscle insulin sensitivity.
Thiazolidinediones (TZDs: Pioglitazone, Rosiglitazone)
Primary Molecular Target: Peroxisome proliferator-activated receptor gamma (PPARγ). Mechanism: TZDs are high-affinity ligands for the nuclear receptor PPARγ. Upon activation, PPARγ heterodimerizes with retinoid X receptor (RXR), binds to PPAR response elements (PPREs), and modulates gene transcription.
- Key Effects: Increased adipogenesis in subcutaneous fat, reduced lipotoxicity, increased adiponectin secretion, and anti-inflammatory effects. In skeletal muscle, these systemic changes reduce fatty acid influx and inflammatory cytokine signaling, thereby ameliorating insulin resistance and facilitating insulin-stimulated GLUT4 translocation.
Investigational Drug Classes & Mechanisms
Emerging compounds target novel nodes within the insulin signaling network to overcome resistance.
- AMPK Direct Activators: e.g., MK-8722. Small molecules designed to allosterically activate AMPK, bypassing the need for altered cellular energy charge, directly stimulating glucose uptake in skeletal muscle.
- PPARγ Sparing/Selective Modulators: e.g., INT131. Designed to activate PPARγ with altered cofactor recruitment, achieving insulin sensitization with reduced side effects (weight gain, edema).
- Small Molecule GLUT4 Translocation Activators: e.g., Compounds from phenotypic screens. These molecules, such as MT-100, act downstream of insulin signaling, potentially targeting proteins like TBC1D4/AS160 or the actin cytoskeleton to directly promote GLUT4 vesicle trafficking and fusion.
- SGLT2 Inhibitors: e.g., Empagliflozin, Dapagliflozin. While primarily acting on the kidney to induce glucosuria, their indirect effects (reduced hyperglycemia, modest weight loss, altered fuel metabolism) contribute to improved systemic and muscular insulin sensitivity.
Data Presentation: Quantitative Comparison of Pharmacological Agents
Table 1: Comparative Analysis of Pharmacological Agents Targeting Insulin Sensitivity
| Agent (Class) | Primary Target | Key Effect on Signaling | Efficacy (Typical HbA1c Reduction) | Major Skeletal Muscle Impact |
|---|---|---|---|---|
| Metformin | AMPK / Complex I | ↑ AMPK activity; ↓ hepatic glucose output | 1.0 - 1.5% | Indirect via systemic insulin lowering; possible direct AMPK activation. |
| Pioglitazone (TZD) | PPARγ | ↑ Adiponectin; ↓ NEFAs; ↓ inflammation | 0.8 - 1.5% | Systemic insulin sensitization; reduced lipotoxicity on muscle. |
| MK-8722 (Invest.) | AMPK (direct) | Direct allosteric activation of AMPK β1-subunit | ~1.5% (preclin.) | Potent, direct stimulation of muscle glucose uptake. |
| INT131 (Invest.) | PPARγ (selective) | Selective PPARγ modulation (SPPARM) | ~0.7 - 1.0% (Phase II) | Systemic insulin sensitization with improved tolerability. |
| MT-100 (Invest.) | Undefined (↓TBC1D4 phospho.) | Insulin-independent GLUT4 translocation | Significant in vitro & rodent models | Direct potentiation of GLUT4 vesicle exocytosis. |
| Empagliflozin (SGLT2i) | SGLT2 | ↑ Glucosuria; ↓ plasma volume; ↑ ketones | 0.6 - 0.8% | Indirect via improved glycemia & fuel switching. |
Experimental Protocols for Key Mechanistic Studies
Protocol: Assessing GLUT4 Translocation via Plasma Membrane Lawn Assay (PMLA)
Objective: Quantify insulin- or drug-stimulated GLUT4 exocytosis in single cells.
- Cell Culture: Differentiate L6 or C2C12 myoblasts stably expressing GLUT4 with an exofacial epitope tag (e.g., myc, HA) into myotubes.
- Stimulation: Serum-starve cells, then treat with pharmacological agent (e.g., 2mM Metformin, 1µM Rosiglitazone pre-treatment, 10nM insulin) for specified time.
- Fixation & Labeling: Rapidly fix cells with 4% PFA without permeabilization. Label exposed exofacial tags with primary (anti-myc) and fluorescent secondary antibodies.
- Image Acquisition & Analysis: Acquire confocal microscopy images. Quantity fluorescence intensity at the plasma membrane versus cytoplasmic regions. Express data as a Membrane:Cytoplasm ratio or fold-change over basal.
Protocol: In Vivo Insulin Signaling and Glucose Uptake in Rodent Muscle
Objective: Evaluate drug effects on insulin pathway activation and glucose disposal in vivo.
- Animal Model: Use insulin-resistant rodents (e.g., diet-induced obese mice, ZDF rats).
- Drug Administration: Administer investigational compound or vehicle chronically (1-4 weeks) or acutely.
- Hyperinsulinemic-Euglycemic Clamp: The gold standard. After an overnight fast, infuse insulin to maintain constant hyperinsulinemia, while co-infusing glucose to maintain euglycemia. The glucose infusion rate (GIR) is a measure of whole-body insulin sensitivity.
- Tissue Collection: During the clamp, administer a bolus of 2-deoxy-[³H]-glucose. Terminally anesthetize and rapidly excise skeletal muscles (e.g., gastrocnemius, soleus).
- Analysis: Measure radiolabeled 2-DG-6-phosphate in muscle homogenates to calculate tissue-specific glucose uptake. Perform Western blot on muscle lysates for phospho-Akt (Ser473), phospho-AS160, etc.
Visualization of Signaling Pathways
The Scientist's Toolkit: Essential Research Reagents
Table 2: Key Reagents for Studying Pharmacological Rescue of GLUT4 Translocation
| Reagent / Material | Function & Application in Research |
|---|---|
| Differentiated L6 or C2C12 Myotubes | Standard in vitro model of skeletal muscle for studying insulin signaling, glucose uptake, and GLUT4 dynamics. |
| GLUT4-myc/HA Reporter Cell Lines | Myoblasts stably expressing GLUT4 with an exofacial epitope tag (myc, HA) enable quantitative measurement of GLUT4 translocation via PMLA or cell-surface ELISA. |
| Phospho-Specific Antibodies | Essential for Western blot analysis of signaling nodes: p-AMPK (Thr172), p-Akt (Ser473), p-AS160/TBC1D4 (Thr642), p-TBC1D1 (Ser237). |
| 2-Deoxy-D-[³H]-Glucose / [¹⁴C]-2-DG | Radiolabeled glucose analog used to measure cellular glucose uptake in vitro and tissue-specific uptake in vivo (trapped as 2-DG-6-phosphate). |
| Hyperinsulinemic-Euglycemic Clamp Setup | Gold-standard in vivo methodology for assessing whole-body and tissue-specific insulin sensitivity in rodent models. Requires programmable infusion pumps, glucose analyzer, and surgical expertise. |
| AMPK & PPARγ Agonists/Antagonists (Tool Compounds) | e.g., AICAR (AMPK activator), Compound C (AMPK inhibitor), Rosiglitazone (PPARγ agonist), GW9662 (PPARγ antagonist). Used as controls to validate pharmacological mechanisms. |
| Insulin-Resistant Animal Models | Diet-Induced Obese (DIO) mice, Zucker Diabetic Fatty (ZDF) rats, or genetic knockouts (e.g., IRS-1 deficient) to test drug efficacy in a disease-relevant context. |
| Seahorse XF Analyzer | Measures real-time cellular metabolic rates (OCR, ECAR) to assess drug effects on mitochondrial function and glycolytic flux, relevant for Metformin and AMPK activators. |
This whitepaper explores the comparative regulation of the glucose transporter type 4 (GLUT4) in cardiac and adipose tissues, framed within the broader context of understanding the fundamental translocation process in skeletal muscle. While skeletal muscle is the primary site for insulin-stimulated glucose disposal, contrasting the molecular mechanisms in heart and fat cells reveals critical, tissue-specific adaptations and exposes potential universal regulatory nodes for therapeutic intervention in metabolic diseases like type 2 diabetes and heart failure.
Core Regulatory Mechanisms: A Comparative Analysis
GLUT4 translocation from intracellular storage vesicles (GSVs) to the plasma membrane is the rate-limiting step for glucose uptake in insulin-sensitive tissues. While the core pathway—PI3K/Akt signaling—is shared, key differences in upstream triggers, downstream effectors, and kinetic profiles define tissue-specific physiology.
Key Signaling Pathways
The following diagram illustrates the comparative signaling pathways leading to GLUT4 translocation in cardiac and adipose tissue, highlighting points of convergence and divergence.
Title: GLUT4 Signaling in Cardiac vs. Adipose Tissue
Quantitative Comparison of GLUT4 Dynamics
The kinetic and quantitative parameters of GLUT4 regulation differ substantially between tissues, as summarized below.
Table 1: Quantitative Comparison of GLUT4 Regulation
| Parameter | Cardiac Tissue | Adipose Tissue (3T3-L1/Mature Adipocyte) | Notes / Method |
|---|---|---|---|
| Basal Surface GLUT4 | ~1-5% of total | <5% of total | Measured by surface biotinylation or photo-labeling. |
| Max Insulin-Stimulated Surface Increase | ~4-6 fold | ~10-15 fold | Adipocytes show greater dynamic range. |
| Time to Half-Maximal Translocation | ~2-3 minutes | ~5-7 minutes | Cardiac response is more rapid. |
| GLUT4 Protein Content (per mg tissue) | ~10-20 pmol | ~50-200 pmol (sc depot-dependent) | Adipose content highly variable with depot and obesity. |
| Contraction-Stimulated Increase | ~2-3 fold (AMPK-mediated) | Negligible | Isolated cardiac myocyte or perfused heart models. |
| Akt Phosphorylation Threshold | Lower | Higher | Cardiac muscle is more insulin-sensitive at the signaling level. |
| Impact of AS160 Knockout | Moderate increase in basal uptake | Dramatic increase in basal uptake (~80% of max) | Highlights stronger repression by AS160 in adipose tissue. |
Detailed Experimental Protocols
To elucidate the mechanisms outlined above, several key methodologies are employed across model systems.
Protocol 1: Isolation of Adult Rat Cardiomyocytes for GLUT4 Translocation Assay
This protocol is used to study insulin and contraction-stimulated GLUT4 trafficking in a physiologically relevant cardiac model.
- Heart Perfusion & Digestion: Anesthetize rat (e.g., 250g Sprague-Dawley). Excise heart rapidly and mount on Langendorff perfusion apparatus. Perfuse with calcium-free Tyrode's buffer (37°C, 5 min) followed by digestion buffer (Tyrode's with 1 mg/mL Collagenase Type II, 0.1 mg/mL Protease XIV, 50 µM Ca²⁺) for 15-20 min.
- Cell Dissociation & Calcium Re-introduction: Mince the softened ventricular tissue, filter through a 200 µm nylon mesh, and pellet cardiomyocytes by gentle centrifugation (20g, 1 min). Gradually re-introduce calcium to 1.2 mM over 30 minutes in suspension buffer (BSA-supplemented).
- Stimulation: Aliquot viable, rod-shaped myocytes. Stimulate with: a) 100 nM Insulin (10-20 min), b) 1 mM 5-Aminoimidazole-4-carboxamide ribonucleotide (AICAR, AMPK activator, 30 min), or c) Field stimulation (1 Hz, 5 ms pulses) to mimic contraction.
- Surface GLUT4 Labeling: Immediately treat cells with a non-cell-permeable, cleavable biotinylation reagent (e.g., Sulfo-NHS-SS-Biotin, 1 mg/mL in PBS-Ca/Mg) on ice for 30 min. Quench with 100 mM glycine.
- Lysis & Pull-Down: Lyse cells in RIPA buffer with protease/phosphatase inhibitors. Clarify lysate. Incubate an aliquot with Streptavidin-agarose beads overnight at 4°C to isolate biotinylated (surface) proteins.
- Analysis: Wash beads, elute proteins in Laemmli buffer. Analyze total lysate (Total GLUT4) and streptavidin pull-down (Surface GLUT4) by SDS-PAGE and immunoblotting using anti-GLUT4 antibody. Quantify band intensity.
Protocol 2: In Vitro Reconstitution of GLUT4 Vesicle Tethering Using Adipocyte Lysates
This assay dissects the final steps of GLUT4 vesicle docking/fusion, leveraging adipose tissue's high GLUT4 content.
- Preparation of GLUT4 Vesicles: Differentiate 3T3-L1 fibroblasts into adipocytes. Stimulate with 100 nM insulin for 15 min. Homogenize cells in a low-salt buffer (20 mM HEPES, 250 mM sucrose, pH 7.4) with protease inhibitors. Perform differential centrifugation: clear nuclei/debris (1,000g, 10 min), then pellet total membranes (200,000g, 1 hr).
- Immunoisolation of GLUT4 Vesicles: Resuspend membrane pellet. Incubate with anti-GLUT4 antibody conjugated to magnetic Protein G beads for 2 hrs at 4°C. Wash thoroughly to obtain purified GSVs.
- Preparation of Cytosolic Fractions & Plasma Membranes: From unstimulated adipocytes, prepare a cytosolic fraction (supernatant from 200,000g spin) and a plasma membrane fraction via sucrose density gradient centrifugation.
- Tethering Reaction: Combine in a test tube: Purified GSVs (from step 2), plasma membrane sheets, cytosol (as a source of proteins), an ATP-regenerating system (1 mM ATP, 10 mM creatine phosphate, 100 µg/mL creatine kinase), and insulin-stimulated cell lysate (or specific recombinant proteins like active Rab10, Exocyst components). Incubate at 37°C for 30 min.
- Quantification: Pellet plasma membranes. Analyze co-sedimentation of GLUT4 with the plasma membrane fraction by immunoblotting. Alternatively, use a fluorescence readout if GSVs are labeled with a fluorescent anti-GLUT4 antibody.
The Scientist's Toolkit: Research Reagent Solutions
Table 2: Essential Reagents for GLUT4 Translocation Research
| Reagent / Material | Function & Application | Key Considerations |
|---|---|---|
| Anti-GLUT4 Antibody (e.g., clone 1F8) | Immunoblotting, immunofluorescence, immunoisolation of GSVs. Critical for quantifying total and localized GLUT4. | Must be specific to the intracellular C-terminus for most applications; validation in knockout cells is essential. |
| Cleavable Biotinylation Reagents (Sulfo-NHS-SS-Biotin) | Selective labeling of cell surface proteins for pulse-chase or end-point quantification of GLUT4 translocation. | Cleavability allows validation. Must work on ice to block endocytosis. Requires streptavidin pull-down for analysis. |
| IR/IGF-1R Tyrosine Kinase Inhibitor (e.g., HNMPA or BMS-754807) | Pharmacological inhibition of insulin receptor signaling to establish specificity of insulin's effects on GLUT4. | Selectivity profile vs. IGF-1R is important. Used in dose-response studies. |
| Akt Inhibitor (e.g., MK-2206, allosteric) | To probe the dependency of GLUT4 translocation on Akt activation downstream of insulin. | Confirms the role of Akt in a given tissue context. Often used with Akt phosphorylation antibodies (pSer473, pThr308). |
| Constitutively Active & Dominant-Negative Adenoviruses (e.g., CA-Akt, DN-AS160) | Genetic manipulation of signaling components in primary cells (like cardiomyocytes or adipocytes) to establish necessity and sufficiency. | High transduction efficiency in hard-to-transfect cells is key. Controls for viral load and off-target effects are required. |
| Total Internal Reflection Fluorescence (TIRF) Microscopy Setup | Live-cell imaging of single GLUT4 vesicle trafficking and fusion events at the plasma membrane. | Requires stable expression of GLUT4 tagged with a pH-insensitive fluorophore (e.g., GLUT4-mCherry). Provides unmatched spatial-temporal resolution. |
| GLUT4 Reporter (pHluorin-GLUT4) | A genetically encoded reporter where a pH-sensitive GFP (pHluorin) is inserted into an exofacial loop of GLUT4. Fluorescence increases upon vesicle fusion and exposure to neutral extracellular pH. | Enables real-time, quantitative imaging of translocation kinetics without surface labeling. Must be validated for correct trafficking. |
The comparative analysis of cardiac and adipose tissue GLUT4 regulation underscores that while the canonical insulin signaling axis is paramount, tissue-specific modifiers—such as AMPK in the heart and adipokine signaling in fat—profoundly shape the physiological response. Insights gained from these comparisons, particularly regarding the differential control of AS160 and the exocyst complex, provide a refined roadmap for targeting GLUT4 translocation in a tissue-selective manner, offering promising avenues for the next generation of metabolic and cardiovascular therapeutics.
Within the broader thesis of understanding insulin-stimulated GLUT4 translocation in skeletal muscle, demonstrating the translocation of the GLUT4 vesicle to the plasma membrane (PM) is only the first step. The critical, functional validation lies in proving that this translocation event results in increased glucose transport activity. This guide details the methodology and rationale for correlating direct measures of GLUT4 translocation with functional glucose uptake assays, thereby moving from correlative observation to causative functional validation—a cornerstone for research in metabolic diseases and drug development targeting insulin resistance.
Core Methodologies for Correlation
Measuring GLUT4 Translocation: The Cell Surface Assay
This protocol quantifies GLUT4 present at the plasma membrane.
- Principle: An exofacial (external) epitope tag (e.g., HA, Myc, or FLAG) is inserted into the first extracellular loop of GLUT4. Transfected cells (e.g., L6-GLUT4myc myotubes, C2C12-GLUT4HA) are treated, then surface-labeled while intact.
- Detailed Protocol:
- Cell Culture: Differentiate L6 or C2C12 myoblasts into myotubes expressing epitope-tagged GLUT4.
- Stimulation: Serum-starve cells (2-6 hours), then stimulate with insulin (e.g., 100 nM, 20 min) or other compounds.
- Surface Labeling (Intact Cells): Place cells on ice, wash with cold PBS. Incubate with primary antibody against the exofacial tag (e.g., anti-HA) in cold PBS/1% BSA for 1 hour at 4°C. This prevents antibody internalization.
- Fixation and Detection: Fix cells with 4% PFA (10 min, 4°C). Permeabilize only if using indirect immunofluorescence for visualization. For quantification by colorimetric/chemiluminescent ELISA: After fixing, incubate with HRP-conjugated secondary antibody (or use an HRP-conjugated primary antibody in step 3). Develop using TMB or luminescent substrate and measure absorbance/luminescence.
- Normalization: Total GLUT4 content is determined from parallel wells lysed and subjected to total GLUT4 immunoblotting. Surface GLUT4 is expressed as a percentage of total or as fold-change over basal.
Measuring Functional Output: The 2-Deoxyglucose (2-NBDG) Uptake Assay
This protocol measures the rate of glucose uptake into cells.
- Principle: 2-Deoxy-D-glucose (2-DG) is a non-metabolizable glucose analog. Its fluorescent derivative, 2-(N-(7-Nitrobenz-2-oxa-1,3-diazol-4-yl)Amino)-2-Deoxyglucose (2-NBDG), allows real-time or endpoint quantification of uptake via fluorescence.
- Detailed Protocol:
- Preparation: Differentiate and serum-starve myotubes as above.
- Stimulation: Stimulate with insulin/compound as in 2.1.
- Uptake Phase: Replace medium with KRPH buffer (Krebs-Ringer-HEPES, pH 7.4) containing 2-NBDG (e.g., 100 µM). Incubate for a precise time (e.g., 10-20 min) at 37°C.
- Termination and Washing: Rapidly aspirate the 2-NBDG solution and wash cells 3-4 times with ice-cold PBS containing 0.1% BSA or excess unlabeled D-glucose to stop uptake and remove extracellular fluorescence.
- Quantification: For plate readers, lyse cells in 1% Triton X-100/PBS and measure fluorescence (Ex/Em ~465/540 nm). For imaging, fix cells lightly (2% PFA, 10 min) and image immediately. Include wells treated with Cytochalasin B (10 µM), a GLUT inhibitor, to define non-specific uptake.
- Normalization: Normalize fluorescence to total cellular protein (via BCA assay) or cell number.
Data Presentation & Correlation Analysis
Table 1: Representative Quantitative Data from a Correlation Experiment in L6-GLUT4myc Myotubes
| Experimental Condition | Surface GLUT4 (ELISA, Abs 450nm) | Normalized Surface GLUT4 (% of Basal) | 2-NBDG Uptake (RFU/µg protein) | Normalized Glucose Uptake (% of Basal) |
|---|---|---|---|---|
| Basal (No Insulin) | 0.15 ± 0.02 | 100 ± 13 | 850 ± 95 | 100 ± 11 |
| Insulin (100 nM, 20 min) | 0.52 ± 0.05 | 347 ± 33 | 3200 ± 210 | 376 ± 25 |
| Insulin + PI3K Inhibitor (LY294002) | 0.18 ± 0.03 | 120 ± 20 | 920 ± 110 | 108 ± 13 |
| Compound X (10 µM) | 0.41 ± 0.04 | 273 ± 27 | 2800 ± 195 | 329 ± 23 |
Correlation Analysis: Plot normalized surface GLUT4 against normalized glucose uptake for all conditions. A strong linear correlation (R² > 0.9) validates that the compound/condition's primary effect is on GLUT4 translocation. Significant deviation from this line suggests additional post-translational modulation of GLUT4 activity or engagement of alternate transporters.
Visualizing the Workflow and Signaling Pathway
The Scientist's Toolkit: Research Reagent Solutions
Table 2: Essential Materials for Translocation & Uptake Correlation Studies
| Item | Function & Rationale |
|---|---|
| L6-GLUT4myc or C2C12-GLUT4HA Cell Line | Stably expresses GLUT4 with an exofacial epitope tag, enabling specific detection at the plasma membrane without interference from intracellular pools. |
| Anti-HA or Anti-Myc Antibody (for surface labeling) | High-affinity, monoclonal antibody specific for the exofacial tag. Must be used on intact, non-permeabilized cells for valid surface measurement. |
| HRP-Conjugated Secondary Antibody (for ELISA) | Enables colorimetric (TMB) or chemiluminescent quantification of surface-bound primary antibody in a high-throughput plate reader format. |
| 2-NBDG (Fluorescent Glucose Analog) | The key reagent for functional uptake assays. Its fluorescence allows direct, real-time measurement of glucose transporter activity. |
| Cytochalasin B | A potent, non-competitive inhibitor of facilitative glucose transporters. Serves as a critical negative control to define non-specific background uptake in 2-NBDG assays. |
| Recombinant Human Insulin | The canonical positive control stimulus for the insulin-signaling pathway, inducing maximal GLUT4 translocation and glucose uptake in skeletal muscle models. |
| PI3-Kinase Inhibitor (e.g., LY294002 or Wortmannin) | A critical pharmacological tool to inhibit the canonical insulin signaling pathway, demonstrating the specificity of the observed effects on GLUT4 translocation and uptake. |
| KRPH Buffer | A physiologically balanced salt buffer (Krebs-Ringer-HEPES) used during the glucose uptake assay to maintain cell viability and provide proper ionic conditions for transporter function. |
Conclusion
The GLUT4 translocation process in skeletal muscle represents a highly orchestrated and critical nexus for systemic glucose regulation. A deep foundational understanding of its molecular players—from insulin receptor signaling to vesicle fusion machinery—is essential. While methodological advances now allow precise spatial and temporal tracking of GLUT4, researchers must carefully optimize and validate their chosen assays to avoid common pitfalls. Comparative analyses confirm that while insulin and exercise pathways converge on GLUT4, they are distinct, offering complementary therapeutic targets. The clear dysregulation of this process in insulin resistance validates it as a premier target for drug development. Future research must leverage emerging technologies, such as CRISPR screening and in vivo imaging, to unravel remaining complexities in human physiology and to develop next-generation therapeutics that specifically and safely enhance GLUT4 translocation to combat diabetes and related metabolic disorders.