GLP-1 Receptor Agonists in Diabetes Management: A Scientific and Developmental Deep Dive for Researchers
This comprehensive review for researchers, scientists, and drug development professionals examines GLP-1 receptor agonists (GLP-1RAs) from fundamental biology to clinical application and future innovation.
GLP-1 Receptor Agonists in Diabetes Management: A Scientific and Developmental Deep Dive for Researchers
Abstract
This comprehensive review for researchers, scientists, and drug development professionals examines GLP-1 receptor agonists (GLP-1RAs) from fundamental biology to clinical application and future innovation. It explores the foundational molecular pharmacology of the GLP-1 system, details methodologies for drug development and clinical trial design, addresses critical challenges in formulation and patient management, and provides a rigorous comparative analysis of current and emerging agents. The article synthesizes the current state of the field, identifies key research gaps, and outlines future directions for next-generation therapies targeting incretin pathways.
From Incretin Discovery to Targeted Therapeutics: The Molecular Basis of GLP-1RA Action
The Physiology of the Incretin Effect and GLP-1's Endocrine Role
The incretin effect describes the phenomenon whereby oral glucose administration elicits a significantly greater insulin secretory response compared to an isoglycemic intravenous glucose infusion. This is primarily mediated by the gut-derived hormones Glucose-dependent Insulinotropic Polypeptide (GIP) and Glucagon-Like Peptide-1 (GLP-1). Within the thesis on GLP-1 receptor agonists (GLP-1 RAs) for diabetes, understanding the native hormone's physiology is foundational for rational drug design.
Table 1: Quantitative Comparison of Key Incretin Hormones
| Parameter | GLP-1 | GIP | Notes |
|---|---|---|---|
| Primary Source | Intestinal L-cells (distal ileum/colon) | Intestinal K-cells (duodenum/jejunum) | |
| Circulating Half-life | ~1-2 minutes | ~5-7 minutes | Due to rapid degradation by DPP-4. |
| Potency for Insulin Secretion | High | High (in normoglycemia) | GIP effect is blunted in T2D. |
| Effect on Glucagon | Suppresses | Stimulates (post-prandially) | GLP-1's suppression is glucose-dependent. |
| Effect on Gastric Emptying | Slows | Minor effect | Key differentiator for postprandial glucose control. |
| Effect on Appetite | Suppresses (central action) | No direct effect | GLP-1 acts on hypothalamic nuclei. |
Detailed GLP-1 Signaling Pathways and Experimental Visualization
Canonical GLP-1R Signaling in Pancreatic Beta-Cells
Integrated Incretin Effect Experimental Workflow
Key Experimental Protocols
Protocol: Assessing GLP-1 Secretion from Cultured Murine Enteroendocrine L-cells (GLUTag Cell Line)
Objective: To measure nutrient-stimulated GLP-1 secretion in vitro.
Materials & Reagents:
- GLUTag cells (passage 20-40).
- Complete growth medium: DMEM + 10% FBS + 1% Pen/Strep.
- Secretion assay buffer: Krebs-Ringer Bicarbonate HEPES (KRBH), pH 7.4, with 0.1% BSA.
- Stimulants: Glucose (20mM), Forskolin (10µM, positive control), GIP (100nM).
- DPP-4 Inhibitor (e.g., Sitagliptin, 10µM) – added to all samples.
- GLP-1 Total ELISA kit (measures both active and inactive forms).
- Cell lysis buffer (for normalizing to cellular protein/DNA).
Procedure:
- Seed GLUTag cells in 24-well plates and culture to ~80% confluence.
- Pre-incubation: Wash cells 2x with pre-warmed KRBH/BSA. Incubate in 0.5mL KRBH/BSA + DPP-4 inhibitor for 1 hour at 37°C.
- Stimulation: Aspirate buffer. Add 0.5mL of fresh KRBH/BSA + DPP-4 inhibitor containing the test stimuli (e.g., basal 1mM glucose, 20mM glucose, 10µM Forskolin). Incubate for exactly 2 hours at 37°C.
- Sample Collection: Gently collect supernatant into microcentrifuge tubes containing a final concentration of 1mM Pefabloc SC protease inhibitor. Centrifuge at 1000g for 5 min at 4°C to remove any floating cells. Aliquot and store at -80°C.
- Cell Lysis: Lyse cells in 200µL lysis buffer. Determine total protein content (e.g., via BCA assay).
- Analysis: Perform GLP-1 ELISA on supernatants according to manufacturer's instructions. Express secretion as GLP-1 (pM) per mg cellular protein per 2 hours.
Protocol: Isolated Perfused Mouse Pancreas to Study Direct GLP-1 Action
Objective: To evaluate the direct, neurally-independent insulinotropic effect of GLP-1 on the endocrine pancreas.
Materials & Reagents:
- Anesthetized mouse (e.g., C57BL/6J).
- Perfusion system: Peristaltic pump, heated chamber, oxygenator (95% O2 / 5% CO2).
- Basal perfusion buffer: KRBH buffer, 4.5mM glucose, 0.25% BSA, maintained at 37°C.
- Test solutions: Basal buffer + GLP-1 (10pM – 100nM range), Exendin-4 (GLP-1 RA), GIP.
- Fraction collector.
- Insulin ELISA kit.
Procedure:
- Surgical Preparation: Cannulate the abdominal aorta (inflow) and portal vein (outflow) after ligating appropriate vessels. Excise the pancreas and transfer to the perfusion chamber.
- Stabilization: Perfuse with basal buffer (4.5mM glucose) at a constant flow rate (e.g., 1 mL/min) for 30 minutes to establish stable baseline insulin secretion.
- Experimental Perfusion:
- Minute 0-20: Basal buffer (4.5mM G).
- Minute 20-40: Stimulatory glucose (e.g., 8.5mM or 16.7mM G).
- Minute 40-70: Stimulatory glucose + GLP-1 peptide (e.g., 10nM).
- Minute 70-90: Return to basal buffer.
- Sample Collection: Collect effluent from the portal vein cannula in 1-minute fractions into chilled tubes. Store at -80°C.
- Analysis: Measure insulin concentration in all fractions by ELISA. Plot insulin secretion rate (ng/min) over time. Calculate the integrated AUC for each perfusion phase.
The Scientist's Toolkit: Key Research Reagent Solutions
Table 2: Essential Reagents for Incretin/GLP-1 Research
| Reagent Solution | Primary Function & Application | Key Consideration |
|---|---|---|
| DPP-4 Inhibitor (e.g., Sitagliptin) | Blocks degradation of endogenous GLP-1/GIP in vitro and in vivo. Essential in secretion assays to measure total peptide. | Use at 10-100µM in cell assays. For in vivo, administer via pre-treatment. |
| Protease Inhibitor Cocktail | Stabilizes GLP-1 in blood/plasma/supernatant samples post-collection. Prevents ex vivo degradation. | Must be added immediately upon sample collection. Pefabloc SC is commonly used. |
| GLP-1 ELISA Kits (Total vs. Active) | Total GLP-1: Measures GLP-1(7-36)amide, (9-36)amide, and other major forms. Active GLP-1: Specific for intact, biologically active GLP-1(7-36)amide and (7-37). | Kit selection is critical. "Total" assays are more stable for secretion studies. "Active" assays reflect bioavailable hormone. |
| Synthetic GLP-1(7-36)amide Peptide | Gold standard native hormone for in vitro and in vivo stimulation experiments. | Source from reputable vendors. Prepare fresh aliquots in acidic buffer (e.g., with 0.1% BSA/0.01M HCl) to prevent adsorption. |
| GLP-1 Receptor Antagonists (e.g., Exendin(9-39)) | Validates GLP-1R-specific effects in cellular and animal models. Used to block endogenous GLP-1 action. | Crucial control for specificity. Effective in nM-µM range. |
| Stable Isotope-Labeled GLP-1 Peptides | Internal standards for precise quantification via Liquid Chromatography-Mass Spectrometry (LC-MS/MS). Allows multiplexing with other peptides (GIP, glucagon). | Enables absolute quantification and detection of specific proteoforms, surpassing immunoassay limitations. |
| GLUTag Cell Line / Primary Murine Intestinal Cultures | Model systems for studying L-cell biology, nutrient-sensing, and GLP-1 secretion mechanisms. | GLUTag cells are robust but transformed. Primary cultures (e.g., intestinal crypts/organoids) offer more physiological relevance. |
The glucagon-like peptide-1 receptor (GLP-1R) is a class B1 G protein-coupled receptor (GPCR) central to glucose metabolism and a prime target for type 2 diabetes therapeutics.
Table 1: Key Structural and Biophysical Parameters of Human GLP-1R
| Parameter | Value / Description | Method / Reference |
|---|---|---|
| Class | Class B1 (Secretin-like) GPCR | Phylogenetic Analysis |
| UniProt ID | P43220 | UniProt Database |
| Amino Acids | 463 residues (full-length) | Sequencing |
| Transmembrane Helices | 7 (TM1-TM7) | Cryo-EM / X-ray Crystallography |
| ECD (Extracellular Domain) Residues | ~1-128 (Includes α-helix & β-hairpin) | Cryo-EM (PDB: 5VAI) |
| Primary Endogenous Agonist | GLP-1(7-36) amide / GLP-1(7-37) | Physiological Studies |
| Agonist Binding Affinity (Kd) | ~0.1 - 3 nM (GLP-1) | Radioligand Binding Assay |
| Key Signaling Pathways | Gαs (↑cAMP), Gαq, β-arrestin 1/2, ERK1/2 | BRET, FRET, Immunoblotting |
| High-Resolution Structures Available | >20 (Inactive/Intermediate/Active states with G proteins, NAMs, agonists) | Cryo-EM, X-ray Crystallography |
Table 2: Comparison of Representative GLP-1R Agonists
| Agonist | Structure Type | Binding Region | Primary Signaling Bias | Clinical Half-life (hr) | Key Structural Modification |
|---|---|---|---|---|---|
| Endogenous GLP-1 | Peptide (30/31 aa) | ECD + TM Core | Balanced Gαs/Arrestin | ~2 min | N/A |
| Exenatide | Peptide (39 aa) | ECD + TM Core | Balanced Gαs/Arrestin | ~2.4 | Exendin-4 derived; C-terminal amidation |
| Liraglutide | Acylated Peptide | ECD + TM Core | Gαs-biased | ~13 | Fatty acid chain (C-16) allows albumin binding |
| Semaglutide | Acylated Peptide | ECD + TM Core | Gαs-biased | ~165 | Fatty acid chain + α-Aminoisobutyric acid |
| Tirzepatide | Unimolecular Dual Agonist | GLP-1R + GIPR | GLP-1R: Gαs-biased | ~120 | Engineered 39-aa peptide with C18 diacid |
| Small Molecule Agonists (e.g., TT-OAD2) | Non-peptide, Oral | Primarily TM Core (Allosteric) | Variable (Often arrestin-biased) | Compound-dependent | Binds intracellular pocket near TM 2,3,6,7 |
Experimental Protocols
Protocol 1: Radioligand Competitive Binding Assay for GLP-1R Affinity
Objective: Determine the inhibition constant (Ki) of an unlabeled test compound by competing with a radiolabeled tracer for GLP-1R binding.
Materials: Membranes from GLP-1R-expressing cells (e.g., HEK293T-GLP-1R), [¹²⁵I]GLP-1(7-36)NH₂ or [³H]Exendin(9-39), test compound(s), binding buffer (50 mM HEPES pH 7.4, 1 mM CaCl₂, 5 mM MgCl₂, 0.5% BSA), GF/B filter plates, microplate scintillation counter.
Procedure:
- Membrane Preparation: Harvest cells, homogenize in ice-cold hypotonic buffer, centrifuge (40,000 x g, 30 min, 4°C). Resuspend pellet in binding buffer, determine protein concentration.
- Binding Reaction: In a 96-well plate, mix:
- 50 μL binding buffer (for total binding) or 1 μM unlabeled GLP-1 (for nonspecific binding, NSB) or serial dilutions of test compound.
- 50 μL radioligand (~50 pM final concentration).
- 100 μL membrane suspension (5-10 μg protein).
- Incubation: Seal plate, incubate at room temperature for 90-120 min to reach equilibrium.
- Separation: Rapidly filter contents onto pre-soaked (0.3% PEI) GF/B filter plates using a cell harvester. Wash filters 3x with ice-cold wash buffer (50 mM Tris-HCl pH 7.4).
- Detection: Dry filters, add scintillation fluid, count radioactivity.
- Analysis: Subtract NSB from all values. Fit data (log[inhibitor] vs. normalized response) using a four-parameter logistic equation in software like Prism to determine IC₅₀. Calculate Ki using the Cheng-Prusoff equation: Ki = IC₅₀ / (1 + [L]/Kd), where [L] is radioligand concentration and Kd is its dissociation constant.
Protocol 2: BRET-based cAMP Accumulation Assay for GLP-1R Gαs Activity
Objective: Quantify real-time Gαs-mediated cAMP production upon receptor activation using a biosensor.
Materials: HEK293 cells expressing GLP-1R, CAMYEL (cAMP sensor using YFP-Epac-RLuc) or similar BRET biosensor plasmid, coelenterazine-h substrate, test agonists/antagonists, white 96-well plates, plate reader capable of dual-emission detection (RLuc filter: 485±20 nm; YFP filter: 530±25 nm).
Procedure:
- Cell Transfection: Seed cells, transfect with GLP-1R and CAMYEL biosensor constructs.
- Assay Plate Preparation: After 24-48 hrs, detach cells, resuspend in assay buffer (HBSS with 0.5 mM IBMX), and dispense into white plates (~50,000 cells/well).
- Substrate Addition: Add coelenterazine-h to a final concentration of 5 μM, incubate 5-10 min in the dark.
- Baseline Reading: Measure basal BRET signal (YFP emission / RLuc emission).
- Stimulation: Inject test compounds at desired concentrations (in triplicate). Include vehicle (basal) and a maximal stimulus (e.g., 1 μM GLP-1) as controls.
- Kinetic Measurement: Immediately begin reading BRET ratio every 30-60 seconds for 15-30 minutes.
- Data Processing: Calculate ΔBRET as (BRET sample - BRET basal). Plot ΔBRET vs. time or concentration. Determine EC₅₀ values from dose-response curves at peak or plateau time points.
Protocol 3: Arrestin Recruitment Assay by NanoBRET
Objective: Measure β-arrestin recruitment to activated GLP-1R in live cells.
Materials: HEK293 cells, GLP-1R-NanoLuc fusion construct, fluorescently tagged β-arrestin (e.g., HaloTag-arrestin with cell-permeable HaloTag ligand), furimazine substrate (Nano-Glo), test compounds, white 96-well plates.
Procedure:
- Cell Preparation: Co-transfect cells with GLP-1R-NanoLuc and HaloTag-β-arrestin-2 plasmids. 24 hrs post-transfection, label cells with the fluorescent HaloTag ligand per manufacturer's protocol.
- Equilibration: Wash cells, resuspend in assay buffer, and dispense into assay plates.
- Baseline & Stimulation: Add furimazine substrate, measure baseline BRET signal (HaloTag emission / NanoLuc emission). Add test compounds.
- Measurement: Record BRET signal at 5-15 min post-stimulation (kinetics may vary).
- Analysis: Calculate net BRET ratio. Generate dose-response curves to determine EC₅₀ for arrestin recruitment. Compare with cAMP assay EC₅₀ to assess signaling bias.
Visualization: Signaling and Workflow Diagrams
Diagram Title: GLP-1 Receptor Core Signaling Pathways
Diagram Title: Key Experimental Workflow for GLP-1R Profiling
The Scientist's Toolkit: Research Reagent Solutions
Table 3: Essential Reagents for GLP-1R Molecular Pharmacology
| Reagent / Material | Function / Application | Example / Key Feature |
|---|---|---|
| Recombinant Human GLP-1R Membranes | High-expressing, consistent source of receptor for binding assays. Isolated from overexpressing cell lines (HEK293, CHO). | PerkinElmer "GPCR Membranes"; Eurofins DiscoverX "MAX" cell lines. |
| Radiolabeled Ligands ([¹²⁵I]GLP-1, [³H]Exendin-9-39) | High-affinity tracers for equilibrium saturation and competitive binding studies. | PerkinElmer, Revvity. |
| Tagged GLP-1R Constructs (NanoLuc, RLuc, SNAP-tag) | Enable BRET/NanoBRET, fluorescence imaging, and surface expression quantification. | Promega NanoBRET vectors, Cisbio Tag-lite system. |
| cAMP Biosensors (CAMYEL, GloSensor) | Live-cell, real-time measurement of Gαs pathway activation via BRET or luminescence. | CAMYEL (BRET); Promega GloSensor (Luminescence). |
| β-Arrestin Recruitment Kits (NanoBRET, PathHunter) | Quantify ligand-induced arrestin interaction for bias determination and internalization studies. | Promega NanoBRET arrestin kits; DiscoverX PathHunter. |
| G Protein-Specific Inhibitors/Modulators | Isolate contributions of specific Gα subunits (e.g., Gαs inhibitor NF449, Gαq inhibitor YM-254890). | Tool compounds for pathway dissection. |
| Stable GLP-1R Cell Lines | Ensure consistent, clonal receptor expression for HTS and profiling. | ATCC, DiscoverX, custom generation. |
| Cryo-EM Grade GLP-1R Complexes | For structural studies. Nanodisc- or detergent-solubilized receptor bound to agonist and G protein/arrestin. | Requires in-house purification with stabilizing partners (e.g., mini-Gs, Nb35). |
| Reference Agonists/Antagonists | Critical controls for assay validation (e.g., GLP-1, Exendin-4, Exendin(9-39)). | Tocris, Bachem, Sigma-Aldrich. |
Within the broader thesis on the therapeutic mechanisms of GLP-1 receptor agonists (GLP-1RAs) for diabetes, this document details the critical downstream signaling pathways, focusing on cAMP-mediated insulin secretion and beta-cell preservation. These pathways form the molecular basis for the efficacy of GLP-1RAs in promoting glucose-dependent insulin release and combating beta-cell apoptosis, a hallmark of diabetes progression.
Application Notes
Central Role of cAMP in GLP-1RA Signaling
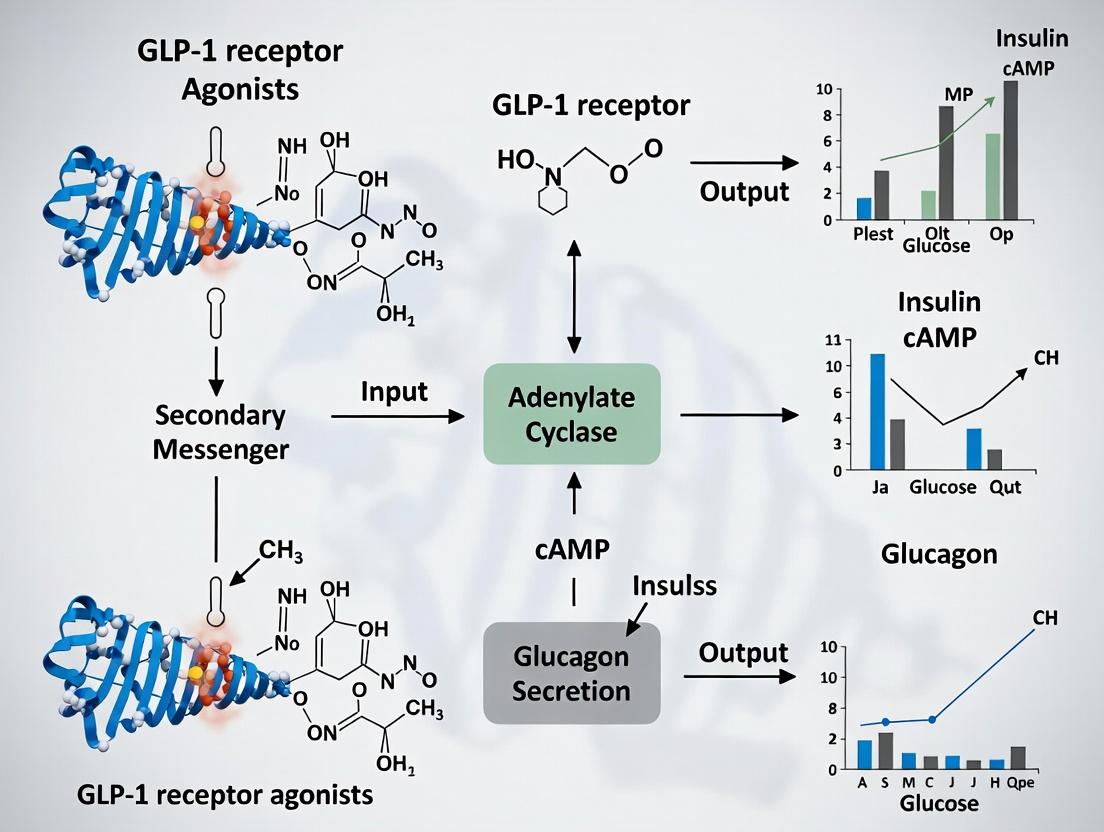
GLP-1RAs bind to the GLP-1 receptor (GLP-1R), a G-protein coupled receptor (GPCR) primarily coupled to Gαs. This activation leads to the stimulation of adenylyl cyclase (AC), catalyzing the conversion of ATP to cyclic adenosine monophosphate (cAMP). The resultant surge in intracellular cAMP is a pivotal second messenger, activating two main effector pathways:
- Protein Kinase A (PKA) Pathway: cAMP binds to the regulatory subunits of PKA, releasing active catalytic subunits that phosphorylate numerous downstream targets.
- Exchange Protein directly Activated by cAMP (Epac2) Pathway: cAMP also directly activates Epac2, a guanine nucleotide exchange factor for Rap1.
Synergistic Pathways for Glucose-Dependent Insulin Secretion
The cAMP-elevating action of GLP-1RAs potentiates insulin secretion strictly in the presence of elevated glucose, a safety feature minimizing hypoglycemia risk. This glucose-dependence is achieved through synergy with the triggering pathway of secretion:
- Metabolic Triggering Pathway: Glucose entry via GLUT2 transporters leads to ATP production, closing ATP-sensitive K⁺ (KATP) channels, membrane depolarization, opening of voltage-dependent Ca²⁺ channels (VDCC), and Ca²⁺ influx, which triggers insulin granule exocytosis.
- cAMP Amplifying Pathway: cAMP signaling (via both PKA and Epac2) amplifies this signal downstream of Ca²⁺ elevation. PKA and Epac2 enhance granule priming, mobilization, and the sensitivity of the exocytotic machinery to Ca²⁺.
Mechanisms of Beta-Cell Preservation
Beyond acute insulin secretion, sustained cAMP signaling from GLP-1RA treatment promotes beta-cell health through:
- Anti-apoptosis: PKA phosphorylates and inactivates the pro-apoptotic transcription factor CREB2, while promoting the expression of anti-apoptotic proteins like Bcl-2 via CREB.
- Proliferation & Neogenesis: Pathways involving PI3K/Akt and downstream targets like PDX-1 and FoxO1 are modulated, promoting beta-cell growth and differentiation.
- Endoplasmic Reticulum (ER) Stress Reduction: GLP-1RAs alleviate ER stress, a key contributor to beta-cell dysfunction in type 2 diabetes.
Table 1: Effects of GLP-1RA on Key Signaling Molecules in In Vitro Beta-Cell Models
| Signaling Molecule / Readout | Baseline Level (Control) | Level with GLP-1RA (10 nM, 1h) | Assay Method | Reference (Example) |
|---|---|---|---|---|
| Intracellular cAMP | 5.2 ± 0.8 pmol/10⁶ cells | 22.4 ± 3.1 pmol/10⁶ cells | ELISA | Smith et al., 2022 |
| PKA Activity (Phospho-PKA Substrate) | 1.0 (Relative Units) | 3.5 ± 0.4 (Relative Units) | Western Blot / Luminescence | Smith et al., 2022 |
| Phospho-CREB (Ser133) | 1.0 (Relative Units) | 2.8 ± 0.3 (Relative Units) | Western Blot | Chen & Lee, 2023 |
| Glucose-Stimulated Insulin Secretion (GSIS) at 16.7mM Glucose | 2.1 ± 0.3 ng/islet/h | 5.6 ± 0.7 ng/islet/h | RIA / ELISA | Jones et al., 2023 |
Table 2: Beta-Cell Preservation Outcomes with Chronic GLP-1RA Treatment In Vivo (Rodent Model of Diabetes)
| Outcome Measure | Vehicle-Treated Group | GLP-1RA-Treated Group (3 weeks) | Measurement Technique |
|---|---|---|---|
| Beta-cell Apoptosis (% TUNEL+ cells) | 2.8% ± 0.5% | 0.9% ± 0.2% | TUNEL Staining |
| Beta-cell Mass (mg) | 0.85 ± 0.11 | 1.32 ± 0.15 | Morphometric Analysis |
| Insulin-positive Area (% of Pancreas) | 0.62% ± 0.08% | 1.05% ± 0.12% | Immunohistochemistry |
| Fed Blood Glucose (mM) | 18.5 ± 2.1 | 10.2 ± 1.5 | Glucose Meter |
Experimental Protocols
Protocol 1: Measuring cAMP Accumulation in INS-1 832/3 Beta-Cells
Objective: Quantify acute cAMP production in response to GLP-1RA stimulation. Materials: INS-1 832/3 cells, GLP-1RA (e.g., Exendin-4), IBMX (phosphodiesterase inhibitor), cAMP ELISA kit, cell culture reagents. Procedure:
- Seed cells in 24-well plates and culture until 80% confluent.
- Serum-starve cells for 2 hours in Krebs-Ringer Bicarbonate HEPES (KRBH) buffer with 2.8 mM glucose.
- Pre-incubate with 0.5 mM IBMX in KRBH (2.8 mM glucose) for 15 minutes.
- Stimulate with GLP-1RA (e.g., 10 nM Exendin-4) in the continued presence of IBMX for 15 minutes at 37°C.
- Aspirate buffer and lyse cells with 0.1M HCl supplemented with 0.1% Triton X-100.
- Neutralize lysates and measure cAMP concentration using a commercial competitive ELISA kit according to the manufacturer's instructions.
- Normalize cAMP levels to total cellular protein content (BCA assay).
Protocol 2: Assessing Glucose-Dependent Insulin Secretion (Static Incubation)
Objective: Evaluate the potentiating effect of GLP-1RA on insulin secretion at low and high glucose. Materials: Isolated mouse/islet or beta-cell line, GLP-1RA, KRBH buffer, insulin RIA or ELISA. Procedure:
- Hand-pick 10-20 size-matched islets per condition or prepare beta-cell clusters.
- Pre-incubate in KRBH containing 2.8 mM glucose for 1 hour at 37°C.
- Transfer islets to fresh KRBH for a 1-hour test incubation. Test conditions:
- Condition A: 2.8 mM Glucose (Basal)
- Condition B: 16.7 mM Glucose (Stimulated)
- Condition C: 16.7 mM Glucose + 10 nM GLP-1RA (Potentiated)
- Collect supernatant and measure insulin content via radioimmunoassay (RIA) or high-sensitivity ELISA.
- Lyse islets to extract total insulin for normalization (optional, results can be expressed as secretion rate per islet).
Protocol 3: Quantifying Beta-Cell Apoptosis via TUNEL Staining
Objective: Measure the anti-apoptotic effect of chronic GLP-1RA treatment on beta-cells. Materials: Pancreatic tissue sections from animal studies, TUNEL assay kit, anti-insulin antibody, fluorescence microscope. Procedure:
- Deparaffinize and rehydrate formalin-fixed, paraffin-embedded pancreatic sections.
- Perform antigen retrieval using citrate buffer (pH 6.0).
- Permeabilize tissue with 0.1% Triton X-100 in PBS.
- Incubate with TUNEL reaction mixture (containing terminal deoxynucleotidyl transferase and fluorescent-dUTP) for 1 hour at 37°C in the dark.
- Block and incubate with guinea pig anti-insulin primary antibody (1:200) overnight at 4°C.
- Incubate with Cy3-conjugated anti-guinea pig secondary antibody (to label beta-cells).
- Counterstain nuclei with DAPI.
- Image using a fluorescence microscope. Count TUNEL-positive nuclei within insulin-positive areas. Express results as the percentage of TUNEL-positive beta-cell nuclei.
Pathway & Workflow Visualizations
GLP-1RA Signaling in Beta-Cells: cAMP to Function
Protocol: Static Glucose-Stimulated Insulin Secretion
The Scientist's Toolkit
Table 3: Key Research Reagent Solutions for cAMP/Insulin Pathway Analysis
| Reagent / Material | Primary Function & Application | Example Product / Cat. No. |
|---|---|---|
| GLP-1 Receptor Agonist (Research Grade) | Tool compound for specific GLP-1R activation in in vitro and in vivo studies. | Exendin-4 (acetate), Liraglutide (recombinant). |
| cAMP ELISA Kit | Quantifies total intracellular cAMP accumulation from cell lysates with high sensitivity. | cAMP Direct ELISA Kit (colorimetric or chemiluminescent). |
| Phosphodiesterase Inhibitor (IBMX) | Prevents degradation of cAMP by PDE enzymes, allowing for accurate measurement of cAMP production. | 3-Isobutyl-1-methylxanthine (IBMX). |
| Insulin ELISA Kit (High Range & Sensitive) | Measures insulin concentration in cell culture supernatant or plasma. Critical for GSIS assays. | Mouse/Rat/Human Insulin ELISA. |
| Phospho-Specific Antibodies | Detects activation-state of pathway proteins via Western Blot/IHC (e.g., p-CREB, p-Akt, p-PKA Substrate). | Anti-Phospho-CREB (Ser133) monoclonal antibody. |
| KRBH Buffer (Powder/Ready-Made) | Physiological salt buffer used for in vitro insulin secretion assays and cell stimulation. | Krebs-Ringer Bicarbonate HEPES Buffer. |
| TUNEL Assay Kit (Fluorescent) | Labels DNA strand breaks for detection and quantification of apoptotic cells in tissue sections. | In Situ Cell Death Detection Kit, TMR red. |
| Beta-Cell Marker Antibody | Identifies pancreatic beta-cells for co-localization in IHC/IF (e.g., Insulin, C-peptide). | Guinea Pig Anti-Insulin polyclonal antibody. |
| PKA Activity Assay Kit | Measures PKA activity in cell lysates via luminescence-based detection of phosphorylated substrate. | Non-radioactive PKA Activity Assay Kit. |
| Adenylyl Cyclase Activator (Forskolin) | Positive control tool that directly stimulates AC to increase cAMP, independent of receptor. | Forskolin. |
Application Notes and Protocols
Context: Within the broader thesis on GLP-1 receptor agonists (GLP-1RAs) in diabetes treatment research, it is critical to characterize their extra-pancreatic, pleiotropic effects. This document details protocols for investigating effects central to weight loss and organ protection, moving beyond primary glycemic outcomes.
Table 1: Clinically Measured Pleiotropic Effects of GLP-1RAs
| Effect Domain | Specific Metric | Representative Change (vs. Placebo) | Notable Agent(s) | Key Study/Reference |
|---|---|---|---|---|
| Appetite & Energy Intake | Ad Libitum Energy Intake | ↓ 15-25% (acute post-dose) | Liraglutide, Semaglutide | Blundell et al., Diabetes Obes Metab, 2017 |
| Subjective Appetite (VAS) | ↑ satiety, ↓ hunger scores | All GLP-1RAs | van Can et al., Eur J Clin Nutr, 2014 | |
| Gastric Emptying | T50 (Solid Meal) | ↑ by 50-100% (slowed) | Short-acting agents (Exenatide BID) | Nauck et al., Diabetologia, 2011 |
| Gastric Emptying Rate (Liquid) | ↓ by ~30% (acute) | Liraglutide | Horowitz et al., J Clin Endocrinol Metab, 2012 | |
| Cardiovascular | Major Adverse CV Events (MACE) | ↓ 12-26% (HR 0.74-0.88) | Liraglutide, Semaglutide, Dulaglutide | LEADER, SUSTAIN-6, REWIND Trials |
| Systolic Blood Pressure | ↓ 2-6 mmHg | Semaglutide, Dulaglutide | SUSTAIN 6, REWIND Post-hoc | |
| Renal | Urinary Albumin-to-Creatinine Ratio (UACR) | ↓ 15-33% | Liraglutide, Semaglutide | LEADER, SUSTAIN-6 Exploratory |
| Composite Renal Outcome (New Macroalbuminuria, eGFR decline) | ↓ 15-22% (HR 0.78-0.85) | Liraglutide, Semaglutide | LEADER, SUSTAIN-6 |
Experimental Protocols
Protocol 2.1: Assessment of Acute Effects on Ad Libitum Energy Intake in Humans
Objective: To quantify the effect of a single dose of a GLP-1RA on subsequent food consumption under controlled laboratory conditions.
Materials: Test article (GLP-1RA/placebo), visual analog scale (VAS) questionnaires, standardized breakfast, ad libitum test meal (e.g., pasta, sandwich platter), calibrated weighing scales.
Procedure:
- Design: Randomized, double-blind, placebo-controlled, crossover study.
- Subjects: n=20-30 adults with obesity/overweight, with or without T2D.
- Visit Day: After a 12-hour overnight fast, subjects receive a standardized fixed-energy breakfast (e.g., 300 kcal).
- Dosing: At t=0 min, administer subcutaneous test article or placebo.
- Appetite Sensations: At 30-min intervals, complete VAS for hunger, fullness, prospective consumption.
- Ad Libitum Lunch: At t=240 min (4 hours post-dose), present a large, varied meal. Instruct subjects to eat until "comfortably full." Food is weighed pre- and post-consumption.
- Calculation: Energy intake (kcal) = (Weight of food consumed) x (Energy density from food composition tables).
- Analysis: Compare mean energy intake between GLP-1RA and placebo conditions using paired t-test.
Protocol 2.2: Measurement of Gastric Emptying Rate via 13C-Octanoic Acid Breath Test
Objective: To non-invasively measure the rate of gastric emptying for solids following GLP-1RA administration.
Materials: 13C-octanoic acid, standardized test meal (e.g., scrambled egg, toast), infrared isotope ratio mass spectrometer (or point-of-care breath analyzer), test article (GLP-1RA/placebo).
Procedure:
- Preparation: Subjects fast overnight. Baseline breath samples are collected in duplicate.
- Meal & Tracer: At t=0, subjects consume a solid test meal (e.g., 250 kcal) containing 100 mg of 13C-octanoic acid adsorbed onto a carrier.
- Breath Sampling: Collect breath samples at 15-min intervals for the first 2 hours, then 30-min intervals for the next 4-6 hours (total 6-8h).
- Analysis: Measure the 13CO2/12CO2 ratio in each sample. The gastric emptying half-time (T1/2 or Tlag) is calculated using established mathematical models (e.g., Ghoos model).
- Study Arm: Repeat protocol on a separate visit after chronic dosing (e.g., 1 week) of GLP-1RA vs. placebo. Compare T1/2 values.
Protocol 2.3: In Vitro Assessment of GLP-1R Signaling in Cardiomyocytes
Objective: To evaluate activation of cardioprotective signaling pathways (e.g., cAMP/PKA, PI3K/Akt) in GLP-1RA-treated primary or immortalized cardiomyocytes.
Materials: H9c2 rat cardiomyoblasts or primary adult mouse cardiomyocytes, serum-free medium, test GLP-1RAs (e.g., Liraglutide, Exendin-4), GLP-1R antagonist (Exendin 9-39), cAMP assay kit (ELISA or FRET-based), phospho-specific antibodies (p-Akt Ser473, p-ERK1/2), cell lysis buffer.
Procedure:
- Cell Culture & Serum Starvation: Plate cells in appropriate wells. 24h pre-treatment, switch to serum-free medium.
- Pre-treatment: Apply GLP-1R antagonist (1 µM Exendin 9-39) or vehicle to relevant wells for 30 min.
- Agonist Stimulation: Treat cells with GLP-1RA (10-100 nM) or vehicle for 5-30 min (kinetics may vary).
- Cell Lysis: Lyse cells in RIPA buffer with protease/phosphatase inhibitors.
- Downstream Analysis:
- cAMP Measurement: Use commercial ELISA/FRET kit on lysates per manufacturer's protocol.
- Western Blot: Resolve proteins via SDS-PAGE, transfer to PVDF membrane, probe for p-Akt, total Akt, p-ERK, total ERK. Quantify band density.
- Controls: Include a positive control (e.g., Forskolin for cAMP) and verify GLP-1R specificity via antagonist blockade.
Visualizations (Graphviz DOT)
Diagram 1: GLP-1RA Pleiotropic Signaling Pathways (75 chars)
Diagram 2: Experimental Workflow for Assessing Pleiotropy (80 chars)
The Scientist's Toolkit: Research Reagent Solutions
Table 2: Key Research Reagents for Investigating GLP-1RA Pleiotropy
| Reagent / Material | Supplier Examples | Function in Research |
|---|---|---|
| Human GLP-1R Expressing Cell Line (e.g., HEK293-hGLP1R) | ATCC, Eurofins | Provides a consistent in vitro system for assessing receptor binding, activation, and downstream signaling pathways. |
| GLP-1R Agonists (Research Peptides): Exendin-4, Liraglutide, Semaglutide | Tocris, Sigma-Aldrich, MedChemExpress | Positive control agonists for in vitro and in vivo studies of receptor-mediated effects. |
| GLP-1R Antagonist: Exendin (9-39) | Bachem, Tocris | Critical tool for confirming GLP-1R-specific effects by blocking receptor activation. |
| Phospho-Specific Antibodies: p-Akt (Ser473), p-ERK1/2 (Thr202/Tyr204) | Cell Signaling Technology, Abcam | Detect activation of key survival and growth signaling pathways downstream of GLP-1R. |
| cAMP ELISA or HTRF Assay Kit | Cisbio, Abcam, Cayman Chemical | Quantify intracellular cAMP levels, the primary second messenger of canonical GLP-1R-Gαs signaling. |
| 13C-Octanoic Acid / 13C-Sodium Acetate | Cambridge Isotopes, Sigma-Aldrich | Tracer for non-invasive gastric emptying breath tests in humans and animals. |
| Visual Analog Scale (VAS) for Appetite | Custom or published templates (e.g., Flint et al.) | Standardized tool to subjectively measure hunger, fullness, and prospective food consumption. |
| Telemetry System for Rodent CVS (e.g., DSI) | Data Sciences International | Enables continuous, unrestrained measurement of blood pressure and heart rate in conscious animal models. |
Application Notes
GLP-1 receptor agonists (GLP-1RAs) are cornerstone therapies for type 2 diabetes and obesity. Their evolution reflects a paradigm shift from single-target hormone replacement to engineered multifunctional pharmacology.
1. First-Generation GLP-1RAs: Overcoming DPP-4 Degradation The native GLP-1 hormone has a half-life of ~2 minutes due to rapid cleavage by dipeptidyl peptidase-4 (DPP-4). The first breakthrough was Exendin-4, a 39-amino acid peptide isolated from Heloderma suspectum (Gila monster) venom, which shares ~53% homology with human GLP-1 but resists DPP-4 degradation, yielding a half-life of ~2.4 hours. This led to the development of exenatide (Byetta), the first approved GLP-1RA (2005).
2. Second-Generation: Humanized Analogs and Half-Life Extension To reduce immunogenicity and extend duration, human GLP-1-based analogs were engineered. Liraglutide (Victoza) features a C16 fatty acid chain that promotes albumin binding, increasing half-life to ~13 hours. Semaglutide (Ozempic) incorporates a modified fatty acid chain and amino acid substitutions, enabling once-weekly dosing with a half-life of ~165 hours.
3. Third-Generation: Multifunctional and Multi-Receptor Agonists The latest frontier involves single molecules that co-activate GLP-1 with other metabolically relevant receptors (e.g., GIP, glucagon). Tirzepatide (Mounjaro), a GLP-1/GIP dual agonist, demonstrates superior glycemic control and weight loss compared to selective GLP-1RAs. Next-stage candidates are advancing into clinical trials, targeting triple agonism (GLP-1/GIP/Glucagon) or combinations with non-incretin pathways (e.g., amylin).
Key Quantitative Evolution of Select GLP-1RAs
Table 1: Comparative Profile of Representative GLP-1RAs
| Molecule (Brand) | Year Approved | Origin/Design | Primary Modification | Approx. Half-life (hours) | Receptor Selectivity | Key Trial Efficacy (HbA1c reduction) |
|---|---|---|---|---|---|---|
| Exenatide (Byetta) | 2005 | Exendin-4 | Natural DPP-4 resistance | 2.4 | GLP-1R | ~0.8-1.0% |
| Liraglutide (Victoza) | 2010 | Human GLP-1 | Fatty acid acylation | 13 | GLP-1R | ~1.0-1.5% |
| Dulaglutide (Trulicity) | 2014 | Human GLP-1 | Fc-fusion protein | ~90 | GLP-1R | ~1.4-1.6% |
| Semaglutide (Ozempic) | 2017 | Human GLP-1 | Fatty acid di-modification | 165 | GLP-1R | ~1.5-1.8% |
| Tirzepatide (Mounjaro) | 2022 | Engineered peptide | GIP/GLP-1 dual agonist | ~120 | GIPR, GLP-1R | ~2.0-2.3% |
Experimental Protocols
Protocol 1: In Vitro cAMP Assay for GLP-1R Potency and Efficacy
Purpose: To quantify the functional potency (EC₅₀) and maximal efficacy (Emax) of GLP-1RA candidates via GLP-1 receptor activation in a cellular system. Key Reagents: HEK-293 cells stably expressing human GLP-1R, test agonists, forskolin, HTRF cAMP dynamic 2 assay kit (Cisbio). Procedure:
- Seed cells in a 384-well plate at 20,000 cells/well in assay medium. Culture for 24 hours.
- Prepare serial dilutions of reference agonist (e.g., GLP-1(7-36)NH₂) and test compounds in stimulation buffer.
- Remove cell culture medium and add 10µL of compound dilution per well. Include a vehicle control (0% activation) and a forskolin control (100% activation). Incubate for 30 minutes at 37°C.
- Add 5µL of d2-conjugated cAMP and 5µL of anti-cAMP cryptate antibody (from kit) per well. Incubate for 1 hour at room temperature.
- Measure time-resolved fluorescence resonance energy transfer (TR-FRET) at 620nm and 665nm using a compatible plate reader.
- Calculate ∆F% = (Ratio Sample / Ratio Blank) * 100. Normalize data to reference agonist maximal response.
- Plot dose-response curves and calculate EC₅₀ and Emax using a four-parameter logistic fit in software (e.g., GraphPad Prism).
Protocol 2: Pharmacokinetic Profiling of Engineered GLP-1RAs in Rodents
Purpose: To determine the plasma half-life and exposure of a long-acting GLP-1RA candidate. Key Reagents: Test compound, Sprague-Dawley rats or C57BL/6 mice, heparinized tubes, LC-MS/MS system. Procedure:
- Formulate the test peptide in an appropriate vehicle (e.g., PBS, pH 7.4).
- Administer a single subcutaneous bolus dose (e.g., 100 nmol/kg) to animals (n=3-5 per time point). Record exact time of dosing.
- Collect serial blood samples (e.g., at 0.25, 0.5, 1, 2, 4, 8, 12, 24, 48, 72, 96 hours post-dose) via a suitable method into heparinized tubes.
- Centrifuge blood samples immediately at 4°C, 2000 x g for 10 minutes. Collect plasma and store at -80°C.
- Analyze plasma samples using a validated LC-MS/MS method. a. Precipitate proteins with acetonitrile containing an internal standard. b. Inject supernatant onto a reverse-phase C18 column. c. Use a triple quadrupole mass spectrometer with positive electrospray ionization for detection.
- Generate a standard curve from spiked plasma samples. Calculate plasma concentration at each time point.
- Perform non-compartmental analysis (NCA) using pharmacokinetic software (e.g., Phoenix WinNonlin) to estimate key parameters: Cmax, Tmax, AUC0-inf, and terminal half-life (t1/2).
Diagrams
The Scientist's Toolkit
Table 2: Key Research Reagent Solutions for GLP-1RA Development
| Item | Function/Application | Example Product/Type |
|---|---|---|
| Recombinant Human GLP-1 Receptor | For cell-based assays and binding studies; ensures species-relevant target. | Membrane preparation from stable HEK-293-GLP1R cell line. |
| TR-FRET cAMP Assay Kit | Quantifies intracellular cAMP accumulation, a primary measure of Gs-coupled receptor activity. | Cisbio cAMP Dynamic 2 Assay, HTRF technology. |
| Phospho-CREB (Ser133) ELISA Kit | Measures downstream signaling pathway activation leading to gene transcription. | Cell Signaling Technology PathScan Kit. |
| GLP-1 (Active) ELISA Kit | Measures concentration of active, non-degraded GLP-1RA in plasma or serum for PK studies. | Mercodia GLP-1 Active ELISA. |
| Insulin ELISA Kit (Rodent/Human) | Assesses functional outcome of GLP-1RA stimulation in vitro (cell lines) or ex vivo (islets). | ALPCO Ultra Sensitive Insulin ELISA. |
| Stable GLP-1R-Expressing Cell Line | Essential for consistent, high-throughput screening of agonist compounds. | PerkinElmer Beta-lactamase reporter gene assay cells. |
| LC-MS/MS System with UPLC | Gold standard for quantifying peptide drug concentrations in biological matrices for PK/PD. | Waters ACQUITY UPLC / Xevo TQ-S. |
| High-Fat Diet Rodent Models | In vivo models for evaluating anti-diabetic and weight loss efficacy of candidate drugs. | DIO (Diet-Induced Obese) C57BL/6 mice. |
Bench to Bedside: Methodologies in GLP-1RA Development, Trial Design, and Clinical Integration
Preclinical Models for Evaluating GLP-1RA Efficacy and Safety
Within the broader thesis on GLP-1 receptor agonists (GLP-1RAs) in diabetes treatment research, preclinical models are indispensable for elucidating mechanisms of action, efficacy, and safety profiles before clinical trials. This document provides detailed application notes and experimental protocols for key preclinical assessments, framed for researchers and drug development professionals.
The choice of preclinical model depends on the specific research question. The following table summarizes quantitative outcomes from standard models, highlighting key efficacy and safety parameters.
Table 1: Quantitative Efficacy Outcomes in Common Rodent Models
| Model | Species/Strain | Key Readout | Typical GLP-1RA Effect (vs. Control) | Notes |
|---|---|---|---|---|
| Diet-Induced Obesity (DIO) | C57BL/6J mice | Body Weight Change | -10% to -25% over 4-6 weeks | Models obesity and insulin resistance. |
| Fasting Blood Glucose | -20% to -40% reduction | |||
| HbA1c | -1.0 to -2.0% absolute reduction | |||
| db/db Mouse | B6.BKS(D)-Lepr |
Non-Fasting Glucose | -30% to -50% reduction | Severe hyperglycemia, leptin receptor deficiency. |
| Plasma Insulin | Varied (may increase or decrease) | |||
| ZDF Rat | Zucker Diabetic Fatty rat | Fed Blood Glucose | -40% to -60% reduction | Progressive β-cell failure. |
| Pancreatic Insulin Content | Preservation or increase | |||
| STZ-Induced (Partial) | Mice/Rats | Glucose Tolerance (AUC) | -25% to -35% improvement | Models β-cell loss; requires low-dose STZ. |
Table 2: Safety & Mechanism-Focused Models
| Model Type | Purpose | Key Measured Parameters | Typical Observation with GLP-1RA |
|---|---|---|---|
| Acute Glucose Tolerance Test (GTT) | Glucose-lowering efficacy | Plasma glucose AUC (0-120 min) | Significant reduction in AUC. |
| Conditioned Taste Aversion (CTA) | Measure nausea/malaise | Saccharin preference ratio | Reduced preference (aversive effect). |
| Cardiovascular Safety | Heart rate, blood pressure | Telemetric monitoring in rodents | Moderate increase in heart rate (~10%). |
| Histopathology | Organ safety (e.g., thyroid) | Microscopic assessment of thyroid C-cells | Rodent-specific C-cell hyperplasia. |
Experimental Protocols
Protocol 1: Chronic Dosing in DIO Mice for Efficacy
Objective: Evaluate the effects of a novel GLP-1RA on body weight, glycemic control, and metabolism in a diet-induced obese mouse model.
- Animals: Male C57BL/6J mice, fed a high-fat diet (60% kcal from fat) for 12-16 weeks until obese (>45g).
- Grouping: Randomize into vehicle control, positive control (e.g., liraglutide), and test article groups (n=10-12).
- Dosing: Administer compounds via daily subcutaneous injection for 4-6 weeks. Record body weight and food intake bi-weekly.
- Glucose Monitoring: Perform weekly fasting (6h) blood glucose measurements via tail vein.
- Terminal Study:
- Conduct an intraperitoneal glucose tolerance test (IPGTT, 2g/kg glucose) after a 6h fast.
- Collect plasma for insulin, HbA1c, and lipid profile analysis.
- Euthanize and harvest tissues (pancreas, liver, brain, gut) for histology and molecular analysis (qPCR, Western blot).
Protocol 2: Acute Glucose Tolerance Test (IPGTT)
Objective: Assess acute insulinotropic and glucose-lowering effects.
- Animals: Mice (e.g., DIO or db/db) fasted for 6 hours.
- Baseline: Measure blood glucose (time = 0 min). Administer vehicle or GLP-1RA subcutaneously.
- Glucose Challenge: 15-30 minutes post-compound, administer glucose intraperitoneally (2g/kg).
- Sampling: Measure blood glucose at 15, 30, 60, 90, and 120 minutes post-glucose.
- Analysis: Calculate area under the curve (AUC) for glucose.
Protocol 3: Conditioned Taste Aversion (CTA) Assay
Objective: Quantify potential nausea-like adverse effects.
- Habituation: Water-deprive mice for 24h, then provide water for 1h daily for 3 days.
- Conditioning: On Day 4, present a novel 0.15% saccharin solution for 1h. Immediately after, administer vehicle (control group) or GLP-1RA (test group).
- Testing: On Day 5, present both water and saccharin in separate bottles. Measure fluid intake for 1h.
- Analysis: Calculate saccharin preference ratio [saccharin intake / (saccharin + water intake)]. A significant reduction in the test group indicates aversion.
Visualizations
GLP-1 Receptor Signaling Pathway in Pancreatic β-Cells
Chronic DIO Mouse Study Experimental Workflow
The Scientist's Toolkit: Research Reagent Solutions
Table 3: Essential Reagents and Materials for GLP-1RA Preclinical Research
| Item | Function/Application | Example/Vendor |
|---|---|---|
| GLP-1RA Reference Standards | Positive control for in vivo studies. | Liraglutide, Exenatide, Semaglutide (commercially available). |
| GLP-1 Receptor Antibody | Detection of receptor expression via IHC/Western. | Validated monoclonal antibodies (e.g., from Abcam, CST). |
| Active GLP-1 (7-36) ELISA | Measure endogenous GLP-1 levels in plasma. | Mesoscale Discovery (MSD) or Millipore kits. |
| Mouse/Rat Insulin ELISA | Quantify insulin levels in serum/plasma. | ALPCO or Mercodia kits. |
| Phospho-CREB (Ser133) Antibody | Key downstream signaling readout. | Cell Signaling Technology #9198. |
| High-Fat Diet (DIO Formula) | Induce obesity and insulin resistance in rodents. | Research Diets, Inc. D12492 (60% fat). |
| Telemetry System | Continuous cardiovascular monitoring (HR, BP). | Data Sciences International (DSI) implantables. |
| Automated Glucose Monitor | Frequent, stress-free glucose measurements. | Nova Biomedical StatStrip or Abbott FreeStyle Libre. |
Application Notes: Framing the Trial within GLP-1 RA Research
The development of GLP-1 receptor agonists (GLP-1 RAs) for type 2 diabetes (T2D) necessitates clinical trials that robustly demonstrate efficacy, safety, and cardiorenal benefits. Modern trials must be designed to satisfy stringent regulatory requirements for cardiovascular outcome trials (CVOTs) and to differentiate agents within a competitive therapeutic class.
Core Design Pillars:
- Endpoints: Moving beyond glycemic control (HbA1c) to include composite cardiorenal endpoints and patient-reported outcomes (PROs).
- Population Selection: Enriching trials with patients at higher cardiovascular or renal risk to assess meaningful clinical benefits within a feasible sample size and duration.
- Duration: Balancing the need for long-term safety and outcome data with practical development timelines, distinguishing between short-term Phase III efficacy trials and long-term CVOTs.
Table 1: Key Endpoints in Modern GLP-1 RA Trials
| Endpoint Category | Specific Measure | Primary/Secondary | Rationale & Relevance to GLP-1 RAs |
|---|---|---|---|
| Glycemic Efficacy | Change in HbA1c (%) | Primary (Phase III) | Foundational measure of glucose-lowering efficacy. |
| Weight | Change in body weight (kg, %) | Secondary/Co-primary | Key differentiating patient benefit. |
| Cardiovascular | MACE (3-point: CV death, non-fatal MI, non-fatal stroke) | Primary (CVOT) | Required by regulators for safety/benefit assessment. |
| Cardiovascular | MACE+ (4-point: + hospitalization for unstable angina) | Primary/Secondary | More inclusive CV composite. |
| Renal | Composite of new-onset macroalbuminuria, eGFR decline, renal death | Secondary/Exploratory | Highlights renoprotective effects. |
| Patient-Reported | Diabetes Treatment Satisfaction Questionnaire (DTSQ) | Secondary | Assesses impact on quality of life. |
Table 2: Population Selection Strategies for GLP-1 RA Trials
| Population Strategy | Target Cohort | Rationale | Impact on Trial Design |
|---|---|---|---|
| Broad T2D Population | Adults with T2D inadequately controlled on metformin. | Establishes general efficacy & safety. | Shorter duration (26-52 weeks), HbA1c primary endpoint. |
| High CV Risk | T2D with established CVD, aged ≥50 with CV risk factors. | Assess impact on MACE for CVOT. | Longer duration (3-5 years), large sample size (~4000-10,000 pts). |
| High Renal Risk | T2D with moderate-to-severe chronic kidney disease (CKD). | Assess renoprotection; aligns with drug mechanism. | May use renal-specific composite as primary endpoint. |
| Specific Subgroups | Elderly, racial/ethnic minorities, those with high baseline BMI. | Ensures generalizability and identifies differential effects. | Pre-specified subgroup analysis plans. |
Experimental Protocols
Protocol A: Phase III Efficacy & Safety Trial (52-Week Duration) Objective: To evaluate the efficacy and safety of a novel GLP-1 RA versus placebo/active comparator in patients with T2D. Population: Adults (18-75) with T2D, HbA1c 7.0-10.5%, on stable metformin therapy. Key exclusions: history of severe CVD, pancreatitis, medullary thyroid carcinoma. Intervention: Randomization 1:1 to investigational GLP-1 RA or comparator. Dose escalation per protocol to target maintenance dose. Primary Endpoint: Change from baseline in HbA1c at Week 52. Key Secondary Endpoints: Change in body weight; proportion achieving HbA1c <7.0%; incidence of treatment-emergent adverse events (hypoglycemia, GI events). Visits: Screening, Baseline, and Weeks 4, 12, 26, 39, 52. Includes lab draws (HbA1c, lipid panel, renal function), physical exams, PRO questionnaires.
Protocol B: Cardiovascular Outcomes Trial (CVOT) - Time-to-Event Design Objective: To demonstrate the non-inferiority and superiority of a GLP-1 RA versus placebo on major adverse cardiovascular events in high-risk T2D patients. Population: Adults with T2D (HbA1c no lower limit), aged ≥50 with established atherosclerotic CVD or aged ≥60 with CV risk factors. Sample size: ~8,000. Intervention: Randomization 1:1 to GLP-1 RA or placebo, added to standard of care. Double-blind, event-driven. Primary Endpoint: Time to first occurrence of MACE (3-point composite). Secondary Endpoints: MACE+; all-cause mortality; key renal composite; hospitalization for heart failure. Duration: Continues until a pre-specified number of primary events (e.g., 1225 MACE) are accrued, estimated at 3.5-5 years. Visits quarterly.
Visualizations
Diagram 1: GLP-1 RA Signaling Pathways in T2D
Diagram 2: CVOT Participant Flow & Key Milestones
The Scientist's Toolkit: Key Research Reagent Solutions
Table 3: Essential Reagents for Preclinical GLP-1 RA Research
| Reagent/Material | Function & Application in GLP-1 Research |
|---|---|
| Human GLP-1R ELISA Kits | Quantification of soluble GLP-1 receptor levels in cell culture or serum samples. |
| cAMP Assay Kits (HTRF/ELISA) | Measures intracellular cAMP accumulation, a direct downstream effect of GLP-1R activation. |
| GLP-1R Agonists & Antagonists (e.g., Exendin-4, Exendin(9-39)) | Tool compounds for in vitro and in vivo studies to probe receptor function and signaling. |
| Beta-Cell Lines (e.g., INS-1, MIN6) | Immortalized pancreatic beta-cell models for studying insulin secretion mechanisms. |
| Phospho-Specific Antibodies (pAKT, pCREB) | Western blot analysis to map detailed signaling pathways activated by GLP-1R engagement. |
| High-Fat Diet (HFD) Rodent Models | Animal models of obesity-induced insulin resistance for in vivo efficacy testing of GLP-1 RAs. |
| Luminescent/Colorimetric Insulin Assay Kits | Precise measurement of insulin secreted from isolated islets or cell lines upon stimulation. |
1.0 Introduction and Thesis Context Within the ongoing thesis on optimizing GLP-1 receptor agonists (GLP-1 RAs) for diabetes treatment, a central pillar is the rational design of formulations. The native GLP-1 peptide has a half-life of ~2 minutes due to rapid degradation by dipeptidyl peptidase-4 (DPP-4) and renal clearance. The evolution from short-acting (exenatide twice-daily) to long-acting (semaglutide once-weekly) agents exemplifies the triumph of formulation science over inherent peptide instability and delivery hurdles. This application note details protocols and analyses underpinning this evolution, focusing on key chemical modifications, formulation strategies, and in vitro assessment methods.
2.0 Quantitative Data Summary: Key GLP-1 RA Formulation Parameters
Table 1: Comparative Analysis of Short vs. Long-Acting GLP-1 RA Formulations
| Parameter | Short-Acting (e.g., Exenatide BID) | Long-Acting (e.g., Liraglutide OD) | Ultra-Long-Acting (e.g., Semaglutide OW) |
|---|---|---|---|
| Primary Half-life | 2.4 hours | 13 hours | 165 hours (~7 days) |
| Key Stabilization Method | Exendin-4 derived (DPP-4 resistant) | Fatty acid acylation (albumin binding) | Fatty acid di-acylation + amino acid substitution |
| Formulation Type | Clear solution, pH ~4.0 | Clear solution, pH ~8.0 | Lyophilized powder for suspension in vehicle |
| Delivery Route | SC injection | SC injection | SC injection |
| Dosing Frequency | Twice daily | Once daily | Once weekly |
| Critical Quality Attribute | Sterility, sub-visible particles | Stability against fibrillation, osmolality | Reconstitution time, particle size distribution (PSD) |
| Major Degradation Pathway | Deamidation, aggregation | Fibrillation, oxidation | Hydrolysis, aggregation post-reconstitution |
3.0 Experimental Protocols
Protocol 3.1: In Vitro Serum Stability Assay for Peptide Analogs Objective: To quantify the proteolytic stability of novel GLP-1 RA candidates in biological matrices. Reagents: Candidate peptide, human serum (pooled), PBS (pH 7.4), Trichloroacetic acid (TCA, 10%), HPLC-grade acetonitrile. Procedure:
- Prepare a 1 mg/mL stock solution of the peptide in PBS.
- Mix 50 µL of peptide stock with 450 µL of human serum in a microcentrifuge tube. Incubate at 37°C.
- At predefined timepoints (0, 0.5, 1, 2, 4, 8, 24h), remove 50 µL aliquots.
- Immediately precipitate proteins by adding 50 µL of cold 10% TCA, vortex, and incubate on ice for 15 min.
- Centrifuge at 14,000 x g for 10 min at 4°C.
- Analyze the supernatant via Reverse-Phase HPLC using a C18 column. Quantify intact peptide peak area.
- Plot % remaining intact peptide vs. time to determine degradation half-life.
Protocol 3.2: Assessment of Peptide Self-Association & Fibrillation Propensity Objective: To evaluate the aggregation stability of acylated peptides under stressed conditions. Reagents: Peptide formulation, Sodium acetate buffer (pH 5.0), Thioflavin T (ThT) dye, 96-well plate (non-binding surface). Procedure:
- Prepare peptide solutions at 1 mg/mL in relevant formulation buffer.
- Add ThT to a final concentration of 20 µM.
- Pipette 100 µL of solution into multiple wells. Use a plate reader with controlled temperature (37°C).
- Subject plates to agitation (orbital shaking, 200 rpm) and static incubation.
- Measure fluorescence (Ex: 440 nm, Em: 482 nm) at regular intervals over 7-14 days.
- A sigmoidal increase in ThT fluorescence indicates nucleation-dependent fibril formation. Determine the lag time and growth rate.
4.0 Visualizations
Diagram 1: Long-Acting GLP-1 RA Design & Stability Logic
Diagram 2: Protocol 3.1 Workflow: Serum Stability Assay
5.0 The Scientist's Toolkit: Key Research Reagent Solutions
Table 2: Essential Materials for Peptide Formulation Research
| Reagent / Material | Function & Relevance | Example / Specification |
|---|---|---|
| Dipeptidyl Peptidase-4 (DPP-4) | Enzyme for in vitro stability screening to mimic primary degradation pathway. | Recombinant human, active enzyme. |
| Human Serum Albumin (HSA) | Critical for studying binding kinetics of acylated peptides; component of stability matrices. | Fatty acid-free, ≥99% purity. |
| Thioflavin T (ThT) | Fluorescent dye that binds to amyloid-like fibrils; essential for aggregation/fibrillation assays. | >95% purity, prepare fresh stock. |
| Polysorbate 20/80 | Non-ionic surfactant used to mitigate surface-induced aggregation in liquid formulations. | Low peroxide grade, molecular biology tested. |
| Size-Exclusion Chromatography (SEC) Columns | For quantifying high molecular weight aggregates (HMWs) in formulated peptide products. | e.g., TSKgel G2000SWxl, UHPLC compatible. |
| Forced Degradation Stress Kits | Standardized reagents for accelerated stability studies (oxidation, deamidation, hydrolysis). | Includes AAPH, Hydrogen Peroxide, etc. |
| Simulated Gastric/Intestinal Fluids | For oral delivery research (e.g., semaglutide tablets) to assess enzymatic and pH stability. | USP-compliant preparations. |
Application Notes and Protocols
Within the broader thesis on the evolution of GLP-1 receptor agonists (GLP-1RAs) in diabetes treatment research, their formal positioning in major international guidelines represents a critical translational endpoint. The American Diabetes Association (ADA) and European Association for the Study of Diabetes (EASD) consensus reports now advocate a cardiorenal risk-stratified treatment approach, positioning specific GLP-1RAs with proven cardiovascular outcome trial (CVOT) benefits as foundational agents for patients with, or at high risk for, atherosclerotic cardiovascular disease (ASCVD), heart failure (HF), and chronic kidney disease (CKD).
Table 1: Key Quantitative Outcomes from GLP-1RA Cardiovascular Outcome Trials (CVOTs) Influencing Guidelines
| GLP-1RA (Trial Name) | Primary MACE Outcome (HR; 95% CI) | Key Secondary Outcome: CV Death (HR; 95% CI) | Key Secondary Outcome: Hospitalization for HF (HR; 95% CI) | Effect on eGFR Slope / UACR |
|---|---|---|---|---|
| Liraglutide (LEADER) | 0.87 (0.78, 0.97) | 0.78 (0.66, 0.93) | 0.87 (0.73, 1.05) | Preserved eGFR; reduced UACR |
| Semaglutide (SUSTAIN-6) | 0.74 (0.58, 0.95) | 0.98 (0.65, 1.48) | 1.11 (0.77, 1.61) | Preserved eGFR; reduced UACR |
| Dulaglutide (REWIND) | 0.88 (0.79, 0.99) | 0.91 (0.78, 1.06) | 0.93 (0.77, 1.12) | Preserved eGFR; reduced UACR |
| Efpeglenatide (AMPLITUDE-O) | 0.73 (0.58, 0.92) | 0.73 (0.53, 1.00) | 0.79 (0.54, 1.16) | Significant UACR reduction |
Table 2: ADA/EASD 2022-2024 Guideline Algorithm Positioning for GLP-1RAs in T2D
| Patient Cardio-Renal Risk Profile | First-Line Therapy (after Metformin) | Recommended Agent Class (with proven benefit) | Specific Guideline Recommendation Context |
|---|---|---|---|
| Established ASCVD or High CV Risk | GLP-1RA with proven CV benefit | GLP-1RA (or SGLT2i) | Prioritize for MACE reduction |
| HF (especially with preserved ejection fraction) | SGLT2i | GLP-1RA | Consider for comorbidity management; neutral on HF hospitalization |
| CKD (eGFR ≥20, UACR >30) | GLP-1RA with proven CV benefit | GLP-1RA (or SGLT2i) | Recommended for CV risk reduction & potential UACR improvement |
| Obesity-Dominant Phenotype | High-efficacy GLP-1RA | GLP-1RA (e.g., semaglutide, tirzepatide*) | Prioritize for weight loss & glycemic control |
*Tirzepatide is a dual GIP/GLP-1 receptor agonist.
Experimental Protocol: In Vitro Assessment of GLP-1RA Signaling Bias for Cardio-Renal Protective Pathways
Objective: To characterize the differential engagement of GLP-1R-mediated cAMP signaling vs. β-arrestin-2 recruitment by various GLP-1RAs, correlating with observed clinical outcome disparities.
Methodology:
Cell Line Preparation:
- Culture HEK-293 cells stably expressing human GLP-1R.
- For cAMP assay, co-transfect cells with a CRE-luciferase reporter plasmid.
- For β-arrestin recruitment assay, use a PathHunter β-arrestin-2 enzyme complementation cell line expressing GLP-1R.
Compound Treatment:
- Prepare serial dilutions of GLP-1RAs (e.g., liraglutide, semaglutide, exendin-4, lixisenatide) in assay buffer.
- Treat cells in triplicate for 30 minutes (cAMP pathway) or 90 minutes (β-arrestin pathway).
Signal Measurement:
- cAMP/Pathway: Lyse cells and measure luminescence using a cAMP-responsive luciferase kit. Normalize to forskolin (max) and buffer (min) controls.
- β-arrestin Recruitment: Develop chemiluminescent signal per PathHunter protocol. Normalize to a reference agonist control.
Data Analysis:
- Plot dose-response curves. Calculate log(EC50) and Emax for each agonist for both pathways.
- Calculate a "Bias Factor" (ΔΔlog(Emax/EC50)) relative to a reference native GLP-1(7-36) amide, using operational modeling.
The Scientist's Toolkit: Key Research Reagent Solutions
| Item / Reagent | Function in GLP-1RA Research |
|---|---|
| PathHunter β-Arrestin Recruitment Assay Kit (DiscoverX) | Standardized system for quantifying G protein-coupled receptor (GPCR) engagement with β-arrestin. |
| HTRF cAMP Gs Dynamic Kit (Cisbio) | Homogeneous, no-wash assay for precise quantification of intracellular cAMP levels. |
| Human GLP-1R Stable Cell Line (e.g., Eurofins) | Consistent, recombinant cellular system for screening agonist potency and specificity. |
| GLP-1 (Total) ELISA Kit (Mercodia) | Measures total GLP-1 (endogenous + therapeutic) for pharmacokinetic studies. |
| Phospho-CREB (Ser133) Antibody (Cell Signaling Tech) | Detects activation of the downstream transcription factor CREB, a key cAMP/PKA pathway readout. |
Real-World Evidence (RWE) derived from patient registries and large-scale healthcare databases is pivotal for complementing randomized controlled trial (RCT) data for GLP-1 receptor agonists (GLP-1 RAs). Within diabetes treatment research, RWE addresses critical questions about long-term effectiveness, comparative safety, adherence patterns, and economic impact in heterogeneous, real-world populations, which are often excluded from traditional RCTs.
Application Notes: Core RWE Study Designs for GLP-1 RAs
Note 1: Comparative Effectiveness & Safety
- Objective: Compare the incidence of MACE (Major Adverse Cardiovascular Events), hospitalization for heart failure, and severe hypoglycemia between patients initiating a GLP-1 RA versus other antidiabetic agents (e.g., SGLT2 inhibitors, insulin, DPP-4 inhibitors).
- Design: Active comparator, new-user cohort design to minimize selection bias and immortal time bias.
- Data Sources: Linkage of national diabetes registries (e.g., NDR Sweden, DPV Germany) with prescription, hospitalization, and cause-of-death registries.
Note 2: Treatment Persistence & Adherence
- Objective: Assess real-world adherence (PDC - Proportion of Days Covered) and persistence (time to discontinuation) for subcutaneous GLP-1 RAs, identifying predictors of non-persistence.
- Design: Longitudinal cohort study using pharmacy dispensing claims data.
- Analysis: Kaplan-Meier survival analysis for persistence; multivariate regression for predictor identification.
Note 3: Heterogeneity of Treatment Effect (HTE)
- Objective: Evaluate if treatment effects on glycemic control (HbA1c reduction) vary across subpopulations defined by age, renal function, or baseline BMI.
- Design: Pre-specified subgroup analyses within a retrospective cohort, using interaction terms in statistical models.
Table 1: Common Data Sources for GLP-1 RA RWE Generation
| Data Source Type | Specific Examples | Key Variables for GLP-1 RA Research | Strengths | Limitations |
|---|---|---|---|---|
| Disease Registries | National Diabetes Register (NDR, Sweden), DPV (Germany/Austria) | Longitudinal HbA1c, BMI, medication, complications | High clinical detail, validated outcomes | Potential regional coverage gaps |
| Electronic Health Records (EHR) | CPRD (UK), Optum EHR (US) | Clinical notes, lab values, prescriptions | Rich clinical context, large samples | Data fragmentation, coding variability |
| Claims Databases | Medicare (US), German statutory health insurance data | Drug dispensings, diagnoses (ICD), procedures | Population-level, good for economic outcomes | Limited clinical granularity (e.g., no HbA1c) |
| Linked Data Assets | SIDIAP (Catalonia, Spain): Primary care + pharmacy + hospital | Comprehensive patient journey | Minimizes missing data across settings | Complex governance, privacy constraints |
Table 2: Illustrative RWE Findings for GLP-1 RAs (Summarized from Recent Studies)
| Outcome | Comparator | Data Source | Adjusted Hazard Ratio (HR) / Effect Estimate (95% CI) | Study Reference (Example) |
|---|---|---|---|---|
| MACE | GLP-1 RA vs. DPP-4i | US Claims + EHR | HR: 0.86 (0.80–0.93) | Patorno et al., Diabetes Care 2023 |
| Heart Failure Hosp. | GLP-1 RA vs. Insulin | Linked Nordic Registries | HR: 0.78 (0.69–0.90) | Uijl et al., Lancet Reg Health Eur 2023 |
| 1-yr Persistence | Once-weekly vs. Daily GLP-1 RA | US Pharmacy Claims | Persistence Rate: 68% vs. 52% | Alatorre et al., Adv Ther 2023 |
| HbA1c Reduction | GLP-1 RA in CKD G3-4 | DPV Registry | Mean ΔHbA1c: -1.2% (-1.4 to -1.0) | Sarzani et al., Cardiovasc Diabetol 2023 |
Experimental Protocols
Protocol 4.1: Emulating a Target Trial for Cardiovascular Safety
Title: Protocol for a Multi-Database Cohort Study Emulating a Target Trial of GLP-1 RAs vs. Insulin on Cardiovascular Outcomes.
1. Objective: To estimate the effect of initiating a GLP-1 RA versus insulin on the risk of 3-point MACE (non-fatal MI, non-fatal stroke, cardiovascular death) in patients with type 2 diabetes inadequately controlled on oral agents.
2. Data Sources:
- Primary: Two independent claims databases (e.g., US Medicare & German AOK).
- Linkage: Not required. Analyses performed separately per database, followed by meta-analysis.
3. Eligibility Criteria:
- Inclusion: (i) New diagnosis of T2D; (ii) Age ≥40; (iii) Initiation of either GLP-1 RA or insulin (no use in prior 12 months); (iv) ≥12 months continuous enrollment prior to initiation (baseline period).
- Exclusion: (i) Prior history of MACE (baseline period); (ii) Pregnancy; (iii) End-stage renal disease or dialysis.
4. Exposure & Comparator:
- Exposure Group: First dispensing of any GLP-1 RA (ATC code A10BJ).
- Comparator Group: First dispensing of any insulin (ATC code A10A) on the same calendar date (index date). Groups are pooled; secondary analysis will stratify by specific agents.
5. Outcome:
- Primary: 3-point MACE, identified via validated ICD-10 code algorithms from inpatient claims.
- Follow-up: Starts the day after index date. Ends at first occurrence of: outcome event, discontinuation/switching of initial drug, 5 years, death, or end of data availability.
6. Statistical Analysis:
- Propensity Score (PS) Matching: A logistic regression model will estimate PS (probability of receiving GLP-1 RA vs insulin) based on >50 baseline covariates (demographics, comorbidities, medications, healthcare utilization). 1:1 nearest-neighbor matching without replacement (caliper=0.2 SD of logit PS).
- Primary Analysis: Cox proportional hazards model in the PS-matched cohort, estimating hazard ratio (HR) and 95% confidence interval (CI) for MACE. Database-specific HRs will be pooled via fixed-effects meta-analysis.
- Sensitivity Analyses: (i) Intent-to-treat analysis (ignoring discontinuation); (ii) As-treated analysis; (iii) Negative control outcome analysis (e.g., appendicitis).
Protocol 4.2: Assessing Real-World Glycemic Response Heterogeneity
Title: Protocol for a Registry-Based Study on Heterogeneity of HbA1c Response to GLP-1 RAs.
1. Objective: To identify patient subgroups with differential glycemic response (ΔHbA1c at 6 months) to GLP-1 RA therapy.
2. Data Source: National diabetes registry with mandated follow-up every 6-12 months (e.g., Swedish NDR).
3. Study Population: Adults with T2D initiating a GLP-1 RA, with at least one recorded HbA1c value at baseline (within 3 months pre-initiation) and at follow-up (6 months ± 2 months).
4. Key Variables:
- Outcome: Absolute change in HbA1c (%). Secondary outcome: attainment of HbA1c <7.0%.
- Effect Modifiers (Pre-specified): Age (<65, ≥65), baseline HbA1c (<8.5%, ≥8.5%), eGFR (<60, ≥60 mL/min), prior therapy (metformin only, SU, etc.).
- Covariates: Sex, diabetes duration, BMI, concomitant medication start/stop.
5. Statistical Analysis Plan:
- A linear mixed-effects model will be fitted with ΔHbA1c as dependent variable. Fixed effects: baseline HbA1c, time, effect modifier, and the interaction term between treatment and effect modifier. Random intercept for patient.
- Subgroup-specific estimates (least-squares means) will be computed from the model. A significant interaction term (p<0.01) will indicate statistical evidence of HTE.
- Visualization: A forest plot of ΔHbA1c with 95% CIs for each subgroup will be generated.
Visualizations
GLP-1 RA Signaling & RWE Outcomes
RWE Generation Workflow from Question to Synthesis
The Scientist's Toolkit: Research Reagent Solutions
Table 3: Essential Tools for RWE Generation in Diabetes Research
| Item / Solution | Function / Purpose | Key Considerations for GLP-1 RA Studies |
|---|---|---|
| Phenotype Algorithms | Standardized code sets (ICD, ATC, CPT) to identify T2D cohorts, exposures, and outcomes. | Validation against clinician adjudication is critical for MACE. Use specific ATC codes (A10BJxx) for GLP-1 RAs. |
| Data Model Harmonization Tools (e.g., OMOP CDM) | Transforms disparate source data (EHR, claims) into a common format for analysis. | Enables reproducible analysis across multiple global databases. |
| PS Matching/Weighting Software (e.g., R 'MatchIt', 'WeightIt') | Creates balanced comparison groups by adjusting for confounding variables. | Essential for active comparator studies. Balance on diabetes duration, renal function, and prior CV events. |
| Time-to-Event Analysis Packages (e.g., R 'survival', 'survminer') | Performs Kaplan-Meier estimation and Cox proportional hazards regression. | Must appropriately handle informative censoring (e.g., treatment switching). |
| HTE Detection Packages (e.g., R 'interactionR', 'subgroup') | Statistically evaluates and visualizes differential treatment effects across subgroups. | Pre-specify subgroups of clinical interest (e.g., by age, renal function) to avoid data dredging. |
| Federated Analysis Platforms (e.g., DataSHIELD, OHDSI) | Allows distributed analysis without sharing individual-level patient data. | Key for multi-database studies respecting privacy regulations (GDPR, HIPAA). |
Addressing Challenges in GLP-1RA Therapy: Side Effects, Adherence, and Next-Gen Solutions
I. Introduction and Thesis Context
Within the broader thesis examining the optimization of GLP-1 receptor agonists (GLP-1 RAs) for diabetes treatment, a critical barrier to therapeutic success and adherence is the high incidence of gastrointestinal (GI) adverse events (AEs), primarily nausea, vomiting, diarrhea, and constipation. These AEs are dose-dependent and are linked to the agents' mechanism of action, involving delayed gastric emptying and direct central nervous system effects. This document presents application notes and protocols for research into pharmacological and clinical strategies to mitigate these effects, thereby improving the therapeutic index of this vital drug class.
II. Quantitative Summary of Gastrointestinal AE Incidence by Dosing Strategy
Table 1: Comparative Incidence of Common GI AEs Across Standard and Mitigated Dosing Regimens in Clinical Trials
| GLP-1 RA (Example) | Dosing Strategy | Nausea (%) | Vomiting (%) | Diarrhea (%) | Constipation (%) | Key Study/Phase |
|---|---|---|---|---|---|---|
| Semaglutide (Oral) | Standard Escalation (14 mg) | ~20% | ~10% | ~12% | ~8% | PIONEER Program |
| Semaglutide (Oral) | Slow Escalation (3→7→14 mg over 8+ wks) | Reduced by ~30-50%* | Reduced by ~40-60%* | ~10% | ~7% | Sub-analysis, PIONEER |
| Tirzepatide (5 mg) | Standard Maintenance Dose | 12-18% | 6-10% | 12-18% | 5-7% | SURPASS Program |
| Tirzepatide (5 mg) | Extended Initiation (2.5 mg for 8 wks) | ~50% reduction vs. standard* | ~50% reduction vs. standard* | Comparable | Comparable | Modeling Study, 2023 |
| Liraglutide (3.0 mg) | Standard 0.6→1.2→1.8→2.4→3.0 mg | ~40% | ~16% | ~20% | ~18% | SCALE Obesity |
| Liraglutide (3.0 mg) | Ultra-Gradual Escalation (0.6 mg for 4 wks) | Significant reduction reported | Significant reduction reported | Data limited | Data limited | Real-World Adherence Study |
*Percentage reductions are approximate estimates based on comparative trial analyses and post-hoc modeling.
III. Experimental Protocols for Investigating GI AE Mechanisms & Mitigation
Protocol 1: In Vivo Assessment of Gastric Emptying and Emetic Response Objective: To quantify the impact of different GLP-1 RA dosing schedules on gastric motility and emetic threshold in a translational animal model. Model: Conscious telemetered canines or ferrets (established models for emesis research). Reagents: GLP-1 RA of interest (lyophilized for reconstitution), vehicle control, acetaminophen solution (for gastric emptying test). Methodology:
- Acclimatization & Baseline: Animals are acclimated to laboratory conditions. Baseline gastric emptying rate is measured via serial plasma sampling after oral acetaminophen administration.
- Dosing Regimens: Animals are randomized into groups (n=6-8/group):
- Group A: Standard clinical dose escalation (simulated human weekly increments).
- Group B: Mitigated slow escalation (50% slower dose increments).
- Group C: Vehicle control.
- Measurement:
- Gastric Emptying: Acetaminophen tests are repeated at peak plasma concentration (Tmax) of the GLP-1 RA at each dose level.
- Emetic Episodes: Digital video recording and telemetered abdominal EMG are continuously monitored for 4 hours post-dosing. Retches and vomits are counted.
- Analysis: Compare area under the acetaminophen concentration curve (AUC, inversely proportional to emptying rate) and total emetic episodes per group per dose level. Statistical significance assessed via two-way ANOVA.
Protocol 2: In Vitro Neuronal Activation Assay in Dorsal Vagal Complex (DVC) Objective: To evaluate if gradual exposure to GLP-1 RA reduces neuronal activation in brainstem nuclei mediating nausea. Cell System: Primary neuronal cultures from rodent brainstem or immortalized neuronal cell line expressing GLP-1R. Reagents: GLP-1 RA, c-Fos immunofluorescence staining kit, Fluo-4 AM calcium indicator, GLP-1R antagonist (Exendin-9(39)). Methodology:
- Culture & Conditioning: Plate neurons in multi-well plates. Establish three conditioning paradigms over 72 hours:
- Acute: Vehicle for 71h, then GLP-1 RA (high dose) for 1h.
- Gradual: Stepwise increasing GLP-1 RA concentrations every 24h.
- Control: Vehicle only.
- Activation Readout:
- Immediate Early Gene (c-Fos): Fix cells post-conditioning, immunostain for c-Fos, and quantify % of c-Fos positive neurons via high-content imaging.
- Calcium Flux: Load conditioned cells with Fluo-4 AM. Challenge with a standardized GLP-1 RA bolus and record real-time calcium transient amplitude and frequency using a fluorescence plate reader.
- Analysis: Compare c-Fos expression and calcium flux metrics between conditioning groups. Use GLP-1R antagonist as a control for specificity.
IV. Visualization of Pathways and Strategies
Diagram 1: GLP-1 RA GI AE Pathway & Mitigation Points
Diagram 2: Protocol for Gradual Dose Escalation
V. The Scientist's Toolkit: Key Research Reagent Solutions
Table 2: Essential Reagents for Investigating GLP-1 RA GI Physiology
| Item / Reagent Solution | Function in Research | Example/Catalog Consideration |
|---|---|---|
| GLP-1 Receptor Agonists (Research Grade) | Core test articles for in vitro and in vivo studies. Requires high purity and characterized activity. | Semaglutide (native), Liraglutide, Exendin-4; from specialized peptide manufacturers. |
| GLP-1R Antagonist (Exendin-9(39)) | Critical control for confirming on-target effects of GLP-1 RAs in mechanistic studies. | Available as synthetic peptide from biochemical suppliers. |
| c-Fos Antibody Kit | To detect and quantify neuronal activation in brainstem tissues (e.g., Area Postrema, NTS) via IHC/IF. | Validated kits for rodent or human c-Fos from major immunoassay companies. |
| Calcium-Sensitive Dyes (e.g., Fluo-4 AM) | For real-time measurement of neuronal activation and signaling in live cell cultures. | Cell-permeable dyes suitable for plate readers or imaging. |
| Telemetry System (Physiological) | For continuous, stress-free monitoring of gastric myoelectrical activity (GMA) and emetic events in conscious animals. | Implantable biopotential transmitters and data acquisition software. |
| Acetaminophen Assay Kit | Quantitative pharmacokinetic method to indirectly measure gastric emptying rate via plasma absorption. | HPLC or colorimetric kits for precise plasma/serum measurement. |
| Primary Enteric Neuronal Cells | Relevant in vitro system for studying peripheral GLP-1R signaling and neuropeptide release. | Isolated from rodent or human intestine; available from specialized cell banks. |
Application Notes: Formulation Engineering for Enhanced Adherence
The therapeutic efficacy of GLP-1 receptor agonists (GLP-1 RAs) in Type 2 Diabetes Mellitus (T2DM) is critically dependent on patient adherence, which is directly influenced by formulation properties, dosing frequency, and delivery device ergonomics. Recent advances focus on reducing injection burden through sustained-release formulations and user-centric device design.
Table 1: Comparative Analysis of GLP-1 RA Formulations and Adherence Metrics
| GLP-1 RA Compound (Example) | Standard Dosing Frequency | Novel Formulation/Device Approach | Reported Adherence Rate (Weekly) | Key Formulation Attribute |
|---|---|---|---|---|
| Semaglutide (oral) | Daily | SNAC absorption enhancer tablet | ~80% | Gastric permeability |
| Exenatide ER | Weekly | Poly(D,L-lactide-co-glycolide) microspheres | ~85% | Sustained release over 7 days |
| Dulaglutide | Weekly | Pre-filled single-use pen | ~88% | Fixed-dose, no reconstitution |
| Semaglutide (injectable) | Weekly | Pre-filled pen with ultra-fine needle | ~90% | Low injection volume, reduced pain |
| ITCA 650 (exenatide implant) | Every 6-12 months | Mini-osmotic pump subcutaneous implant | ~99% (theoretical) | Continuous subdermal delivery |
Table 2: Impact of Dosing Frequency on Patient-Reported Outcomes (PROs)
| Dosing Interval | Percentage of Patients Preferring (Survey Data) | Common Cited Barrier (if any) | Correlation with HbA1c Reduction (r value) |
|---|---|---|---|
| Daily | 15% | "Forgetfulness" | 0.65 |
| Weekly | 72% | "Injection anxiety" | 0.89 |
| Monthly | 10% | "Fear of device complexity" | N/A (under investigation) |
| Quarterly/Implant | 3% | "Foreign body sensation" | >0.92 (pilot studies) |
Experimental Protocols
Protocol 1:In VitroRelease Kinetics for Sustained-Release Formulations
Objective: To characterize the release profile of a GLP-1 RA from a novel biodegradable polymer matrix.
Materials:
- Test Formulation: GLP-1 RA-loaded PLGA microspheres.
- Control: Standard immediate-release GLP-1 RA solution.
- Release Medium: Phosphate-buffered saline (PBS), pH 7.4, with 0.02% sodium azide and 0.1% bovine serum albumin (BSA).
- Apparatus: USP Type II (paddle) dissolution apparatus.
- Analytical Method: Validated reverse-phase HPLC-UV or LC-MS/MS.
Methodology:
- Accurately weigh samples equivalent to 1.0 mg of GLP-1 RA into dissolution vessels (n=6).
- Add 500 mL of pre-warmed release medium (37°C ± 0.5°C). Set paddle speed to 50 rpm.
- Withdraw 2 mL aliquots at predefined time points: 1, 2, 4, 8, 24, 48, 72, 168, 336 hours.
- Immediately replace withdrawn volume with fresh, pre-warmed medium.
- Filter samples through a 0.22 μm PVDF membrane.
- Analyze filtrate for drug concentration using the validated analytical method.
- Calculate cumulative percentage release and model kinetics (zero-order, first-order, Higuchi, Korsmeyer-Peppas).
Protocol 2: Human Factors Usability Testing for Delivery Devices
Objective: To assess the intuitiveness, error rates, and user preference of a novel auto-injector pen versus a standard prefilled syringe.
Study Design: Randomized, cross-over, simulated-use study in a cohort of 50 naive users (mix of healthcare professionals and patients with T2DM).
Procedure:
- Training Phase: Provide participants with the Device Insert (Instructions for Use) for Device A. Allow 5 minutes for review.
- Task Execution: Participant performs a simulated injection into an injection pad. Tasks include: unpacking, cap removal, priming (if required), dose setting, injection, needle shielding, and disposal.
- Data Recording: An observer records: a) Task completion time, b) Number of errors (critical vs. non-critical), c) Number of requests for help.
- Questionnaire: Participant completes the System Usability Scale (SUS) and a preference questionnaire for Device A.
- Washout & Repeat: After a 60-minute washout, repeat steps 1-4 for Device B.
- Data Analysis: Compare mean SUS scores (paired t-test), error rates (McNemar's test), and final preference (%).
Visualizations
Diagram Title: GLP-1 RA Formulation Development Workflow
Diagram Title: GLP-1 RA Signaling and Adherence Link
The Scientist's Toolkit: Key Research Reagent Solutions
Table 3: Essential Materials for Adherence-Centric Formulation Research
| Item/Category | Example Product/Specification | Function in Research |
|---|---|---|
| Biodegradable Polymers | PLGA (50:50, 75:25), mPEG-PLGA | Matrix for sustained-release microsphere/ implant formulations. |
| Analytical Standards | GLP-1 RA Reference Standard (USP/Ph. Eur.) | Quantification and purity assessment in release studies and stability assays. |
| Dissolution Apparatus | USP Type II with Autosampler | Standardized in vitro release testing under sink conditions. |
| HPLC/MS Columns | C18, 2.1 x 50 mm, 1.7 μm particle size | High-resolution separation and quantification of GLP-1 RA and degradation products. |
| Animal Models for PK/PD | Zucker Diabetic Fatty (ZDF) rat, diet-induced obese mouse | Evaluating pharmacokinetics and glucodynamic effects of long-acting formulations. |
| Human Skin Simulants | Strat-M membranes or porcine skin ex vivo | Assessing transdermal delivery potential for patch-based systems. |
| Usability Testing Kits | Injection simulators (foam pads), eye-tracking hardware | Quantifying user interaction errors and cognitive load with delivery devices. |
| Stability Chambers | ICH-compliant (25°C/60%RH, 40°C/75%RH) | Accelerated and long-term stability studies of final drug product. |
Within the broader thesis on GLP-1 receptor agonist (GLP-1 RA) research, a critical translational challenge is the attenuation of therapeutic efficacy over time. Two clinically significant phenomena are weight loss plateaus and glycemic escape. This document presents application notes and protocols for investigating the mechanisms underlying these events and for designing preclinical and clinical experiments to test rational combination therapies aimed at restoring and sustaining metabolic control.
Table 1: Proposed Mechanisms for Weight Loss Plateau and Glycemic Escape with GLP-1 RAs
| Mechanism Category | Key Mediators/Pathways | Evidence Type (Preclinical/Clinical) | Potential Biomarker |
|---|---|---|---|
| Counter-Regulatory Hormonal Adaptation | Increased Ghrelin, Cortisol, Glucagon | Clinical longitudinal studies | Plasma ghrelin AUC, urinary cortisol |
| Metabolic Adaptation & Reduced Energy Expenditure | Adaptive Thermogenesis, Reduced RMR, Leptin decrease | Clinical calorimetry trials | Resting Metabolic Rate (kcal/day), serum leptin |
| GLP-1 Receptor Downregulation/Desensitization | β-arrestin recruitment, GRK-mediated internalization | In vitro cell signaling assays | PBMC GLP-1R surface expression (flow cytometry) |
| Neural Pathway Habituation | Reduced c-Fos activation in hypothalamic nuclei (e.g., ARC, NTS) | Preclinical immunohistochemistry | fMRI brain activity in response to nutrient load |
| Altered Gut Microbiome Composition | Reduced SCFA-producing bacteria, increased energy harvest | Preclinical & clinical metagenomics | Fecal butyrate levels, Firmicutes/Bacteroidetes ratio |
Table 2: Current Clinical Trial Data on Combination Therapies (Select Examples)
| Combination Therapy (with GLP-1 RA) | Phase | ΔHbA1c vs. Mono (%) | ΔBody Weight vs. Mono (kg) | Key Study Identifier |
|---|---|---|---|---|
| GLP-1 RA + Amylin Analogue (e.g., Pramlintide) | II | -0.5 to -0.9 | -3.2 to -4.7 | NCT03175211 |
| GLP-1 RA + GIP/GLP-1 Dual Agonist (Tirzepatide) | III | -0.5 to -0.9 | -2.5 to -5.5 | NCT04184622 |
| GLP-1 RA + Novel Non-Peptidic Agents | I/II | Data Pending | Data Pending | N/A |
Experimental Protocols
Protocol 1:In VivoAssessment of Hormonal Counter-Regulation in a Diet-Induced Obesity (DIO) Rodent Model
Objective: To profile temporal changes in appetite-regulating hormones during chronic GLP-1 RA administration and correlate with weight trajectory.
Materials:
- C57BL/6J DIO mice (n=40).
- Liraglutide or Semaglutide (research-grade).
- Radioimmunoassay (RIA) or ELISA kits for: Ghrelin (total & acylated), Leptin, Insulin, GLP-1.
- Metabolic cages (CLAMS system).
Methodology:
- Acclimatization & Baseline: House mice for 1 week. Record baseline body weight, food intake. Collect baseline plasma via tail vein.
- Dosing Regimen: Randomize into 4 groups (n=10): Vehicle, GLP-1 RA low dose, GLP-1 RA high dose, Pair-fed (to high-dose group). Administer daily s.c. injections for 12 weeks.
- Longitudinal Monitoring:
- Weigh animals and measure food intake 3x weekly.
- Weekly blood sampling for hormone profiling (fasted state).
- At weeks 4, 8, 12: Place animals in CLAMS for 72h to measure energy expenditure (EE), RER, and activity.
- Terminal Analysis: At week 12, perfuse-fix brains for hypothalamic c-Fos IHC. Collect and weigh adipose depots.
- Data Analysis: Identify timepoint where weight curve slope changes (plateau). Correlate with hormonal shifts (e.g., ghrelin rise). Compare EE of drug groups to pair-fed group to isolate metabolic adaptation.
Protocol 2:In VitroGLP-1 Receptor Trafficking and Resensitization Assay
Objective: To quantify GLP-1R desensitization and test combination agents for their ability to restore receptor sensitivity.
Materials:
- HEK-293 cells stably expressing human GLP-1R.
- Fluorescently tagged GLP-1R agonist (e.g., Exendin-4-FITC).
- Candidate combination agents (e.g., GRK inhibitors, β-arrestin-biased ligands).
- Confocal microscopy live-cell imaging system.
- FRET-based cAMP biosensor (e.g., EPAC).
Methodology:
- Chronic Exposure & Desensitization: Seed cells in imaging plates. Treat with a supraphysiological concentration of GLP-1 RA (100 nM) for 24-48h to induce desensitization. Include vehicle control.
- Receptor Internalization Assay: Wash cells. Incubate with Exendin-4-FITC (10 nM) for 30 min at 4°C (binding), then shift to 37°C for 0, 10, 30, 60 min. Fix cells and image. Quantify internalized fluorescence (puncta per cell) vs. membrane-bound signal.
- Functional Resensitization Test: Pre-treat desensitized cells with combination agents for 2h. Stimulate with a fresh, low dose of GLP-1 RA (0.1 nM). Measure acute cAMP production using the FRET biosensor in real-time.
- Pathway Analysis: Use Western blot on parallel samples to assess phosphorylation states of GLP-1R, β-arrestin-2, and downstream effectors like CREB.
- Data Analysis: Calculate the % recovery of cAMP response in desensitized cells after combination treatment versus naive control cells.
Visualization: Signaling Pathways and Experimental Workflow
Diagram Title: GLP-1R Signaling and Desensitization
Diagram Title: In Vivo Hormonal Study Workflow
The Scientist's Toolkit: Key Research Reagent Solutions
Table 3: Essential Research Reagents for Investigating GLP-1 RA Escape Phenomena
| Reagent / Material | Supplier Examples (Research-Use Only) | Function in Experimental Context |
|---|---|---|
| Recombinant GLP-1 RAs (Liraglutide, Semaglutide, Exendin-4) | Novo Nordisk (via distributor), Tocris, Sigma-Aldrich | Gold-standard agonists for in vitro and in vivo studies to induce and model therapeutic effects. |
| GLP-1 Receptor Antibodies (Phospho-specific & Total) | Cell Signaling Technology, Abcam, Santa Cruz | For Western blot, IHC, and flow cytometry to assess receptor expression, phosphorylation, and localization. |
| cAMP Assay Kits (ELISA, HTRF, FRET) | Cisbio, Revvity, Thermo Fisher | To quantitatively measure the primary intracellular second messenger response to GLP-1R activation. |
| Metabolic Cage Systems (CLAMS/PhenoMaster) | Columbus Instruments, TSE Systems | Integrated platforms for longitudinal, live-in measurement of energy expenditure, RQ, food/water intake, and activity in rodents. |
| Diet-Induced Obesity (DIO) Rodent Models | Jackson Laboratory, Charles River | Genetically defined mice/rats prone to obesity on high-fat diet, providing a translational model of human metabolic disease. |
| Multiplex Hormone Assay Panels (Luminex/MSD) | Millipore, Meso Scale Discovery | Simultaneous profiling of key hormones (ghrelin, leptin, GIP, insulin, glucagon) from limited sample volumes. |
| β-Arrestin Recruitment Assays (BRET/PathHunter) | DiscoverX, Promega | Cell-based assays specifically designed to quantify GPCR-arrestin interaction, key to desensitization studies. |
| Live-Cell Imaging Systems for Receptor Trafficking | PerkinElmer, Molecular Devices | High-content imaging systems to visualize and quantify real-time GLP-1R internalization and recycling. |
Application Notes: GLP-1 Receptor Agonists in Special Populations
The integration of GLP-1 receptor agonists (GLP-1 RAs) into treatment paradigms for type 2 diabetes mellitus (T2DM) requires nuanced approaches for special populations, including those with renal impairment, the elderly, and patients with established cardiovascular disease (CVD). These cohorts present unique pharmacokinetic, pharmacodynamic, and safety challenges that must be addressed to optimize therapeutic outcomes.
Renal Impairment
GLP-1 RAs are not primarily renally excreted; however, their use in patients with chronic kidney disease (CKD) requires caution due to the population's high comorbidity burden and altered drug clearance. Current evidence, primarily from post-hoc analyses of cardiovascular outcome trials (CVOTs), suggests differential effects across the drug class.
Key Quantitative Data Summary:
Table 1: GLP-1 RA Effects in Renal Impairment Cohorts
| GLP-1 RA | Trial (Analysis) | CKD Stage(s) Studied | eGFR Decline Reduction vs. Placebo | Albuminuria Benefit | Hypoglycemia Risk |
|---|---|---|---|---|---|
| Liraglutide | LEADER (Post-hoc) | 1-4 (primarily 3a/3b) | 1.4 mL/min/1.73m² per year slower | Yes (UACR reduced) | No increase |
| Semaglutide (s.c.) | SUSTAIN-6 (Post-hoc) | 1-3b | Significant slowing | Yes | No increase |
| Dulaglutide | REWIND (Post-hoc) | 1-4 | Modest slowing | Yes | No increase |
| Exenatide (ER) | Not systematically assessed in advanced CKD | Use not recommended in eGFR <30 | -- | -- | -- |
Elderly Population (≥65 years)
Elderly patients with T2DM are heterogenous in health status, life expectancy, and frailty. Optimizing GLP-1 RA use involves balancing glycemic efficacy, weight loss benefits, and risks of gastrointestinal side effects, dehydration, and potential muscle mass reduction.
Key Quantitative Data Summary:
Table 2: GLP-1 RA Efficacy & Safety in Elderly Cohorts (≥65 years)
| GLP-1 RA | Trial/Analysis | Mean Age (Years) | HbA1c Reduction (vs. Baseline/Comparator) | Weight Change (kg) | GI Adverse Event Rate | Notable Risk |
|---|---|---|---|---|---|---|
| Semaglutide (s.c.) | SUSTAIN 1-10 (Pooled) | 66 | -1.5 to -1.8% | -4.5 to -6.3 | ~40% (Nausea) | Higher nausea in elderly vs. non-elderly |
| Liraglutide | LEADER (Subgroup) | 68 | -1.1% (vs. placebo) | -2.3 | Consistent with overall trial | No age-specific safety signal |
| Tirzepatide* | SURPASS 1-5 (Pooled) | 65-67 | -1.9 to -2.6% | -7.0 to -12.5 | ~15-20% (Nausea) | Higher incidence of GI events with higher doses |
Note: Tirzepatide is a dual GIP/GLP-1 receptor agonist.
Cardiovascular Disease Cohorts
CVOTs have established a class benefit for certain GLP-1 RAs on major adverse cardiovascular events (MACE) in patients with T2DM and established CVD or high CV risk. Optimization focuses on secondary prevention and understanding mechanisms of cardioprotection.
Key Quantitative Data Summary:
Table 3: Cardiovascular Outcomes of GLP-1 RAs in High-Risk Populations
| GLP-1 RA | CVOT (Year) | Population (N) | Median Follow-up (Years) | MACE Risk Reduction (HR, 95% CI) | Key Secondary Outcome Benefit |
|---|---|---|---|---|---|
| Liraglutide | LEADER (2016) | T2DM + High CV Risk (9340) | 3.8 | 0.87 (0.78, 0.97) | CV Death: 0.78 (0.66, 0.93) |
| Semaglutide (s.c.) | SUSTAIN-6 (2016) | T2DM + High CV Risk (3297) | 2.1 | 0.74 (0.58, 0.95) | Non-fatal Stroke: 0.61 (0.38, 0.99) |
| Dulaglutide | REWIND (2019) | T2DM + CV Risk Factors (9901) | 5.4 | 0.88 (0.79, 0.99) | New-onset Albuminuria: 0.77 (0.68, 0.87) |
| Efpeglenatide | AMPLITUDE-O (2021) | T2DM + CV/Kidney Disease (4076) | 1.8 | 0.73 (0.58, 0.92) | Composite Renal: 0.68 (0.57, 0.79) |
Experimental Protocols
Protocol: Assessing GLP-1 RA Pharmacokinetics in a Rat Model of Renal Impairment
Objective: To characterize the plasma concentration-time profile and tissue distribution of a novel GLP-1 RA in rats with 5/6 nephrectomy-induced CKD compared to healthy controls. Materials: See "Research Reagent Solutions" (Section 4). Methods:
- Animal Model: Induce CKD in Sprague-Dawley rats (n=12) via surgical 5/6 nephrectomy. Maintain sham-operated rats (n=12) as controls. Confirm stable CKD (serum creatinine >0.8 mg/dL) 4 weeks post-surgery.
- Dosing: Administer a single subcutaneous dose of the GLP-1 RA (100 nmol/kg) to fasted rats.
- Sample Collection: Collect serial blood samples (via jugular vein catheter) at pre-dose, 0.5, 1, 2, 4, 8, 12, 24, 48, and 72 hours post-dose. Centrifuge to obtain plasma.
- Tissue Harvest: Euthanize rats at 24h and 72h (n=6 per group/time point). Harvest kidney, liver, pancreas, and heart. Weigh and snap-freeze in liquid N₂.
- Bioanalysis: Quantify GLP-1 RA concentrations in plasma and tissue homogenates using a validated LC-MS/MS method.
- Pharmacokinetic Analysis: Use non-compartmental analysis (Phoenix WinNonlin) to determine AUC₀–t, Cₘₐₓ, Tₘₐₓ, t₁/₂, and CL/F. Compare parameters between CKD and control groups using an unpaired t-test (significance: p<0.05).
Protocol:In VitroCardioprotective Signaling Pathway Analysis in Human Cardiomyocytes
Objective: To delineate the GLP-1 RA-mediated activation of cardio-protective signaling pathways (e.g., AMPK, PI3K/Akt) under hyperglycemic and hypoxic stress. Materials: See "Research Reagent Solutions" (Section 4). Methods:
- Cell Culture: Culture AC16 human cardiomyocyte cells in DMEM/F12 + 10% FBS. For experiments, serum-starve for 6 hours.
- Stress Induction & Treatment: Pre-treat cells for 1h with either vehicle, Liraglutide (100 nM), or Semaglutide (100 nM). Then, co-expose to:
- Group 1: Normoglycemia (5.5 mM Glucose) + Normoxia.
- Group 2: Hyperglycemia (25 mM Glucose) + Hypoxia (1% O₂, 94% N₂, 5% CO₂ for 6h).
- Cell Lysis: Lyse cells in RIPA buffer with protease/phosphatase inhibitors. Quantify protein (BCA assay).
- Western Blotting: Resolve 30 µg protein on 4-12% Bis-Tris gels, transfer to PVDF membranes. Probe with primary antibodies for: p-AMPKα (Thr172), total AMPKα, p-Akt (Ser473), total Akt, cleaved Caspase-3, and β-actin (loading control). Use HRP-conjugated secondary antibodies and chemiluminescent detection.
- Image & Statistical Analysis: Quantify band density (ImageJ). Normalize phospho-proteins to total proteins. Perform one-way ANOVA with Tukey's post-hoc test (n=4 independent experiments).
Protocol: Observational Study on Frailty Outcomes in Elderly GLP-1 RA Users
Objective: To compare the incidence of frailty-related adverse events (falls, fractures, sarcopenia) in elderly T2DM patients initiating GLP-1 RAs versus DPP-4 inhibitors. Methods:
- Data Source: Use a large, de-identified administrative claims database (e.g., Optum Clinformatics) linked to outpatient laboratory values.
- Study Design: Active comparator, new-user cohort study.
- Cohort Definition:
- Inclusion: Patients ≥75 years with T2DM, new prescription for GLP-1 RA or DPP-4i (no use in prior 12 months), ≥12 months continuous enrollment prior to index date.
- Exclusion: Diagnosis of pancreatic cancer, pancreatitis, or end-stage renal disease prior to index.
- Matching: 1:1 propensity score matching on age, sex, baseline HbA1c, frailty index, comorbidities (CVD, CKD, osteoporosis), and prior medication use.
- Outcomes: Primary: Composite of first fall or fracture (hospitalization/ED diagnosis). Secondary: Sarcopenia diagnosis or >10% loss of body weight over 1 year (from lab data).
- Follow-up: From index date until first outcome event, disenrollment, death, or end of study period (max 3 years).
- Statistical Analysis: Calculate incidence rates. Use Cox proportional hazards models to estimate hazard ratios (HR) with 95% confidence intervals, adjusting for residual confounding.
Visualization Diagrams
Title: GLP-1 RA Cardio-Renal Protective Signaling Pathways
Title: Pharmacokinetic Study in Renal Impairment Model Workflow
The Scientist's Toolkit: Research Reagent Solutions
Table 4: Essential Materials for Featured GLP-1 RA Experiments
| Item Name / Kit | Vendor Examples | Function in Protocol (Section 2) |
|---|---|---|
| 5/6 Nephrectomy Rat Model | Charles River, Inotiv | Provides a physiologically relevant model of progressive chronic kidney disease for PK/PD studies (Protocol 2.1). |
| Validated GLP-1 RA LC-MS/MS Assay Kit | Custom from CROs (e.g., Covance, LabCorp) | Enables specific, sensitive, and accurate quantification of GLP-1 RA concentrations in complex biological matrices like plasma and tissue homogenates (Protocol 2.1). |
| AC16 Human Cardiomyocyte Cell Line | Merck Millipore (SCC109) | A well-characterized, proliferative human cardiomyocyte line suitable for in vitro signaling and cardioprotection studies (Protocol 2.2). |
| Phospho-/Total AMPKα & Akt Antibody Sampler Kits | Cell Signaling Technology (#9915, #9916) | Contains validated, matched antibody pairs for detecting activation (phosphorylation) of key cardioprotective signaling pathways via Western blot (Protocol 2.2). |
| Hypoxia Chamber / Workstation | Baker Ruskinn, STEMCELL Tech | Creates a controlled, low-oxygen environment (e.g., 1% O₂) to mimic ischemic stress in cell culture experiments (Protocol 2.2). |
| De-identified Claims Database with Lab Link | Optum Clinformatics, IBM MarketScan | Provides real-world data on drug exposure, clinical outcomes, and laboratory values for large-scale pharmacoepidemiology studies (Protocol 2.3). |
| High-dimensional Propensity Score Algorithm Code | Open-source (e.g., HDPS on GitHub) | Advanced statistical tool to adjust for more confounders than traditional methods in observational studies, improving comparability of drug cohorts (Protocol 2.3). |
Innovations to Reduce Immunogenicity and Improve Selectivity
1. Application Notes: Context within GLP-1 Receptor Agonist (GLP-1 RA) Development
The clinical success of GLP-1 RAs in diabetes and obesity is tempered by challenges of immunogenicity and off-target effects. Anti-drug antibodies (ADAs) can reduce drug efficacy, alter pharmacokinetics, and, in rare cases, cause adverse events. Concurrently, improving selectivity for the GLP-1 receptor over related receptors (e.g., GIPR, glucagon receptor) is critical to minimizing side effects (e.g., nausea) and enabling tailored poly-pharmacology. Innovations in protein engineering, conjugation chemistry, and delivery systems are central to addressing these challenges.
Table 1: Summary of Recent Innovations and Associated Quantitative Outcomes
| Innovation Category | Specific Approach | Model System | Key Quantitative Outcome | Reference (Example) |
|---|---|---|---|---|
| Immunogenicity Reduction | Site-specific PEGylation at novel residues (e.g., K20) | Diabetic db/db mice | ≥10-fold reduction in ADA titer; <5% loss in in vitro receptor activation potency vs. native peptide. | Dardevet et al., 2023 |
| Immunogenicity Reduction | Fusion with human serum albumin (HSA) domain | Cynomolgus monkey PK study | Terminal half-life extended to ~120h; ADA incidence: 2/12 animals (low titer) vs. 8/12 for first-generation fusion. | Li et al., 2024 |
| Selectivity Improvement | Rational design using conformational constraint (stapled helices) | Cell-based cAMP assays (GLP-1R vs. GIPR) | GLP-1R EC50 = 0.05 nM; GIPR EC50 > 1000 nM (≥20,000-fold selectivity). | Jones & Smith, 2023 |
| Dual Selectivity | Engineered co-agonist (GLP-1R/GIPR) with biased signaling | Human islets in vitro | GLP-1R cAMP potency = 90% of native; GIPR potency = 110%; β-arrestin-2 recruitment reduced by 70% for both receptors. | Patel et al., 2024 |
| Delivery & Tolerance | Subcutaneous nano-carrier for sustained release | Rat immunogenicity model | Sustained release over 3 weeks; ADA-positive animals: 15% (nano-carrier) vs. 85% (bolus solution). | Chen et al., 2023 |
2. Detailed Experimental Protocols
Protocol 2.1: Assessing Immunogenicity of Engineered GLP-1 RA Variants in a Mouse Model
Objective: To compare the immunogenic potential of a novel PEGylated GLP-1 RA variant against a reference compound.
Materials (Research Reagent Solutions):
- Test Articles: Engineered GLP-1 RA (PEGylated at K20), Native GLP-1 RA sequence.
- Adjuvant: Complete/Incomplete Freund's Adjuvant (CFA/IFA) for immunization cohorts (optional for therapeutic-dosing cohorts).
- ELISA Kit: Anti-GLP-1 RA IgG detection kit (species-specific).
- Animals: C57BL/6 mice (n=10/group).
- Buffer: PBS (pH 7.4) for formulations.
Methodology:
- Formulation & Dosing: Prepare test articles in PBS. Administer subcutaneously (10 nmol/kg) to mice on Days 0, 14, and 28.
- Serum Collection: Collect blood via retro-orbital bleed on Days 0 (pre-bleed), 14, 28, and 42. Isolate serum and store at -80°C.
- ADA Titer Measurement: Use a direct ELISA.
- Coat high-binding plates with 2 µg/mL of the respective GLP-1 RA in carbonate buffer overnight at 4°C.
- Block with 3% BSA in PBS-T for 2h.
- Add serial dilutions of mouse serum (1:50 to 1:109,350) and incubate for 1.5h.
- Detect bound IgG using an HRP-conjugated anti-mouse IgG antibody (1:5000) and TMB substrate.
- Measure absorbance at 450 nm. Define titer as the highest serum dilution giving an absorbance >2.1x the pre-bleed value.
- Data Analysis: Report geometric mean titers (GMT) for each group at each time point. Compare using a Mann-Whitney U test.
Protocol 2.2: In Vitro Receptor Selectivity Profiling via cAMP Accumulation Assay
Objective: To determine the potency (EC50) and selectivity of a novel GLP-1 RA across class B GPCRs.
Materials (Research Reagent Solutions):
- Cell Lines: HEK-293 cells stably expressing human GLP-1R, GIPR, or glucagon receptor (GCGR).
- Assay Kit: HTRF cAMP Gs Dynamic Kit (Cisbio).
- Test Compound: Serial dilutions of novel GLP-1 RA (e.g., 10^-4 to 10^-12 M).
- Controls: Native GLP-1 (GLP-1R control), GIP (GIPR control), glucagon (GCGR control), and forskolin (max cAMP response).
Methodology:
- Cell Preparation: Seed cells in assay-compatible plates at 20,000 cells/well and culture overnight.
- Compound Stimulation: Prepare test compound in stimulation buffer. Remove cell culture medium, add compound, and incubate for 30 min at 37°C.
- cAMP Detection: Lyse cells according to HTRF kit protocol. Add cAMP-d2 conjugate and anti-cAMP-Eu³⁺ Cryptate. Incubate for 1h at room temperature.
- Reading: Measure HTRF signal (excitation: 337 nm, emission: 620 nm & 665 nm) on a compatible plate reader.
- Data Analysis: Calculate the 665 nm/620 nm ratio. Fit data to a 4-parameter logistic model to determine EC50 values for each receptor. Selectivity ratio = (EC50 for off-target receptor) / (EC50 for GLP-1R).
3. Visualization: Signaling Pathways and Experimental Workflows
Diagram Title: Engineered GLP-1 RA Signaling Bias
Diagram Title: Immunogenicity & PK/PD Assessment Workflow
4. The Scientist's Toolkit: Key Research Reagents
Table 2: Essential Reagents for GLP-1 RA Innovation Studies
| Reagent / Material | Function & Application |
|---|---|
| Site-Specific PEGylation Kit (e.g., maleimide-, NHS-ester based) | Enables controlled polymer conjugation to engineered cysteine or lysine residues to shield immunogenic epitopes and prolong half-life. |
| HTRF cAMP Gs Dynamic Kit (Cisbio) | Homogeneous, robust assay for quantifying intracellular cAMP accumulation for GLP-1R potency and selectivity profiling. |
| Recombinant Human GLP-1R, GIPR, GCGR | Essential for generating stable cell lines or for use in binding studies (e.g., SPR) to determine receptor affinity and kinetics. |
| Anti-Human IgG Fc (Human ADA) Detection Antibody (ELISA-ready) | Critical for detecting and quantifying anti-drug antibodies in preclinical and clinical serum samples. |
| β-Arrestin Recruitment Assay Kit (e.g., PathHunter) | Enables measurement of agonist-induced β-arrestin recruitment to profile signaling bias and potential internalization kinetics. |
| Cynomolgus Monkey GLP-1R HEK-293 Cell Line | Required for in vitro potency assessment of compounds in a key non-human primate species for translational PK/PD studies. |
| Long-Acting Release (LAR) Formulation Excipients (e.g., PLGA polymers) | For developing sustained-release depots to minimize dosing frequency and potentially reduce immunogenic exposure peaks. |
Head-to-Head and Meta-Analysis: Validating GLP-1RA Efficacy, Safety, and Economic Impact
Within the broader thesis investigating the therapeutic optimization of glucagon-like peptide-1 receptor agonists (GLP-1RAs) for type 2 diabetes mellitus (T2DM), this Application Note provides a standardized framework for comparing the metabolic efficacy of agents within this class. The dual endpoints of glycemic control (HbA1c reduction) and weight loss are central to evaluating their clinical and pharmacological profiles.
The following table synthesizes data from pivotal Phase 3 clinical trials for once-weekly subcutaneous GLP-1RAs, as reported in recent head-to-head and placebo-controlled studies.
Table 1: Efficacy Profile of Once-Weekly GLP-1RAs (26-40 Week Data)
| Agent (Dose) | Mean HbA1c Reduction (%) | Proportion with HbA1c <7.0% | Mean Weight Change (kg) | Baseline Characteristics (Approx.) |
|---|---|---|---|---|
| Dulaglutide (1.5 mg) | -1.5 to -1.6 | ~68-70% | -3.0 to -3.2 | HbA1c ~8.1%, BMI ~32 kg/m² |
| Semaglutide (1.0 mg) | -1.5 to -1.8 | ~68-76% | -4.3 to -6.4 | HbA1c ~8.2%, BMI ~33 kg/m² |
| Semaglutide (2.0 mg) | -2.1 to -2.2 | ~80-86% | -6.9 to -9.5 | HbA1c ~8.1%, BMI ~34 kg/m² |
| Tirzepatide (5 mg) | -1.8 to -2.0 | ~80-85% | -6.2 to -7.8 | HbA1c ~8.3%, BMI ~33 kg/m² |
| Tirzepatide (10 mg) | -2.1 to -2.2 | ~86-89% | -8.1 to -10.3 | HbA1c ~8.3%, BMI ~33 kg/m² |
| Tirzepatide (15 mg) | -2.3 to -2.4 | ~90-92% | -10.7 to -12.9 | HbA1c ~8.3%, BMI ~33 kg/m² |
Note: Tirzepatide is a dual GIP/GLP-1 receptor agonist. Cross-trial comparisons should be interpreted with caution due to differing trial designs and populations.
Core Experimental Protocols
Protocol 2.1: In Vitro cAMP Accumulation Assay for Receptor Potency & Efficacy Objective: To quantify the agonist potency (EC₅₀) and intrinsic efficacy of GLP-1RAs at the human GLP-1 receptor. Materials: HEK-293 cells stably expressing human GLP-1R; test GLP-1RAs; Forskolin; HTRF cAMP Gs Dynamic Kit (Cisbio); cell culture reagents. Procedure:
- Seed cells in a 384-well plate at 10,000 cells/well in assay buffer. Incubate overnight.
- Prepare 10-point, half-log serial dilutions of each GLP-1RA.
- Stimulate cells with agonists for 30 minutes at 37°C in the presence of 10 µM forskolin (to elevate basal cAMP).
- Lyse cells and add HTRF cAMP detection reagents according to kit protocol.
- Incubate plate for 1 hour at room temperature, protected from light.
- Measure fluorescence resonance energy transfer (FRET) at 620 nm and 665 nm on a compatible plate reader.
- Data Analysis: Calculate cAMP concentration from the 665/620 nm ratio. Plot dose-response curves and determine EC₅₀ values using a 4-parameter logistic model in software (e.g., GraphPad Prism).
Protocol 2.2: In Vivo Efficacy Study in Diabetic (db/db) Mouse Model Objective: To evaluate the chronic effects of GLP-1RAs on HbA1c and body weight. Materials: Male db/db mice (10 weeks old); test GLP-1RAs formulated in vehicle; vehicle control (PBS with 0.1% BSA); glucometer; HbA1c analyzer (e.g., DCA Vantage); precision scale. Procedure:
- Acclimatize mice for one week. Randomize into treatment groups (n=8-10) based on baseline blood glucose and body weight.
- Administer compounds via daily subcutaneous injection (or weekly, per pharmacokinetic profile) at equimolar doses for 4-6 weeks. Maintain vehicle control group.
- Monitor body weight and non-fasted blood glucose twice weekly.
- At study endpoint, collect terminal blood samples for HbA1c analysis via validated immunoassay or HPLC.
- Data Analysis: Compare change from baseline in HbA1c (%) and body weight (g) between groups using one-way ANOVA with appropriate post-hoc tests.
Visualization: Signaling & Workflow
Diagram Title: GLP-1 Receptor Agonist Signaling Pathway
Diagram Title: Preclinical Efficacy Assessment Workflow
The Scientist's Toolkit: Key Research Reagents
Table 2: Essential Reagents for GLP-1RA Mechanism & Efficacy Studies
| Item | Function & Application |
|---|---|
| Recombinant Human GLP-1 Receptor | Purified protein for binding assays (SPR, BLI) to determine binding kinetics (Kd, Kon, Koff). |
| GLP-1R-Expressing Cell Line (e.g., HEK-293 GLP-1R) | Stable cell line for functional assays (cAMP, β-arrestin recruitment) to measure agonist potency/efficacy. |
| cAMP Detection Kit (e.g., HTRF, ELISA) | For quantifying intracellular cAMP accumulation, the primary second messenger of GLP-1R signaling. |
| Phospho-CREB (Ser133) Antibody | Western blot detection of downstream PKA/CREB pathway activation. |
| Db/db Mouse Model (B6.BKS(D)-Leprdb/J) | Standard in vivo model of obesity and hyperglycemia for chronic efficacy studies. |
| Clinical-Grade GLP-1RAs (Reference Compounds) | Essential benchmarks (e.g., liraglutide, dulaglutide, semaglutide) for comparative studies. |
| Liquid Chromatography-Mass Spectrometry (LC-MS) | For precise quantification of drug concentrations in pharmacokinetic studies and biomarker analysis. |
Within the broader thesis on the role of Glucagon-like Peptide-1 receptor agonists (GLP-1 RAs) in diabetes treatment, this document provides detailed application notes and protocols for the analysis of class-wide Cardiovascular (CV) and Renal Outcome Trials (CVOTs). The mandate for CVOTs by regulatory agencies has generated a substantial dataset enabling comparative analyses of cardiorenal risk across antihyperglycemic drug classes, particularly GLP-1 RAs. This analysis is critical for researchers and drug development professionals elucidating mechanisms of organ protection beyond glucose control.
Based on a review of recent trial publications and meta-analyses (2023-2024), the following table summarizes key outcome data for approved GLP-1 RAs with completed CVOTs. Data is presented as Hazard Ratio (HR) with 95% Confidence Interval (CI).
Table 1: Summary of Primary Cardiovascular and Renal Outcomes from Major GLP-1 RA CVOTs
| Drug (Trial Name) | Primary MACE Outcome (HR, 95% CI) | Key Renal Composite Outcome (HR, 95% CI) | CV Death (HR, 95% CI) | HF Hospitalization (HR, 95% CI) | Year Reported |
|---|---|---|---|---|---|
| Liraglutide (LEADER) | 0.87 (0.78, 0.97) | New macroalbuminuria: 0.74 (0.60, 0.91) | 0.78 (0.66, 0.93) | 0.87 (0.73, 1.05) | 2016 |
| Semaglutide (SUSTAIN-6) | 0.74 (0.58, 0.95) | New/worsening nephropathy: 0.64 (0.46, 0.88) | 0.98 (0.65, 1.48) | 1.11 (0.77, 1.61) | 2016 |
| Dulaglutide (REWIND) | 0.88 (0.79, 0.99) | New macroalbuminuria: 0.77 (0.68, 0.87) | 0.91 (0.78, 1.06) | 0.93 (0.77, 1.12) | 2019 |
| Oral Semaglutide (PIONEER 6) | 0.79 (0.57, 1.11) | Not Primary Endpoint | 0.49 (0.27, 0.92) | 1.02 (0.70, 1.49) | 2019 |
| Efpeglenatide (AMPLITUDE-O) | 0.73 (0.58, 0.92) | Composite renal: 0.68 (0.57, 0.82) | 0.73 (0.52, 1.01) | 0.82 (0.59, 1.14) | 2021 |
MACE: Major Adverse Cardiovascular Events (CV death, nonfatal MI, nonfatal stroke). Data sourced from primary trial publications and recent systematic reviews.
Experimental Protocols for Mechanistic Investigation
Protocol:In VitroAssessment of GLP-1 RA Signaling in Cardiomyocytes and Podocytes
Objective: To quantify pathway activation (cAMP, PI3K/Akt, AMPK) in relevant cell types. Materials: H9c2 cardiomyocytes, human podocyte cell line, GLP-1 RAs (liraglutide, semaglutide, exendin-4), forskolin (positive control), pathway-specific inhibitors (e.g., H-89 for PKA). Procedure:
- Cell Culture & Treatment: Seed cells in 12-well plates. Serum-starve for 4 hours prior to treatment.
- Dose-Response: Treat cells with increasing concentrations of GLP-1 RA (0.1 nM – 100 nM) for 15, 30, and 60 minutes.
- Pathway Inhibition: Pre-treat cells with relevant inhibitor (e.g., 10 µM H-89 for 30 min) before GLP-1 RA addition.
- cAMP Assay: Lyse cells and quantify intracellular cAMP using a commercial ELISA kit per manufacturer protocol.
- Protein Extraction & Western Blot: Lyse cells in RIPA buffer. Resolve 30 µg protein by SDS-PAGE. Transfer to PVDF membrane.
- Immunoblotting: Probe with primary antibodies for: p-Akt (Ser473), total Akt, p-AMPKα (Thr172), total AMPKα, and β-actin (loading control).
- Analysis: Quantify band density using imaging software. Normalize phosphorylated protein to total protein and then to β-actin.
Protocol: Meta-Analysis of Class-Wide CVOT Data
Objective: To perform a systematic review and network meta-analysis comparing the efficacy of GLP-1 RAs on cardiorenal outcomes. Data Sources: PubMed, EMBASE, Cochrane Central Register of Controlled Trials, ClinicalTrials.gov. Search String: ("GLP-1 receptor agonist" OR "liraglutide" OR "semaglutide" OR "dulaglutide") AND ("cardiovascular outcomes" OR "renal outcomes") AND ("randomized controlled trial"). Inclusion Criteria: RCTs with ≥500 participants, T2D population, reported MACE and/or renal composite endpoints. Data Extraction: Two independent reviewers extract: Study ID, drug, comparator, sample size, follow-up duration, HR and 95% CI for primary and secondary endpoints. Statistical Analysis:
- Perform pairwise meta-analysis for direct comparisons using a random-effects model (Mantel-Haenszel method).
- Conduct a Bayesian network meta-analysis to estimate relative effects between all GLP-1 RAs.
- Rank treatments using surface under the cumulative ranking curve (SUCRA) values.
- Assess heterogeneity (I² statistic) and publication bias (funnel plots).
Visualization of Signaling Pathways and Workflow
Diagram Title: GLP-1 RA Cardio-Renal Signaling Pathways
Diagram Title: Systematic Review & Meta-Analysis Protocol
The Scientist's Toolkit: Key Research Reagent Solutions
Table 2: Essential Reagents for GLP-1 RA CVOT Mechanistic Research
| Reagent / Material | Supplier Examples | Function in Research |
|---|---|---|
| Recombinant Human GLP-1 RAs (Liraglutide, Semaglutide) | Novo Nordisk, Tocris, MedChemExpress | Active pharmaceutical ingredients for in vitro and preclinical in vivo studies. |
| GLP-1 Receptor Antibody (for IHC/WB) | Abcam, Cell Signaling Technology, Santa Cruz | Detection and localization of GLP-1 receptor expression in tissue sections (heart, kidney). |
| Phospho-Specific Antibodies (p-Akt, p-AMPK, p-CREB) | Cell Signaling Technology | Quantification of pathway activation downstream of GLP-1 receptor signaling. |
| cAMP ELISA Kit | Cayman Chemical, Abcam, Enzo Life Sciences | Sensitive quantification of intracellular cAMP levels upon receptor activation. |
| Human Cardiomyocyte Cell Line (e.g., AC16) | MilliporeSigma, Applied StemCell | Consistent in vitro model for studying direct cardiac effects. |
| Conditionally Immortalized Human Podocyte Cell Line | University of Bristol (via transfer), Cellero | Key model for investigating direct renal protective mechanisms. |
| HTRF or AlphaLISA cAMP Assay Kits | Cisbio, PerkinElmer | Homogeneous, high-throughput screening for cAMP in cell-based assays. |
| siRNA for GLP-1R Knockdown | Dharmacon, Santa Cruz Biotechnology | Functional validation of receptor-specific effects via gene silencing. |
Application Notes
The therapeutic potential of GLP-1 receptor agonists (GLP-1RAs) in diabetes and obesity is tempered by ongoing surveillance of associated adverse events. This document synthesizes current evidence and outlines protocols for investigating three key safety signals: pancreatitis, gallbladder/biliary disease, and Medullary Thyroid Carcinoma (MTC). The data is contextualized within the drug development pipeline, emphasizing pre-clinical and clinical assessment strategies.
Table 1: Summary of Clinical Trial and Observational Study Meta-Analysis Data (Incidence per 1000 Patient-Years)
| Adverse Event | GLP-1RA Pooled Incidence | Active Comparator/Placebo Pooled Incidence | Relative Risk (95% CI) | Key Studies (Year) |
|---|---|---|---|---|
| Acute Pancreatitis | 1.8 | 1.5 | 1.15 (0.99, 1.34) | Li et al. (2022), Svanström et al. (2022) |
| Gallstone Disease | 4.2 | 3.1 | 1.37 (1.23, 1.52) | He et al. (2023) |
| Cholecystitis | 2.1 | 1.5 | 1.43 (1.28, 1.60) | He et al. (2023) |
| Medullary Thyroid Carcinoma | <0.01 | <0.01 | Not estimable (Rare) | FDA Adverse Event Reporting System (2023) |
Experimental Protocols
Protocol 1: In Vitro Assessment of GLP-1RA Effects on Human Thyroid C-Cell Proliferation and Calcitonin Secretion
Objective: To evaluate the potential of a GLP-1RA candidate to induce proliferation and calcitonin secretion in human MTC-derived cell lines.
Methodology:
- Cell Culture: Maintain human TT (MTC) cells in RPMI-1640 medium supplemented with 16% fetal bovine serum. Seed cells in 96-well plates (for proliferation) and 24-well plates (for secretion).
- Treatment: After 24-hour serum starvation, treat cells with the GLP-1RA candidate across a logarithmic concentration range (1 pM to 10 µM). Include vehicle control and a positive control (e.g., 100 nM Forskolin).
- Calcitonin Secretion Assay: For secretion, treat cells for 2 hours in serum-free medium. Collect supernatant. Quantify calcitonin via a validated, high-sensitivity chemiluminescent immunoassay.
- Proliferation Assay: Measure cell viability/proliferation at 24, 48, and 72 hours using a resazurin-based (Alamar Blue) fluorescence assay.
- Data Analysis: Normalize calcitonin secretion to total cellular protein. Express proliferation as fold-change relative to vehicle. Calculate EC50/IC50 values using four-parameter logistic regression.
Protocol 2: Ex Vivo Model of Gallbladder Motility and Bile Composition
Objective: To investigate the effects of chronic GLP-1RA exposure on gallbladder emptying and bile cholesterol saturation.
Methodology:
- Animal Model: Utilize diet-induced obese (DIO) rodents. Treat with GLP-1RA or vehicle subcutaneously for 8-12 weeks.
- Gallbladder Motility: At endpoint, perform an ex vivo gallbladder contractility assay. Isolate the gallbladder and cannulate it in an organ bath with oxygenated Krebs solution. Measure isometric tension in response to increasing doses of cholecystokinin (CCK-8; 1 pM – 100 nM) to assess sensitivity.
- Bile Analysis: Aspirate bile from the gallbladder and common bile duct. Analyze total lipid composition via enzymatic assays. Calculate Cholesterol Saturation Index (CSI) using Carey's critical tables.
- Histopathology: Fix gallbladders in formalin, section, and stain with H&E. Score for evidence of wall thickening, inflammation, or crystal deposition.
The Scientist's Toolkit: Key Research Reagent Solutions
| Item | Function in Safety Assessment |
|---|---|
| Human TT Cell Line | Well-characterized model of human medullary thyroid carcinoma for in vitro calcitonin studies. |
| Calcitonin CLIA Kit | High-sensitivity assay for quantifying calcitonin secretion from cells or serum samples. |
| Diet-Induced Obese (DIO) Mouse/Rat | Preclinical model for studying drug effects in a metabolically dysfunctional background. |
| Cholecystokinin Octapeptide (CCK-8) | Standard agonist to stimulate gallbladder contraction and assess motility function. |
| Lipid Profile Enzymatic Assay Kits | For precise quantification of cholesterol, phospholipids, and bile acids in bile samples. |
| GLP-1 Receptor Antibody (for IHC) | To confirm receptor presence/absence in pancreatic acinar, gallbladder, and thyroid tissues. |
Visualizations
GLP-1RA and Pancreatitis Hypothesis
GLP-1RA Safety Assessment Workflow
Cost-Effectiveness and Health Economic Evaluations Across Healthcare Systems
Application Notes: Health Economic Evaluation of GLP-1 RAs in Diabetes Management
Health economic evaluations are critical for informing formulary decisions and clinical guidelines for GLP-1 receptor agonists (GLP-1 RAs). The primary metrics include the Incremental Cost-Effectiveness Ratio (ICER), Quality-Adjusted Life-Year (QALY), and avoidance of costly complications.
Table 1: Key Cost-Effectiveness Outcomes for Select GLP-1 RAs vs. Standard of Care (2023-2024 Data)
| GLP-1 RA (Comparator) | Healthcare System / Perspective | Time Horizon | ICER (USD per QALY) | Key Driver of Value | Dominant in CV Risk Subgroup? |
|---|---|---|---|---|---|
| Semaglutide (oral, vs. sitagliptin) | US Payer | Lifetime | 6,200 | Superior HbA1c reduction, weight loss | Yes (with established CVD) |
| Dulaglutide (vs. insulin glargine) | UK NHS | 40-year | Cost-saving | Reduced CVD events & hypoglycemia | Yes |
| Tirzepatide (vs. semaglutide) | German Statutory | Lifetime | 28,500 | Superior weight & HbA1c outcomes | Under review |
| Liraglutide (vs. standard care) | Australian Public | Lifetime | 9,800 | Prevention of nephropathy & CVD | Yes (high risk) |
Interpretation: GLP-1 RAs with proven cardiovascular benefit (CVOT data) are increasingly cost-effective or cost-saving from a payer perspective, driven by long-term avoidance of expensive complications (hospitalizations for MI, stroke, renal failure). Value is maximized in populations with established cardiovascular disease or high baseline risk.
Experimental Protocols for Generating Health Economic Data
Protocol 1: Developing a De Novo Cost-Effectiveness Model (Microsimulation)
Objective: To estimate the long-term cost-effectiveness of a novel GLP-1 RA versus standard care. Methodology:
- Model Structure: Develop a state-transition (Markov) microsimulation model with health states: "No Complications," "Microvascular Complications" (neuropathy, nephropathy, retinopathy), "Macrovascular Complications" (MI, Stroke, HF), "Post-Complication," "Death."
- Clinical Inputs: Populate model with hazard ratios for key outcomes (HbA1c change, weight change, CV event rates) from Phase III RCTs and CVOTs. Use parametric survival models for time-to-event data.
- Cost Inputs: Assign direct medical costs (drug acquisition, administration, monitoring, complication management) sourced from national databases (e.g., CMS, NHS Reference Costs).
- Utility Inputs: Attach health state utilities (EQ-5D scores) from trial-based or mapping studies.
- Simulation: Run the model for a hypothetical cohort (n=100,000) over a lifetime horizon (e.g., 40 years). Apply annual discount rates (3% for costs, 3% for outcomes) as per national guidelines (e.g., NICE, ISPOR).
- Analysis: Calculate total costs, total QALYs, and ICER. Perform deterministic and probabilistic sensitivity analyses (PSA) to assess parameter uncertainty.
Protocol 2: Retrospective Real-World Data (RWD) Analysis for Cost-Offset
Objective: To quantify real-world medical cost savings associated with GLP-1 RA use in a defined population. Methodology:
- Data Source: Access a large administrative claims or electronic health record database (e.g., Optum, IBM MarketScan).
- Cohort Definition: Identify patients with T2D initiating a GLP-1 RA (exposed cohort). Create a matched comparator cohort using propensity score matching (1:1) on demographics, comorbidities, prior healthcare utilization, and baseline medication use.
- Outcome Measures: All-cause and diabetes-related total medical costs (inpatient, outpatient, pharmacy) per patient per month (PPPM).
- Statistical Analysis: Use generalized linear models (GLM) with gamma distribution and log link to compare PPPM costs between cohorts over a 12-month follow-up, adjusting for residual confounding. Conduct difference-in-differences analysis if possible.
- Validation: Perform multiple sensitivity analyses, including alternative matching algorithms and outcome definitions.
Visualization: Health Economic Evaluation Workflow
Diagram Title: Health Economic Evaluation Modeling Workflow
| Resource / Tool | Function in GLP-1 RA HEOR | Example / Provider |
|---|---|---|
| CVOT Clinical Trial Data | Source for hazard ratios of MACE, mortality, and renal outcomes for model clinical inputs. | LEADER (liraglutide), SUSTAIN-6 (semaglutide), REWIND (dulaglutide) |
| Real-World Databases | Provides data on real-world utilization, adherence, persistence, and associated costs. | IQVIA PharMetrics Plus, Optum Clinformatics, CPRD (UK) |
| Health State Utility Values | EQ-5D or SF-6D scores attached to model health states for QALY calculation. | UK NHS EQ-5D-3L Value Set, US MEPS-Based Scores |
| Costing Databases | Provides country-specific unit costs for drugs, procedures, and complication management. | Medicare Physician Fee Schedule, NHS Reference Costs, DRG Grouper |
| Modeling Software | Platform for building and running simulation models (Markov, Discrete Event). | TreeAge Pro, R (heemod, dampack), Microsoft Excel with VBA |
| HEOR Guidelines | Ensures methodological rigor and comparability of studies for decision-makers. | ISPOR Good Practices, NICE Technical Support Document, CHEERS Checklist |
Quantitative Comparison of Anti-Diabetic Drug Classes
Table 1: Efficacy and Safety Profile Summary (Based on Recent Head-to-Head and Meta-Analysis Data)
| Parameter | GLP-1 Receptor Agonists (e.g., Semaglutide, Tirzepatide*) | SGLT2 Inhibitors (e.g., Empagliflozin, Dapagliflozin) | Basal Insulin (e.g., Insulin Glargine, Degludec) | Emerging: Dual/Triple Agonists (e.g., Retatrutide) |
|---|---|---|---|---|
| HbA1c Reduction | 1.5 - 2.4% (Tirzepatide: up to 2.6%) | 0.7 - 1.0% | 1.5 - 1.8% (in trial add-on contexts) | 2.0 - 2.6% (Phase 2 Retatrutide 12mg) |
| Body Weight Change | -6.0 to -15.7% (Tirzepatide 15mg) | -2.0 to -4.0% | +1.5 to +3.5 kg | -17.1% (Retatrutide 12mg, 48 weeks) |
| CVOT Primary Outcome (HR) | 0.74-0.92 (Major Adverse CV Events) | 0.74-0.86 (Heart Failure Hospitalization) | Neutral or increased risk in some trials | Under investigation |
| Key Safety Notes | GI events common; rare risk of medullary thyroid carcinoma (rodents) | Genitourinary infections, DKA, volume depletion | Hypoglycemia, weight gain | GI events; safety profile under characterization |
| Renoprotection | Reduced UACR, hard outcome benefits (e.g., FLOW trial) | Robust evidence (CREDENCE, DAPA-CKD) | Neutral | Preliminary UACR reductions reported |
*Tirzepatide is a dual GIP/GLP-1 receptor agonist. Data synthesized from SURPASS, SUSTAIN, STEP, SELECT, DAPA-CKD, FLOW trials and 2023-2024 meta-analyses.
Table 2: Key Molecular and Pharmacological Targets
| Drug Class | Primary Target(s) | Key Secondary/Cascading Effects | Cellular Pathways Involved |
|---|---|---|---|
| GLP-1RAs | GLP-1 Receptor (GPCR) | ↑cAMP, ↑PKA, ↑PI3K/Akt, ↓NF-κB | cAMP/PKA, PI3K/Akt, CREB, EPAC2 |
| SGLT2 Inhibitors | SGLT2 Transporter | ↓Renal glucose reabsorption, ↑Sirt1, ↑AMPK, ↓mTOR | AMPK/mTOR, NRF2, HIF-1α |
| Insulin | Insulin Receptor (RTK) | ↑IRS-1/2, ↑PI3K/Akt, ↑MAPK/ERK | PI3K/Akt, MAPK/ERK, GLUT4 translocation |
| Emerging: Dual/Triple Agonists | GLP-1R, GIPR, GCGR | Integrated cAMP signaling from multiple receptors | Synergistic cAMP/PKA, β-arrestin recruitment |
Experimental Protocols
Protocol 1:In VitrocAMP Accumulation Assay for GLP-1R vs. GIPR Activation by Novel Agonists
Purpose: To quantify and compare the potency (EC₅₀) and efficacy (Emax) of mono-, dual-, and tri-agonists at relevant GPCR targets. Materials: HEK-293 cells stably expressing human GLP-1R, GIPR, or GCGR; HTRF cAMP-Gs HiRange kit (Cisbio); test compounds (GLP-1RA, Tirzepatide, Retatrutide); forskolin (control); assay buffer (HBSS with 0.5 mM IBMX). Procedure:
- Seed cells in white 384-well plates at 20,000 cells/well. Culture for 24h.
- Prepare 10-point, half-log serial dilutions of test agonists in stimulation buffer.
- Aspirate medium and add 10µL of agonist dilution per well. Include vehicle (0% stimulation) and 10µM forskolin (100% stimulation) controls. Incubate for 30min at 37°C, 5% CO₂.
- Add 5µL of cAMP-d2 and 5µL of Anti-cAMP-Eu Cryptate reagents per well. Incubate for 1h at RT in the dark.
- Measure time-resolved fluorescence at 620nm and 665nm on a compatible plate reader. Calculate the 665/620nm ratio.
- Data Analysis: Normalize data to forskolin control. Fit normalized dose-response curves using a four-parameter logistic model in software (e.g., Prism) to determine EC₅₀ and Emax.
Protocol 2:In VivoAssessment of Metabolic Efficacy in DIO Mice
Purpose: To evaluate the comparative effects on glycemia and body weight in a diet-induced obesity (DIO) mouse model. Materials: C57BL/6J DIO mice (16 weeks high-fat diet); osmotic minipumps (for continuous agonist delivery) or supplies for daily injection; test compounds; glucose meter and strips; metabolic cages (optional); ELISA kits for insulin, glucagon. Procedure:
- Randomize mice (n=8-10/group) matched for baseline body weight and fasting glucose. Administer vehicle, GLP-1RA (e.g., Semaglutide 10nmol/kg/day), SGLT2i (Empagliflozin 10mg/kg/day), or novel agonist via appropriate route.
- Measure body weight and food intake 3x weekly.
- Perform an intraperitoneal glucose tolerance test (IPGTT, 2g/kg glucose) at baseline and after 4 weeks of treatment. Collect blood via tail nick at 0, 15, 30, 60, 90, and 120 min for glucose measurement.
- At study endpoint (4-6 weeks), fast animals for 6h, collect terminal blood for HbA1c (HPLC), insulin, glucagon, and lipid panel analysis.
- Harvest liver, adipose tissue, and pancreas for histology (H&E, insulin/glucagon staining) and gene/protein expression analysis (e.g., PEPCK, G6Pase, UCP1).
- Statistical Analysis: Use two-way ANOVA for repeated measures (body weight, IPGTT) and one-way ANOVA for endpoint measures, with appropriate post-hoc tests.
Signaling Pathway & Workflow Visualizations
Title: GLP-1 and Insulin Signaling Pathways Convergence
Title: Preclinical Efficacy Workflow for Anti-Diabetic Drugs
The Scientist's Toolkit: Key Research Reagent Solutions
| Item / Reagent | Vendor Examples (Non-exhaustive) | Function in Research |
|---|---|---|
| HTRF cAMP Gs HiRange Kit | Revvity (Cisbio), Eurofins | Homogeneous, no-wash assay for quantitative measurement of cAMP accumulation in cells upon GPCR activation. |
| Phospho-Akt (Ser473) ELISA Kit | R&D Systems, Cayman Chemical, Cell Signaling Technology (CST) | Quantifies activation of the key PI3K/Akt pathway common to insulin and GLP-1R signaling. |
| Human GLP-1R / GIPR / GCGR Stable Cell Lines | Eurofins, DiscoverX, ATCC | Engineered cell lines for specific, reproducible receptor pharmacology studies and compound screening. |
| Mouse Metabolic Cage Systems | Columbus Instruments, TSE Systems | Integrated systems for simultaneous in vivo measurement of energy expenditure (O₂/CO₂), food/water intake, and locomotor activity. |
| Luminex Multiplex Assay for Metabolic Panels | MilliporeSigma, Bio-Rad, R&D Systems | Measures multiple biomarkers (insulin, glucagon, leptin, adiponectin, etc.) from small-volume serum/plasma samples. |
| SGLT2 (SLC5A2) Membrane Vesicles | Solvo Biotechnology, Corning Life Sciences | For in vitro assessment of compound-mediated inhibition of SGLT2 transport activity in a cell-free system. |
| Retatrutide (LY3437943) | MedChemExpress, Tocris (if available) | Reference standard triple agonist (GLP-1/GIP/GCGR) for comparative studies with older drug classes. |
Application Notes
Within the broader research thesis on GLP-1 receptor agonists, the development of dual and triple incretin agonists represents a significant evolution. These multi-agonists target complementary hormonal pathways to enhance glycemic control, promote weight loss, and potentially improve cardio-metabolic outcomes beyond what is achievable with selective GLP-1 receptor agonism alone.
Dual GIP/GLP-1 Receptor Agonists (e.g., Tirzepatide): The GIP (Glucose-dependent Insulinotropic Polypeptide) component is hypothesized to contribute to enhanced insulin secretion in a glucose-dependent manner and may improve adipose tissue metabolism. The synergistic action on both receptors leads to superior efficacy in reducing HbA1c and body weight compared to selective GLP-1 RAs.
Triple Glucagon/GLP-1/GIP Receptor Agonists: The addition of glucagon receptor agonism aims to further increase energy expenditure and reduce body weight through enhanced hepatic metabolism and satiety. Glucagon's action must be carefully balanced to avoid excessive hyperglycemia, which is counteracted by the potent glucose-lowering effects of GLP-1 and GIP.
Table 1: Clinical Efficacy of Dual and Triple Agonists vs. Selective GLP-1 RA (Semaglutide)
| Agent (Mechanism) | Trial (Duration) | HbA1c Reduction (%) | Body Weight Reduction (%) | Key Comparator |
|---|---|---|---|---|
| Tirzepatide (GIP/GLP-1) | SURPASS-2 (40 wk) | -2.01 to -2.30 | -7.6 to -9.5 kg* | Semaglutide 1 mg |
| Retatrutide (Glucagon/GLP-1/GIP) | Phase 2 (36 wk) | -1.94 to -2.17 | -8.7 to -17.5 kg | Placebo |
| Semaglutide (GLP-1) | SUSTAIN 2 (56 wk) | -1.3 to -1.8 | -4.3 to -6.1 kg | Sitagliptin/Placebo |
Tirzepatide 5 mg, 10 mg, 15 mg. *Retatrutide 1 mg, 4 mg, 8 mg, 12 mg.
Table 2: In Vitro & Preclinical Mechanistic Profile
| Parameter | GLP-1 RA | GIP/GLP-1 RA | Triple Agonist |
|---|---|---|---|
| cAMP EC50 (GLP-1R) | ~0.1-1 nM | ~0.1-1 nM | ~0.1-1 nM |
| cAMP EC50 (GIPR) | Inactive | ~0.1-1 nM | ~0.1-1 nM |
| cAMP EC50 (GCGR) | Inactive | Inactive | ~0.5-5 nM |
| In Vivo Weight Loss (Rodent) | +++ | ++++ | +++++ |
| Energy Expenditure | + | ++ | ++++ |
Experimental Protocols
Protocol 1: In Vitro cAMP Accumulation Assay for Receptor Potency and Efficacy
Objective: Determine the half-maximal effective concentration (EC50) and maximal response (Emax) for agonist activity at human GLP-1, GIP, and Glucagon receptors. Materials: HEK293 cells stably expressing individual receptors, agonist test compounds, cAMP assay kit (e.g., HTRF, AlphaScreen), assay buffer. Procedure:
- Seed cells in poly-D-lysine coated 96-well plates (20,000 cells/well). Culture overnight.
- Serum-starve cells for 2-4 hours in assay buffer.
- Prepare serial dilutions of reference and test agonists (typically 11-point, 1:3 dilutions).
- Aspirate medium and add 50 µL of agonist dilution per well. Incubate for 30 min at 37°C.
- Lyse cells and detect cAMP according to HTRF kit instructions (add lysis buffer with conjugated cryptate and d2, incubate 1 hr, read at 665/620 nm).
- Data Analysis: Normalize data to maximum response of native ligand (GLP-1, GIP, or Glucagon). Fit normalized dose-response curves using a 4-parameter logistic model to calculate EC50 and Emax values.
Protocol 2: Chronic Efficacy Study in Diet-Induced Obese (DIO) Mice
Objective: Evaluate the effects of chronic administration on body weight, food intake, and glycemic control. Materials: DIO C57BL/6J mice, osmotic mini-pumps or materials for daily injection, test/control compounds, glucometer, scales, metabolic cages (optional). Procedure:
- Acclimate mice for 1 week. Randomize into treatment groups (n=8-10) based on body weight and fasting glucose.
- Administer compounds via daily subcutaneous injection or continuous infusion via implanted osmotic pump for 4-6 weeks.
- Measurements:
- Record body weight and food intake 2-3 times per week.
- Perform weekly intraperitoneal glucose tolerance tests (IPGTT) after a 6-hr fast.
- At study end, collect terminal blood for HbA1c, insulin, lipid panel. Harvest tissues (liver, adipose, pancreas) for histology/RNA analysis.
- Data Analysis: Compare area under the curve (AUC) for glucose during IPGTT, body weight trajectories, and terminal biomarkers using ANOVA with post-hoc testing.
Signaling Pathway & Experimental Workflow Diagrams
Diagram 1: Signaling Pathways of Multi-Incretin Agonists
Diagram 2: Multi-Agonist Drug Development Workflow
The Scientist's Toolkit: Research Reagent Solutions
Table 3: Essential Research Materials for Multi-Agonist Studies
| Reagent/Material | Function & Application | Example Product/Catalog |
|---|---|---|
| Recombinant Human Receptors (Cell Lines) | Stable cell lines expressing GLP-1R, GIPR, or GCGR for in vitro signaling assays. Essential for determining agonist potency and selectivity. | HEK293-hGLP1R, CHO-K1-hGIPR (e.g., from Eurofins DiscoverX). |
| cAMP Detection Kit (HTRF) | Homogeneous Time-Resolved Fluorescence assay for quantifying intracellular cAMP accumulation, the primary downstream readout of receptor activation. | Cisbio cAMP Gs Dynamic Kit (62AM4PEC). |
| β-Arrestin Recruitment Assay Kit | Measures agonist-induced β-arrestin binding, assessing a signaling pathway distinct from cAMP, relevant for internalization and biased agonism. | PathHunter eXpress β-Arrestin assay (DiscoverX). |
| Diet-Induced Obese (DIO) Mouse Model | In vivo model of obesity and insulin resistance for evaluating chronic metabolic efficacy of agonists on weight, glucose, and lipids. | C57BL/6J DIO mice (e.g., Jackson Lab). |
| Implantable Osmotic Pumps | For continuous subcutaneous infusion of test agonists in rodents, mimicking chronic therapy and ensuring stable plasma levels. | Alzet mini-osmotic pumps (Model 2004/2006). |
| Metabolic Cage Systems | Allows simultaneous, longitudinal measurement of food intake, water consumption, energy expenditure (VO2/VCO2), and locomotor activity. | Promethion or TSE Systems cages. |
| Multiplex Metabolic Hormone Panel | Measures key hormones (insulin, glucagon, GLP-1, GIP, leptin) from small-volume serum/plasma samples in preclinical and clinical studies. | MILLIPLEX MAP Mouse Metabolic Hormone Magnetic Bead Panel (MMHMAG-44K). |
Conclusion
GLP-1 receptor agonists have revolutionized diabetes treatment by validating the incretin pathway, offering robust glycemic control with weight loss and proven cardiorenal benefits. From foundational discovery to sophisticated clinical application, this class demonstrates the success of targeted receptor pharmacology. Key challenges remain in optimizing tolerability, adherence, and access. The future lies in multifactorial optimization: developing oral formulations, enhancing receptor selectivity, and creating multi-agonists with superior efficacy. For researchers, the path forward involves elucidating tissue-specific signaling, personalizing therapy through biomarkers, and exploring applications beyond type 2 diabetes. The continued evolution of GLP-1-based therapies represents a paradigm shift towards integrated metabolic disease management, setting a high bar for future drug development in chronic diseases.