Ex Vivo Jejunal Sac Assay: A Comprehensive Guide to Measuring Glucose Absorption for Drug Discovery and Research
This article provides a detailed guide on the ex vivo everted jejunal sac technique, a fundamental tool for investigating intestinal glucose absorption mechanisms.
Ex Vivo Jejunal Sac Assay: A Comprehensive Guide to Measuring Glucose Absorption for Drug Discovery and Research
Abstract
This article provides a detailed guide on the ex vivo everted jejunal sac technique, a fundamental tool for investigating intestinal glucose absorption mechanisms. Tailored for researchers and drug development professionals, the content spans from foundational principles of sodium-glucose cotransport (SGLT1) to advanced methodological protocols, troubleshooting, and validation against other techniques like the Ussing chamber. It also explores applications in evaluating functional ingredients and pharmacological inhibitors, synthesizing key insights to inform future research in metabolic diseases and nutrient absorption.
Unraveling the Mechanisms: The Science of Jejunal Glucose Transport
Core Principles of Transcellular and Paracellular Glucose Absorption
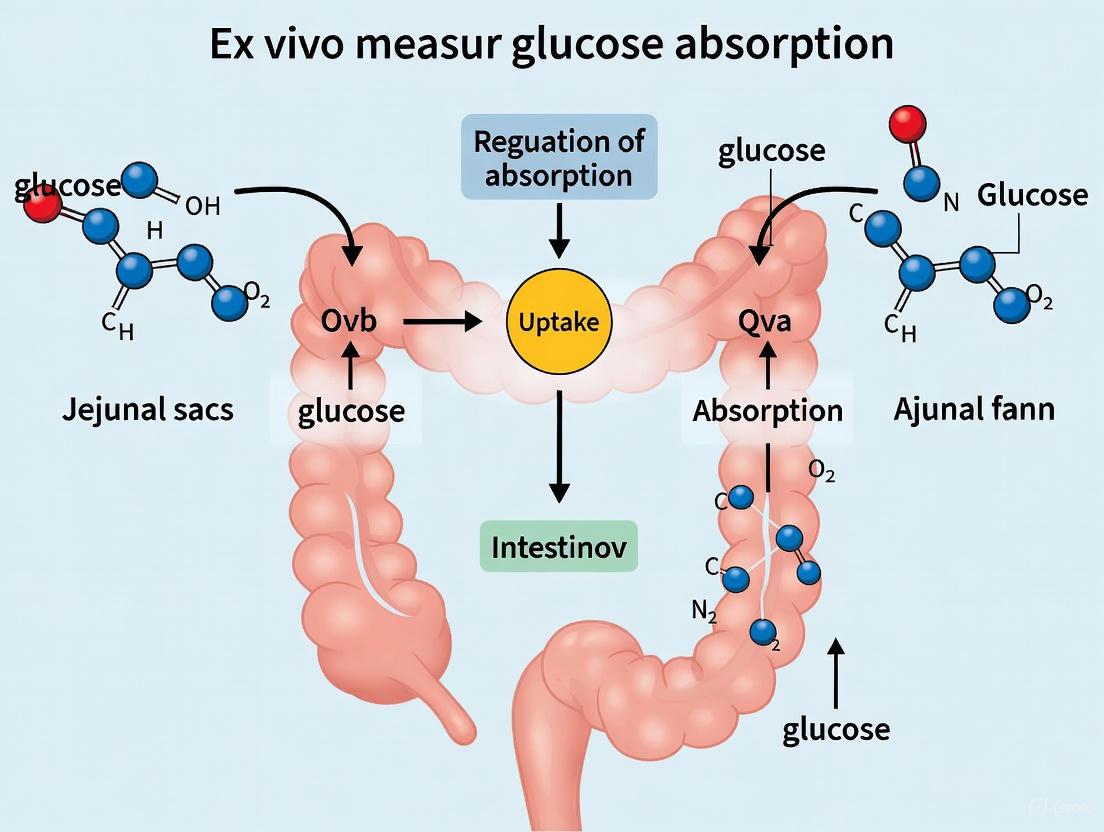
The small intestine serves as the primary site for dietary glucose uptake, a process critical for maintaining systemic energy homeostasis. Intestinal glucose absorption occurs via two principal pathways: transcellular (through the enterocytes) and paracellular (between the enterocytes) transport. Understanding the mechanisms governing these pathways is essential for research in metabolic diseases, drug development, and nutrient absorption. This application note details the core principles of these absorption routes and provides a standardized experimental protocol for their investigation using ex vivo everted jejunal sacs, a cornerstone technique for direct measurement of nutrient uptake. The protocol is framed within a broader thesis on ex vivo measurement, enabling precise quantification of absorption kinetics and the contribution of specific transporters.
Core Absorption Pathways
Glucose absorption in the small intestine is a complex process involving coordinated activity of specific transporters and regulated epithelial permeability.
Transcellular Transport
The transcellular pathway involves the movement of glucose across the enterocyte, a process mediated by specific transporter proteins located on the apical and basolateral membranes.
- Apical Membrane Uptake: At physiologically low luminal glucose concentrations (typically less than 30 mM), the primary route for apical entry is active transport via the Sodium-Glucose Cotransporter 1 (SGLT1) [1] [2]. SGLT1 couples the transport of one glucose molecule with two sodium ions, utilizing the sodium gradient established by Na+/K+ ATPase on the basolateral membrane as its driving force [1]. This process is saturable and can be competitively inhibited by phloridzin [1] [2].
- Basolateral Membrane Efflux: Once inside the enterocyte, glucose exits into the lamina propria and bloodstream via facilitated diffusion through the GLUT2 transporter located on the basolateral membrane [1]. GLUT2 has a higher capacity but lower affinity for glucose compared to SGLT1.
Table 1: Key Transcellular Glucose Transporters
| Transporter | Location | Mechanism | Kinetic Property | Inhibitor |
|---|---|---|---|---|
| SGLT1 | Apical Membrane | Active, Na+-dependent | High affinity, Low capacity | Phloridzin |
| GLUT2 | Basolateral Membrane | Facilitated Diffusion | Low affinity, High capacity | Phloretin |
At high luminal glucose concentrations (>30 mM), a secondary, rapid-response mechanism may be recruited. Evidence suggests that GLUT2 can be translocated to the apical membrane, providing a high-capacity pathway for glucose uptake via facilitated diffusion, though the physiological significance of this pathway is still debated [1] [2].
Paracellular Transport
The paracellular pathway allows for the passive movement of glucose and other solutes through the tight junctions between adjacent enterocytes.
- This pathway becomes particularly relevant at high intraluminal glucose concentrations when active transport via SGLT1 is saturated [1].
- The absorption is primarily driven by a solvent drag effect, where the osmotic gradient created by active solute absorption pulls water, along with dissolved glucose, through the tight junctions [1] [3].
- The permeability of the tight junctions is dynamically regulated by proteins such as claudin, which controls the size and charge selectivity of the paracellular space [2]. Increased paracellular permeability, including for ions like Na+, has been observed in fasted states, potentially optimizing absorption upon refeeding [2].
Table 2: Characteristics of Intestinal Glucose Absorption Pathways
| Feature | Transcellular Pathway | Paracellular Pathway |
|---|---|---|
| Route | Through the enterocyte | Between enterocytes |
| Primary Mechanism | Carrier-mediated (SGLT1/GLUT2) | Passive solvent drag |
| Energy Dependence | Active (SGLT1) | Passive |
| Saturability | Yes | No |
| Involvement of Tight Junctions | No | Yes (Claudins) |
| Dominant Luminal [Glucose] | Low (< 30 mM) | High (> 30 mM) |
Experimental Protocol: Everted Jejunal Sac Assay
The following protocol is optimized for the investigation of transcellular and paracellular glucose absorption mechanisms, incorporating key experimental considerations from recent literature.
Reagents and Materials
- Animals: Male Wistar rats (~250 g) or C57BL/6 mice. Note: Fasting status (e.g., 24-hour fast) significantly upregulates jejunal SGLT1 activity and must be standardized [2].
- Buffers:
- Krebs-Ringer Bicarbonate (KRB) Buffer: 118 mM NaCl, 4.7 mM KCl, 2.5 mM CaCl₂, 1.2 mM MgSO₄, 1.2 mM KH₂PO₄, 25 mM NaHCO₃, 0.5 mM L-glutamine, 10 µM indomethacin. Gas with 95% O₂/5% CO₂ to pH 7.4 [2].
- Glucose Solution: 100 mM D-glucose in isotonic saline. For sensitive quantification, include a radioactive tracer (e.g., ¹⁴C-D-glucose) or a non-metabolizable analog like ¹⁴C-Methyl-α-D-glucopyranoside (MGP) [4] [2].
- Mannitol Solution: 100 mM D-mannitol with a tracer (e.g., ¹⁴C-Mannitol) as a paracellular permeability marker [4].
- Pharmacological Agents:
- Equipment: Dissection toolkit, water bath (37°C), carbogen (95% O₂/5% CO₂) supply, oxygenation tubes, scintillation counter (if using radiolabels).
Step-by-Step Procedure
Tissue Preparation:
- Euthanize the animal humanely and perform a midline laparotomy. Excise the entire small intestine rapidly.
- Flush the intestine with ice-cold, pre-oxygenated KRB buffer to remove luminal contents.
- Gently evert the jejunal segment (identified as the segment 10-20 cm distal to the ligament of Treitz) over a glass rod or using fine forceps, creating a serosal-out mucosal-in sac.
- Cut the everted segment into 3-4 cm lengths.
Sac Incubation:
- Fill each sac with 0.5-1 mL of pre-warmed, oxygenated KRB buffer (serosal solution).
- Ligate both ends of the sac securely and place it in a glass tube containing 10-20 mL of pre-warmed, oxygenated KRB buffer (mucosal solution).
- For experimental groups, supplement the mucosal solution with:
- Group 1 (Total Absorption): 100 mM Glucose + ¹⁴C-Glucose/MGP.
- Group 2 (Transcellular Inhibition): 100 mM Glucose + ¹⁴C-Glucose/MGP + 1 mM Phloridzin.
- Group 3 (Paracellular Marker): 100 mM Mannitol + ¹⁴C-Mannitol.
- Gas the incubation tubes continuously with 95% O₂/5% CO₂ and maintain in a shaking water bath at 37°C for a predetermined time (e.g., 30-60 minutes).
Sample Collection and Analysis:
- After incubation, remove the sacs from the tubes, gently blot dry, and weigh.
- Puncture the sac and collect the serosal fluid.
- Measure the glucose concentration in the serosal fluid and mucosal solution using a glucose assay kit or HPLC.
- If using radiolabels, measure the radioactivity in serosal fluid and mucosal solution using a liquid scintillation counter to calculate the appearance rate of the tracer [4].
Data Calculation:
- Calculate the Glucose Transport Rate (nmol/min/cm² or nmol/min/g tissue).
- Calculate the Mannitol Apparent Permeability (Papp) as a marker of paracellular integrity and flux.
- The phloridzin-sensitive component represents SGLT1-mediated active transport. The remaining glucose flux in the presence of phloridzin, correlated with mannitol Papp, indicates the paracellular contribution.
The Scientist's Toolkit
Table 3: Essential Research Reagents for Glucose Absorption Studies
| Research Reagent | Function / Explanation |
|---|---|
| ¹⁴C-D-Glucose / ¹⁴C-MGP | Radioactive tracer for sensitive quantification of total glucose absorption flux; MGP is non-metabolizable [4] [2]. |
| ¹⁴C-Mannitol | Paracellular permeability marker; measures the integrity and flow through the tight junction pathway [4]. |
| Phloridzin | Selective, competitive inhibitor of SGLT1; used to isolate and block the active transcellular transport component [1] [2]. |
| Triaminopyrimidine | Inhibitor of paracellular tight junction permeability; used to block the solvent-drag-mediated absorption pathway [3]. |
| Everted Jejunal Sac | Classic ex vivo model that maintains tissue cytoarchitecture, allowing for separate sampling of mucosal and serosal compartments to measure net transport [5]. |
Visualization of Pathways and Workflow
The following diagrams illustrate the molecular mechanisms of glucose absorption and the experimental workflow for the everted sac protocol.
Glucose Absorption Mechanisms
Everted Sac Experimental Workflow
Within the context of research utilizing ex vivo jejunal sacs, a precise understanding of the key transporters mediating glucose absorption is fundamental. This absorption is a coordinated, multi-step process primarily orchestrated by three transporter systems: the sodium-glucose cotransporter 1 (SGLT1) on the apical membrane, the facilitative glucose transporter 2 (GLUT2) on the basolateral membrane, and the sodium-potassium pump (Na+/K+-ATPase) that energizes the entire system [6] [7]. The functional interplay between these transporters ensures efficient uptake of dietary glucose from the intestinal lumen into the bloodstream. This application note details their distinct roles, quantitative kinetic parameters, and provides validated experimental protocols for investigating their function in ex vivo models, specifically tailored for the jejunal sac preparation.
Transporter Profiles and Quantitative Kinetic Data
The following table summarizes the core functional characteristics and localization of the three key transporters in the enterocyte.
Table 1: Key Transporters in Intestinal Glucose Absorption
| Transporter | Primary Localization | Transport Mechanism | Key Function | Reported Km for Glucose |
|---|---|---|---|---|
| SGLT1 | Apical (Brush Border) Membrane [6] | Secondary active Na+-glucose symport (2 Na+:1 glucose) [7] | Mediates uphill uptake of glucose from the lumen into the enterocyte [6] | 2-6 mM (in vitro); 6-23 mM (in vivo, with unstirred layer effects) [8] |
| GLUT2 | Basolateral Membrane [6] [9] | Facilitated diffusion | Mediates glucose efflux from enterocyte into blood [9] [7] | ~17 mM (Low affinity, high capacity) [9] |
| Na+/K+-ATPase | Basolateral Membrane [10] [11] | Primary active transport (3 Na+ out: 2 K+ in) | Maintains transcellular Na+ gradient, the driving force for SGLT1 [10] | N/A (Pumps ions, not glucose) |
The diagram below illustrates the coordinated workflow of glucose absorption and its investigation in an ex vivo jejunal sac model, integrating the physiological process with key experimental assessment points.
Diagram 1: Integrated glucose absorption pathway and ex vivo investigation points. EECs: Enteroendocrine Cells; MGP: Methyl α-D-glucopyranoside.
Detailed Experimental Protocols for Jejunal Sac Studies
Protocol 1: Measuring SGLT1-Mediated Glucose Uptake Using Radiolabeled Tracers
This protocol is adapted from methods used in knockout mouse studies to directly quantify apical glucose influx [6].
- Objective: To quantify the specific contribution of SGLT1 to total glucose uptake in ex vivo jejunal sacs.
- Principle: The non-metabolizable glucose analog α-Methyl-D-glucopyranoside (AMG) or D-glucose combined with a radiolabeled tracer (e.g., [¹⁴C(U)]-D-glucose) is used. The extracellular space is corrected for using a paracellular marker like [³H]-Mannitol.
- Materials:
- Krebs or Ringer buffer (pH 7.4)
- [¹⁴C(U)]-D-glucose (e.g., 370 Bq/µl)
- [³H(N)]-D-Mannitol (e.g., 370 Bq/µl)
- Phlorizin (specific SGLT1 inhibitor)
- Scintillation counter
- Procedure:
- Sac Preparation: Euthanize the animal following approved ethical guidelines. Immediately excise the small intestine and swiftly dissect the jejunum section. Flush with ice-cold oxygenated Krebs buffer to remove luminal contents.
- Sac Formation: Evert the jejunal segment and tie off one end. Carefully inject oxygenated Krebs buffer containing the experimental substrates into the sac, then tie off the other end to create a closed sac.
- Incubation: Incubate sacs in oxygenated Krebs buffer containing:
- Test condition: [¹⁴C]-Glucose + [³H]-Mannitol
- Control condition: [¹⁴C]-Glucose + [³H]-Mannitol + 0.5 mM Phlorizin
- Termination: After a set time (e.g., 15 minutes), quickly remove sacs and rinse thoroughly in ice-cold buffer to halt transport and remove adherent fluid.
- Sample Processing: Digest tissue segments or extract radioactivity. Measure ¹⁴C and ³H radioactivity in a liquid scintillation counter.
- Calculation: Calculate tissue-retained glucose by subtracting the [³H]-Mannitol space (extracellular volume) from the total [¹⁴C]-Glucose counts. The phlorizin-sensitive component represents SGLT1-specific uptake.
Protocol 2: Functional Analysis of SGLT1 and Na+/K+-ATPase Using the Ussing Chamber
This electrophysiological approach directly measures the real-time, electrogenic activity of SGLT1 [2] [7].
- Objective: To assess the functional activity of SGLT1 and its dependence on the Na+ gradient established by Na+/K+-ATPase.
- Principle: SGLT1 cotransports Na+ with glucose, generating a current. This glucose-induced change in short-circuit current (ΔIsc) is a direct measure of SGLT1 activity. Ouabain, a Na+/K+-ATPase inhibitor, ablates the Na+ gradient and thus inhibits this current.
- Materials:
- Ussing chamber system
- Data acquisition software
- D-glucose
- Ouabain
- Procedure:
- Tissue Mounting: Following euthanasia, swiftly remove the jejunum. Strip the outer muscle layers to obtain a mucosa-submucosa preparation. Mount the tissue between the two halves of the Ussing chamber, exposing the mucosal and serosal surfaces to separate reservoirs of oxygenated Ringer's solution.
- Baseline Measurement: Under short-circuit conditions, monitor the baseline Isc and transepithelial resistance until stable.
- Glucose Stimulation: Add D-glucose (e.g., 10-50 mM) to the mucosal reservoir. The rapid increase in Isc (ΔIsc) corresponds to SGLT1-mediated electrogenic Na+ transport.
- Inhibition of Na+/K+-ATPase: To confirm the role of the Na+ gradient, add ouabain (e.g., 1 mM) to the serosal reservoir. The subsequent decay of Isc demonstrates the dependence of SGLT1 on Na+/K+-ATPase activity.
Regulatory Mechanisms and Signaling Pathways
Glucose absorption is dynamically regulated by dietary status and hormonal signals, which can significantly impact experimental outcomes in ex vivo preparations.
- Fasting and Feeding: Fasting for 24-48 hours robustly upregulates glucose-induced Isc (SGLT1 activity) in the mouse jejunum compared to the fed state. Conversely, a high-glucose diet can suppress jejunal SGLT1 activity [2].
- Ion Channel Modulation: The membrane potential of enterocytes, set by K+ channels (e.g., KCNQ1), provides the electrical driving force for SGLT1. Inhibition of these K+ channels causes membrane depolarization and reduces SGLT1 activity [7].
- Cytosolic Calcium: Changes in cytosolic Ca²+ levels ([Ca²+]cyt) can regulate both SGLT1 and GLUT2 activity, linking glucose absorption to various signaling pathways [7].
The following table provides a toolkit of key reagents for modulating these transporters in experimental settings.
Table 2: Research Reagent Solutions for Investigating Glucose Transport
| Reagent / Tool | Function / Target | Experimental Application | Key Consideration |
|---|---|---|---|
| Phlorizin | High-affinity, competitive SGLT1 inhibitor [6] | To isolate the SGLT1-specific component of glucose uptake. Typically used at 0.1-0.5 mM. | Distinguishes active (SGLT1) from passive/diffusive components. |
| Ouabain | Specific inhibitor of Na+/K+-ATPase [12] | To collapse the transcellular Na+ gradient. Confirms SGLT1 dependence on the Na+ pump. Serosal application in Ussing chamber. | Leads to a slow decay of SGLT1-mediated Isc. |
| α-Methyl-D-glucopyranoside (AMG) | Non-metabolizable SGLT1 substrate [2] | To measure SGLT1 transport activity without interference from intracellular metabolism. | Ideal for flux studies using radiolabeled ¹⁴C-AMG. |
| GLUT2 Knockout Mice | Genetic model lacking functional GLUT2 [6] | To investigate the essentiality of GLUT2 in basolateral glucose efflux and overall absorption. | These mice are viable but exhibit glucose homeostasis defects. |
| K+ Channel Blockers (e.g., Chromanol 293B) | Inhibitors of KCNQ1 K+ channels [7] | To study the role of membrane potential in driving SGLT1 activity. | Blockers cause membrane depolarization and reduce glucose absorption. |
The ex vivo jejunal sac model provides a powerful system for deconstructing the complex, coordinated functions of SGLT1, GLUT2, and Na+/K+-ATPase. A rigorous experimental approach, utilizing the specific inhibitors, substrates, and genetic models outlined in this note, allows researchers to dissect the contribution of each transporter to overall glucose absorption. Understanding these mechanisms and their regulation is not only critical for basic physiology but also for identifying novel therapeutic targets for metabolic disorders such as diabetes and obesity.
The understanding of intestinal glucose absorption was fundamentally transformed by the work of Robert K. Crane. In August 1960, at a symposium in Prague, Crane presented for the first time his sodium-gradient hypothesis, proposing that the active transport of glucose across the intestinal mucosa is directly coupled to the flow of sodium ions down its electrochemical gradient [13] [14]. This pioneering concept of cotransport was the first proposal of flux coupling in biology and provided the physiological foundation for oral rehydration therapy (ORT), a treatment that saves millions of lives annually from diarrheal diseases [13]. This Application Note details the core principles of Crane's hypothesis and provides modern experimental protocols for investigating sodium-dependent glucose uptake in ex vivo jejunal sac models, a cornerstone technique in nutrient transport research and drug discovery.
The elegance of Crane's model lies in its explanation of how glucose accumulation occurs against its concentration gradient. The energy is derived not from ATP directly, but from the sodium electrochemical gradient across the apical membrane of the enterocyte. This gradient is established and maintained by the basolateral Na+/K+-ATPase (sodium-potassium pump), which actively pumps sodium out of the cell into the serosal space, thereby maintaining a low intracellular sodium concentration [13] [14]. The coupling of glucose movement to this "downhill" sodium flow provides the driving force for "uphill" glucose transport.
Core Mechanistic Principles
The cellular model of sodium-glucose cotransport, as established by Crane and later refined, involves a coordinated process across the enterocyte membranes [13] [14]:
- Apical Influx via SGLT1: At the brush border membrane (lumen-facing), the sodium-glucose linked cotransporter 1 (SGLT1) binds both sodium and glucose simultaneously. Utilizing the energy from the inward sodium gradient, it undergoes a conformational change to transport these substrates into the cell. The stoichiometry for SGLT1 is 2 Na+ ions : 1 glucose molecule, making the process electrogenic and sensitive to the membrane potential [14].
- Basolateral Efflux via GLUT2: The glucose accumulated inside the cell exits across the basolateral membrane into the bloodstream via the facilitative glucose transporter 2 (GLUT2), moving down its concentration gradient [13].
- Maintenance of Ion Gradients: The Na+/K+-ATPase on the basolateral membrane continuously pumps sodium out to maintain the transmembrane sodium gradient, a process that consumes ATP and links the overall process to cellular energy status [13] [14]. Potassium ions, pumped into the cell, are recycled via basolateral potassium channels, helping to maintain the negative intracellular membrane potential that further drives sodium entry.
Table 1: Key Molecular Components in Sodium-Dependent Glucose Absorption
| Component | Gene | Cellular Localization | Primary Function | Key Characteristics |
|---|---|---|---|---|
| SGLT1 | SLC5A1 [14] | Apical Membrane [14] | Na+-coupled glucose uptake | 2 Na+ : 1 Glucose coupling; Electrogenic; High glucose affinity [14] |
| GLUT2 | SLC2A2 [13] | Basolateral Membrane [13] | Facilitated glucose efflux | Concentration gradient-driven; High capacity |
| Na+/K+ ATPase | ATP1A1, etc. [14] | Basolateral Membrane [14] | Maintains Na+/K+ gradients | Pumps 3 Na+ out, 2 K+ in; ATP-dependent [14] |
The following diagram illustrates the coordinated interplay of these transporters and ion channels in an enterocyte, enabling efficient glucose absorption.
Quantitative Foundations & Key Evidence
Crane's hypothesis is robustly supported by decades of experimental evidence. Key quantitative findings that validate the model are summarized in the table below. These data points are critical for researchers to understand the expected magnitude of effects and for designing experiments with appropriate positive and negative controls.
Table 2: Key Experimental Evidence Supporting Crane's Hypothesis
| Experimental Observation / Parameter | System | Quantitative Outcome / Value | Biological Significance & Interpretation |
|---|---|---|---|
| Na+ Dependence of Glucose Influx | Human Jejunal Epithelium [15] | Influx with Na+: 4.41 µmole/hr/cm²\nInflux without Na+: 1.65 µmole/hr/cm² | A >60% reduction in glucose uptake in Na+-free medium provides direct evidence for Na+-dependence. |
| Steady-State Glucose Accumulation | Human Jejunal Epithelium [15] | C/M* in Ringer: 3.97\nC/M with Ouabain: 1.63\nC/M in Na+-free: 0.99 | The accumulation of glucose against a gradient (C/M >1) is abolished by inhibiting the Na+ gradient (via ouabain) or removing Na+. |
| Electrogenic Transport (Short-Circuit Current, Isc) | Human Jejunal Epithelium [15] | Kt for glucose-induced Isc: ~8.01 mM | Glucose transport generates a measurable electrical current, confirming electrogenicity. The Kt indicates transporter affinity. |
| Regional Specificity in Mice | Mouse Jejunum (Fasted) [2] | Robust glucose-induced Isc after 24-48h fasting. | SGLT1-mediated glucose absorption is dynamically regulated and can be segment-specific, a key consideration for experimental design. |
| Inhibitor Specificity | Various [13] [16] | 100% inhibition of SGLT1-mediated uptake by 0.1-0.3 mM Phloridzin. | Phloridzin is a potent and specific competitive inhibitor of SGLT1, serving as an essential negative control. |
*C/M = Cellular to Medium concentration ratio.
Experimental Protocols: Ex Vivo Jejunal Sac Preparation
This section provides a detailed methodology for assessing sodium-dependent glucose uptake using an ex vivo everted jejunal sac model, a classic and powerful technique for direct investigation of transporter function.
Materials & Reagents
Table 3: Research Reagent Solutions for Jejunal Sac Assays
| Reagent / Solution | Composition / Preparation | Primary Function in Experiment |
|---|---|---|
| Oxygenated Krebs-Ringer Bicarbonate (KRB) Buffer | 119 mM NaCl, 21 mM NaHCO₃, 2.4 mM K₂HPO₄, 0.6 mM KH₂PO₄, 1.2 mM CaCl₂, 1.2 mM MgCl₂, 0.5 mM L-glutamine [2]. Gas with 95% O₂/5% CO₂ to pH 7.4. | Physiological saline for tissue incubation, providing ions, pH buffering, and oxygenation. |
| Na+-Free Buffer | Replace NaCl and NaHCO₃ in KRB with equimolar Choline Chloride and KHCO₃. Maintain osmolarity with mannitol. | Critical control to demonstrate Na+-dependence of glucose uptake. |
| D-Glucose Stock Solution | 1 M D-Glucose in KRB or Na+-Free buffer. Filter sterilize. | Substrate for SGLT1 transport activity. |
| Phloridzin Stock Solution | 10 mM Phloridzin in DMSO. Final working concentration typically 0.1-0.3 mM [13]. | Specific, competitive inhibitor of SGLT1; used to confirm transporter-specific uptake. |
| Ouabain Stock Solution | 1 mM Ouabain in water. | Inhibitor of basolateral Na+/K+-ATPase; used to dissipate the Na+ gradient indirectly. |
| Radioactive or Non-Radiometric Tracer | 14C-labeled D-glucose or a non-metabolizable analog like 14C-Methyl-α-D-Glucopyranoside (14C-MGP) [2]. | Allows for precise quantification of glucose flux across the intestinal tissue. |
Step-by-Step Workflow
The following diagram outlines the key stages of the everted jejunal sac experiment, from tissue preparation to data analysis.
Protocol Steps:
Tissue Preparation:
- Euthanize the animal according to approved ethical guidelines.
- Immediately perform a midline laparotomy to expose the gastrointestinal tract.
- Excise the entire small intestine and place it in ice-cold, oxygenated KRB buffer.
- Identify the jejunum (typically the proximal two-fifths of the small intestine following the duodenum).
- Gently flush the lumen with cold KRB to remove intestinal contents.
- Cut the jejunum into segments of 3-4 cm in length.
- Carefully evert each segment using a slender rod or blunt needle, turning the mucosal surface outward. Tie off one end with suture silk to create a sac.
Incubation & Experimental Conditions:
- Fill the everted sac (serosal side) with a small volume (e.g., 0.5 mL) of oxygenated KRB buffer containing the tracer and/or experimental compounds.
- Tie off the top end to create a closed sac.
- Immerse each sac in a separate flask or vial containing 10-20 mL of oxygenated incubation buffer (mucosal side) at 37°C. The mucosal incubation buffer will define the experimental condition (see Table 3).
- Incubate the sacs for a predetermined time (e.g., 15-30 minutes) with continuous oxygenation and gentle shaking.
Sample Collection & Analysis:
- After incubation, quickly remove the sacs from the media, rinse in ice-cold Na+-free buffer to stop transport and remove adherent radioactivity/nutrient.
- Gently blot the sacs on filter paper to remove excess moisture and weigh them.
- For radioactive tracers, open the sac and collect the serosal fluid. Digest the sac tissue itself (e.g., in Soluene). Quantify the radioactivity in the serosal fluid and the tissue using a liquid scintillation counter.
- For non-radiometric methods, analyze glucose concentration in the serosal fluid and/or tissue homogenates via glucose oxidase assay or HPLC.
Data Calculation:
- Calculate the glucose uptake or transfer. A common metric is the Serosal-to-Mucosal (S/M) ratio of tracer concentration or the accumulated glucose per unit tissue weight per time.
- Key Interpretation: A high S/M ratio (>1) in the complete KRB condition indicates active transport. A significant reduction in this ratio in Na+-free buffer or with phloridzin confirms the involvement of SGLT1-mediated, Na+-dependent transport.
Application in Modern Research & Drug Discovery
The principles of Crane's hypothesis remain central to modern physiological and pharmacological research. The ex vivo jejunal sac protocol is a vital tool for:
- Investigating Transport Plasticity: Studies show that SGLT1 expression and function are dynamically regulated by factors such as fasting and diet, with robust glucose transport induction observed in the jejunum of fasted mice [2]. This model is ideal for studying such regulatory mechanisms.
- Evaluating Therapeutic Agents: The model is extensively used to screen and characterize compounds that modulate glucose absorption. For example, extracts from plants like Lannea edulis and Myrtle Berry Seeds have been shown to inhibit jejunal glucose absorption, revealing a potential mechanism for their anti-diabetic properties [5] [17].
- Validating Molecular Targets: The protocol provides a functional readout for genetically modified animal models (e.g., SGLT1 knockout mice) to confirm phenotypic changes in glucose absorption [16].
In drug discovery, the SGLT family, particularly SGLT2, has become a major therapeutic target. SGLT2 inhibitors (gliflozins) are now widely used to treat Type 2 Diabetes by blocking renal glucose reabsorption, promoting glucosuria, and lowering blood glucose levels [14]. The intestinal SGLT1 remains a target for managing postprandial hyperglycemia, with dual SGLT1/2 inhibitors under investigation [17] [14]. The ex vivo jejunal sac preparation serves as a primary screen for assessing the potency and specificity of novel SGLT1 inhibitors intended for such applications.
The jejunum, as the primary site for nutrient absorption in the small intestine, possesses a highly specialized mucosa characterized by projections of villi and invaginations of crypts. These structural features dramatically increase the intestinal surface area, facilitating efficient nutrient uptake. Villus height, crypt depth, and the resulting villus-to-crypt ratio (VCR) and villus surface area (VSA) are established morphological metrics that serve as indirect indicators of intestinal health and absorptive capacity [18] [19]. Within the context of ex vivo research using jejunal sacs, understanding these morphological parameters is paramount. They provide the anatomical context for interpreting functional data on glucose absorption rates. This application note details the standardized protocols for the morphometric assessment of jejunal morphology and integrates these measures with functional glucose absorption studies, providing a comprehensive toolkit for researchers in pharmacology and drug development.
Quantitative Morphometric Data
The following tables consolidate key morphometric parameters from recent studies, providing reference data on jejunal morphology under various physiological and experimental conditions.
Table 1: Jejunal Morphometric Parameters in Avian Models (Broilers)
| Parameter | Impact of Early Feeding (Day 7) | Impact of Late Feeding (Day 35) | Notes | Source |
|---|---|---|---|---|
| Villus Height (VH) | Increased | No significant difference | Greatest increase occurs in first week post-hatch | [18] |
| Crypt Depth (CD) | Initially increased | Decreased on D21 and D35 | Initial increase suggests higher cell turnover | [18] |
| Villus-to-Crypt Ratio (VCR) | No influence from D7 onward | No significant difference | Considered a key indicator of functional maturity | [18] |
| Villus Surface Area (VSA) | Significantly increased | Effects did not persist | Early nutrition has transient beneficial effect | [18] |
| Goblet Cell Number | No difference | No difference in jejunum | Ileum showed differences on D21 and D35 | [18] |
Table 2: Morphometric and Functional Correlations in Jejunal Studies
| Experimental Model | Morphological Change | Functional Correlation | Implication for Research | Source |
|---|---|---|---|---|
| Eimeria Challenge (Broilers) | ↑Villus Width, ↑Crypt Depth, ↓VH:CD, ↓VAS | Positively correlated with worse Feed Conversion Ratio (FCR) | A larger villus is not always related to better function; inflammation must be assessed. | [19] |
| Fasting vs. Feeding (Mice) | N/A | Glucose-induced current (Isc) suppressed in jejunum of fed mice; robust in fasted mice. | SGLT1-mediated absorption is segment-specific and highly regulated by nutritional status. | [2] |
| L. edulis Extract (Diabetic Rats) | N/A | Significantly decreased glucose absorption in everted rat jejunum. | Highlights how test compounds can directly modulate absorption independent of morphology. | [5] |
Experimental Protocols
Protocol 1: Standardized Histomorphometry of Jejunal Tissue
This protocol outlines the steps for processing and analyzing jejunal tissue to obtain quantitative morphometric data, essential for correlating structure with function in absorption studies.
Materials and Reagents:
- Phosphate-Buffered Saline (PBS), ice-cold
- 4% Paraformaldehyde (PFA) in PBS
- Ethanol series (70%, 95%, 100%)
- Paraffin embedding system
- Microtome
- Microscope slides
- Hematoxylin and Eosin (H&E) stain
- Light microscope with digital camera and image analysis software (e.g., NIS-Elements, ImageJ)
Procedure:
- Tissue Collection and Fixation: Immediately after euthanasia, excise a defined segment of the jejunum (e.g., 2 cm in length). Flush the lumen gently with ice-cold PBS to remove contents. Open the tissue longitudinally and immerse in 4% PFA for 24 hours at 4°C.
- Tissue Processing and Sectioning: Dehydrate the fixed tissue through a graded series of ethanol, clear with xylene or a non-polar solvent, and embed in paraffin [20]. Section the paraffin-embedded blocks at a thickness of 4–5 µm using a microtome [18] [20].
- Staining: Mount sections on slides and perform standard H&E staining to differentiate the villi, crypts, and underlying tissue layers [18].
- Image Acquisition and Morphometric Analysis: Examine slides under a light microscope. Capture digital images of intact, vertically oriented villi. For each sample, measure at least 10 well-oriented villi and crypts [21].
- Villus Height (VH): Measure from the villus tip to the villus-crypt junction.
- Crypt Depth (CD): Measure from the villus-crypt junction to the base of the crypt.
- Villus Width (VW): Measure at the base or midpoint of the villus.
- Calculate: Villus Surface Area (VSA) and Villus-to-Crypt Ratio (VCR) [18].
Protocol 2: Functional Glucose Absorption Using Everted Jejunal Sacs
This protocol describes the classic everted gut sac technique, an ex vivo model for directly measuring intestinal absorption kinetics, which can be correlated with morphometric data from the same tissue source.
Materials and Reagents:
- Krebs-Ringer Bicarbonate (KRB) buffer, oxygenated (95% O₂ / 5% CO₂)
- Glucose transport solution (e.g., KRB with specific glucose concentration)
- Aqueous plant extracts or compounds for testing (e.g., Lannea edulis extract [5])
- Surgical instruments (fine scissors, forceps)
- Water bath maintained at 37°C
- Oxygenation system (carbogen gas)
- Silicone tubing or butterfly needles
Procedure:
- Tissue Preparation: Euthanize the animal and rapidly expose the abdominal cavity. Identify and excise the entire small intestine. Flush with ice-cold, oxygenated KRB buffer. Gently evert the jejunal segment over a glass rod or silicone tubing.
- Sac Preparation and Incubation: Cut the everted jejunum into segments of 3–4 cm in length. Tie off one end of each segment, fill it with a known volume (e.g., 0.5 mL) of serosal fluid (glucose-free KRB), and tie off the other end to create a sealed sac [5]. Weigh the sac to determine tare weight.
- Experimental Incubation: Immerse each sac in a separate flask containing 50 mL of mucosal solution (oxygenated KRB buffer with glucose and/or test compounds) in a 37°C water bath with continuous oxygenation [5].
- Sample Collection and Analysis: At defined time points (e.g., 30, 60, 90 minutes), remove the sacs, gently blot, and re-weigh. Carefully puncture the sac and collect the serosal fluid. Analyze the serosal fluid for glucose concentration using a glucose assay kit or HPLC. Calculate the rate of glucose transport.
The Scientist's Toolkit: Essential Research Reagents
Table 3: Key Reagents for Jejunal Morphology and Absorption Studies
| Reagent / Solution | Function in Experiment | Application Context |
|---|---|---|
| Hematoxylin & Eosin (H&E) | General histological staining to visualize tissue architecture, villi, and crypts. | Standard morphometric analysis [18]. |
| 4% Paraformaldehyde (PFA) | Cross-linking fixative that preserves tissue morphology for histology. | Tissue fixation prior to embedding and sectioning [21]. |
| Krebs-Ringer Bicarbonate (KRB) Buffer | Physiological salt solution providing ionic and pH balance for ex vivo tissue viability. | Main buffer for everted gut sac and Ussing chamber experiments [5] [2]. |
| SGLT1 Inhibitors (e.g., Phloridzin) | Specific, high-affinity competitive inhibitor of the Sodium-Glucose Transporter 1 (SGLT1). | To confirm and quantify the active, carrier-mediated component of glucose absorption [2]. |
| L. edulis Aqueous Extract | Plant extract demonstrated to reduce intestinal glucose absorption. | Used as an example interventional compound to modulate absorption function [5]. |
| 3D Tissue Clearing Reagents (CUBIC) | Renders intact tissues transparent for deep imaging. | Enables 3D reconstruction of intestinal villi and crypts beyond traditional 2D histology [21]. |
Integrated Experimental Workflow
The diagram below illustrates the logical workflow connecting jejunal tissue preparation, parallel morphological and functional analyses, and integrated data interpretation.
The integration of detailed jejunal morphometry with robust functional assays like the everted gut sac technique provides a powerful approach for evaluating nutrient absorption mechanisms. As demonstrated, morphological data on villus structure must be interpreted with caution, as increases in size do not always correlate with improved function, particularly under inflammatory conditions [19]. Furthermore, functional absorption is dynamically regulated by factors such as nutritional status, which can dictate transporter activity independent of structural changes [2]. The standardized protocols and reference data provided herein offer a framework for researchers in drug discovery and development to systematically investigate how new chemical entities, biologics, or natural extracts influence intestinal health and function, thereby strengthening the predictive power of ex vivo models.
The choice of animal model is a fundamental consideration in gastrointestinal research, profoundly influencing the translational value of experimental data on nutrient absorption. Ex vivo studies using jejunal sacs provide a powerful tool for investigating intestinal glucose transport mechanisms while preserving native tissue architecture and cellular polarity. However, interspecies variations in anatomy, transporter expression, and regulatory physiology can significantly impact research outcomes. This application note examines the key similarities and differences between murine, avian, and human intestinal models to inform experimental design and data interpretation in glucose absorption studies. Understanding these species-specific characteristics is essential for researchers and drug development professionals aiming to extrapolate findings from preclinical models to human physiology and disease states, particularly in the context of metabolic disorders and therapeutic development.
Comparative Physiology of Intestinal Glucose Absorption
Fundamental Transport Mechanisms
Glucose absorption across the intestinal epithelium occurs through multiple coordinated pathways, with significant species-specific variations in their relative contributions:
Active Transcellular Transport: The sodium-glucose cotransporter 1 (SGLT1) located in the apical membrane of enterocytes mediates active glucose uptake against its concentration gradient, utilizing the sodium electrochemical gradient maintained by Na+/K+ ATPase [22] [2]. This secondary active transport is complemented by facilitated diffusion via GLUT2 transporters at the basolateral membrane [22].
Paracellular Passive Transport: Passive glucose diffusion through tight junctions between epithelial cells contributes significantly to total absorption, particularly at high luminal glucose concentrations [22]. Research using vascularly perfused rat intestine demonstrates that approximately 30% of glucose absorption persists even after combined SGLT1 and GLUT2 blockade, indicating a substantial paracellular component [22].
Adaptive Regulation: Intestinal glucose transport exhibits dynamic regulation in response to nutritional status. Fasting robustly enhances SGLT1-mediated glucose absorption in the mouse jejunum, while feeding suppresses it, demonstrating segment-specific adaptation mechanisms for efficient glucose handling [2].
Species-Specific Comparison of Jejunal Glucose Handling
Table 1: Comparative Glucose Absorption Characteristics Across Species
| Characteristic | Mouse Models | Avian Models (Chick) | Human |
|---|---|---|---|
| Primary Absorption Site | Jejunum > Ileum [2] | Jejunum (embryonic development studied) [23] | Jejunum > Ileum [24] |
| SGLT1 Expression Pattern | Fasting increases jejunal expression [2] | Thyroxine and hydrocortisone influence developmental appearance [23] | Highest in proximal jejunum [24] |
| Paracellular Contribution | Significant, especially in proximal intestine [22] | Limited data available | Present, quantitative significance debated |
| Regional Specificity | Strong functional differentiation along duodenal-ileal axis [2] | Limited data available | Marked jejunal-ileal differences [24] |
| Dipeptide Transport | Not applicable | Not applicable | Comparable jejunal and ileal absorption [24] |
| Regulatory Pathways | FFA1/GPR40 mediated inhibition [25] | Limited data available | Complex endocrine regulation |
Table 2: Functional Differences in Jejunal versus Ileal Absorption in Humans
| Absorbed Compound | Jejunal Absorption | Ileal Absorption |
|---|---|---|
| Glucose | Faster absorption [24] | Slower absorption [24] |
| Glycine | Faster absorption [24] | Slower absorption [24] |
| L-alanine | Faster absorption (5 of 6 subjects) [24] | Slower absorption |
| Glycyl-L-alanine (dipeptide) | Comparable absorption rate [24] | Comparable absorption rate [24] |
Experimental Models and Methodologies
Murine Models: Workhorses of Intestinal Glucose Research
Murine models offer significant advantages for intestinal glucose absorption studies, including genetic tractability, relatively low maintenance costs, and well-characterized physiology. Several key methodological approaches have been developed:
Everted Jejunal Sac Protocol: This classic technique involves inverting intestinal segments to directly expose the mucosal epithelium to experimental solutions, allowing precise measurement of nutrient transport. The method preserves native epithelial structure and transporter localization while enabling controlled experimental conditions [25].
Vascularly Perfused Intestine Preparation: This sophisticated approach maintains intestinal viability by perfusing the vascular bed, preserving the tissue's polar organization and complete transport pathways from lumen to circulation. Studies using this method have demonstrated non-saturable glucose absorption components even at high luminal concentrations (up to 1100 mmol/L), suggesting significant diffusive transport mechanisms [22].
Ussing Chamber Measurements: This technique enables precise electrophysiological assessment of electrogenic transport processes by measuring glucose-induced short-circuit current (Isc) across mounted intestinal mucosa. Research using Ussing chambers has revealed that SGLT1-mediated glucose absorption is minimal in the jejunum of ad libitum-fed mice but robustly enhanced after 24-48 hours of fasting [2].
Avian Models: Insights from Embryonic Development
Avian models, particularly chick embryos, provide unique opportunities for studying the developmental aspects of intestinal glucose transport:
Hormonal Regulation of Transport Development: Embryonic chick intestine demonstrates that thyroxine and hydrocortisone significantly influence the developmental appearance of glucose active transport capabilities, providing insights into the endocrine regulation of intestinal maturation [23].
Epidermal Growth Factor (EGF) Effects: Studies in avian models and mice have shown that EGF enhances jejunal glucose absorption, suggesting conserved regulatory mechanisms across species [23].
Human Tissue: The Gold Standard for Translation
Human intestinal tissue remains the reference standard for validating findings from animal models, though access is limited:
Regional Functional Specialization: Perfusion studies in human subjects confirm that glucose absorption occurs more rapidly in the jejunum than ileum, highlighting important regional specialization [24].
Dipeptide Transport Significance: Unlike amino acid and glucose absorption, dipeptide transport demonstrates comparable rates between jejunum and ileum in humans, emphasizing the importance of oligopeptide transport pathways, particularly in the distal intestine [24].
Detailed Experimental Protocols
Everted Jejunal Sac Preparation for Glucose Uptake Studies
Principle: This ex vivo technique measures radiolabeled glucose analog uptake by intestinal tissue, preserving mucosal architecture and transporter function while enabling controlled pharmacological manipulation.
Reagents Required:
- Krebs-Ringer bicarbonate buffer (pH 7.4)
- Oxygen gas mixture (95% O2/5% CO2)
- 3-O-methyl-glucose [3H] (3-OMG) or 14C-d-glucose
- Pharmacological agents of interest (e.g., phlorizin, delphinidin, receptor antagonists)
- Scintillation cocktail for radioactivity measurement
Procedure:
- Euthanize the animal according to approved ethical guidelines and immediately expose the abdominal cavity.
- Gently excise the entire small intestine and place it in oxygenated ice-cold Krebs-Ringer buffer.
- Identify the jejunal segment (typically 10-15 cm distal to the ligament of Treitz in humans or corresponding region in rodents).
- Gently flush the lumen with cold buffer to remove intestinal contents.
- Evert the jejunal segment carefully over a glass rod or using fine forceps, exposing the mucosal surface outward.
- Cut the everted intestine into 2-3 cm segments and tie off one end of each segment.
- Fill the sacs with oxygenated buffer containing appropriate experimental treatments.
- Tie off the opposite end to create closed sacs containing the serosal solution.
- Incubate sacs in oxygenated buffer containing radiolabeled glucose analogs (e.g., 3-OMG or 14C-d-glucose) at 37°C with continuous oxygenation.
- Maintain appropriate controls, including phlorizin (1 mM) as an SGLT1 inhibitor control.
- After designated time points (typically 5-15 minutes), remove sacs and rapidly rinse in ice-cold buffer to stop transport.
- Digest tissue or extract solutes to measure accumulated radioactivity by scintillation counting.
- Normalize glucose uptake to tissue protein content or dry weight.
Applications: This protocol is ideal for investigating transporter kinetics, pharmacological inhibition (e.g., delphinidin effect via FFA1 [25]), and comparative absorption between intestinal regions or experimental conditions.
Vascularly Perfused Rat Intestine Model
Principle: This advanced preparation maintains intestinal viability by perfusing the vascular bed, enabling study of complete transport pathways from lumen to circulation and their relationship with endocrine secretion [22].
Procedure:
- Anesthetize the animal and cannulate the superior mesenteric artery and vein.
- Gently isolate an intestinal segment while preserving vascular connections.
- Perfuse the vascular bed with oxygenated physiological solution containing appropriate substrates.
- Introduce glucose solutions into the luminal compartment.
- Measure glucose appearance in the venous effluent using radioactive tracers (14C-d-glucose) or sensitive glucose assays.
- Apply specific transporter inhibitors (phlorizin for SGLT1, phloretin for GLUT2) to determine relative contributions of different pathways.
- Calculate absorption rates from arteriovenous concentration differences and flow rates.
Key Findings Using This Model:
- Glucose absorption involves both SGLT1/GLUT2-mediated transport and a significant paracellular component (~30% of total absorption) [22].
- Paracellular glucose absorption is greater in proximal than distal small intestine [22].
- SGLT1 blockade unexpectedly enhances paracellular mannitol absorption, suggesting transporter interactions with junctional permeability [22].
Signaling Pathways in Intestinal Glucose Absorption
Free Fatty Acid Receptor 1 (FFA1/GPR40) Signaling
Research has identified a novel signaling pathway through which the anthocyanidin delphinidin modulates intestinal glucose absorption:
- Receptor Activation: Delphinidin binds to and activates FFA1 receptors on intestinal epithelial cells, as demonstrated in HT-29 and Caco-2 cell lines [25].
- Calcium Signaling: FFA1 activation triggers phospholipase C-mediated IP3 production, leading to calcium release from intracellular stores followed by store-operated calcium entry [25].
- Transport Modulation: The resulting increased intracellular calcium concentration inhibits SGLT1-mediated glucose transport, reducing jejunal glucose absorption in mice [25].
- Physiological Significance: This pathway represents a local mechanism for regulating intestinal glucose absorption independent of incretin hormones, potentially contributing to the antidiabetic effects of anthocyanin-rich foods.
Research Reagent Solutions
Table 3: Essential Reagents for Intestinal Glucose Absorption Studies
| Reagent/Category | Specific Examples | Research Application | Key Considerations |
|---|---|---|---|
| Transport Inhibitors | Phlorizin (1 mM) [22] [25] | Selective SGLT1 inhibition | Distinguishes active vs. passive transport components |
| Phloretin (1 mM) [22] | GLUT2 blockade | Assesses basolateral transport contribution | |
| FFA1/GPR40 Modulators | Delphinidin (100 μM) [25] | Natural FFA1 agonist | Inhibits glucose uptake via calcium signaling |
| TAK-875 [25] | Synthetic FFA1 agonist | Positive control for receptor activation | |
| DC260126, GW1100 (10 μM) [25] | FFA1 antagonists | Confirms receptor-specific effects | |
| Signaling Modulators | BAPTA-AM (50 μM) [25] | Intracellular calcium chelation | Tests calcium dependence |
| LY294002 (10 μM) [25] | PI3K pathway inhibition | Assesses kinase involvement | |
| Cell Line Models | Caco-2 cells [26] [25] | Human intestinal epithelial model | Expresses FFA1, useful for mechanistic studies |
| HT-29 cells [25] | Human enterocytic line | Shows calcium response to delphinidin | |
| Radiolabeled Tracers | 14C-d-glucose [22] | Glucose absorption quantification | Sensitive detection in vascular perfused models |
| 3-O-methyl-glucose [3H] [25] | Non-metabolizable glucose analog | Measures transport independent of metabolism |
Species-specific differences in intestinal glucose absorption mechanisms present both challenges and opportunities for research design. Murine models offer experimental tractability but demonstrate important distinctions in transporter regulation and paracellular contribution. Avian models provide unique insights into developmental aspects of transport function. Human tissue remains the reference standard but has limited availability. The emerging understanding of local regulatory pathways, such as FFA1-mediated modulation of glucose absorption, highlights the complexity of intestinal nutrient sensing and transport regulation. Researchers should carefully consider these species-specific characteristics when designing experiments and extrapolating findings across models, particularly in the context of drug development and therapeutic targeting of intestinal glucose handling mechanisms.
Mastering the Protocol: A Step-by-Step Guide to the Everted Sac Technique
Application Notes and Protocol for Ex Vivo Glucose Absorption Studies
Within investigations of intestinal glucose absorption mechanisms for drug development and metabolic research, the everted jejunal sac model serves as a fundamental ex vivo technique. This protocol details the precise preparation of viable jejunal segments, a critical prerequisite for reliable measurement of nutrient transporter function and the evaluation of compounds targeting conditions like diabetes and metabolic syndrome [27] [17]. Proper execution of the euthanasia, dissection, and eversion procedures is essential for preserving tissue integrity and ensuring the physiological relevance of subsequent functional analyses.
Materials and Reagents
Table 1: Essential Research Reagents and Solutions
| Item Name | Function/Brief Explanation |
|---|---|
| Isoflurane | Anesthetic for inducing and maintaining surgical-plane anesthesia prior to euthanasia [28]. |
| Oxygen (O₂) | Carrier gas for isoflurane during anesthesia; ensures tissue oxygenation until excision [28]. |
| Phosphate-Buffered Saline (PBS), ice-cold | Isotonic solution used to flush intestinal lumen post-excision, removing contents and cooling the tissue to slow metabolism [28]. |
| Krebs-Ringer Bicarbonate (KRB) Buffer | Oxygenated physiological salt solution used to maintain tissue viability, provide nutrients, and serve as the medium for glucose transport assays [27]. |
| 95% O₂ / 5% CO₂ Gas Mixture | Used to carbogenate KRB buffer, maintaining physiological pH (7.4) and providing oxygen for tissue respiration during ex vivo experiments [2]. |
| SGLT1 Inhibitors (e.g., Phlorizin) | Specific pharmacological tool to confirm sodium-dependent glucose transport activity (SGLT1-mediated) in the prepared tissue [27]. |
Step-by-Step Experimental Protocol
Animal Euthanasia and Small Intestine Excision
- Anesthesia: Place the animal (e.g., mouse or rat) in an induction chamber and anesthetize using 5% isoflurane delivered in oxygen [28]. Confirm deep anesthesia by the absence of pedal reflex.
- Terminal Procedure: While under sustained anesthesia, perform exsanguination via transcardial perfusion or direct puncture of a major vessel such as the abdominal aorta. This method is consistent with protocols approved by animal ethics committees for terminal tissue collection [28].
- Laparotomy: Immediately after confirming cessation of circulation, perform a midline laparotomy to expose the abdominal cavity.
- Intestinal Localization and Excision: Identify the stomach and the small intestine. Locate the pyloric sphincter (stomach-duodenum junction) and the ileocecal valve (small intestine-colon junction).
Dissection and Preparation of Jejunal Segments
- Tissue Handling: Place the excised small intestine into a petri dish filled with ice-cold PBS to minimize metabolic degradation.
- Lumen Flushing: Using a syringe filled with ice-cold PBS and attached to a blunt-ended needle, gently flush the lumen of the intestine to clear all digestive contents [28].
- Jejunal Segment Identification: Lay the intestine on a chilled, silicone-coated dissection dish. The jejunum is typically defined as the segment starting approximately 10-11 cm distally from the pyloric sphincter in mice [28].
- Segment Resection: Using fine dissection scissors, resect a segment of the proximal jejunum of the desired length (e.g., 1 cm to 4 cm, depending on the specific assay requirements) [27] [2].
Eversion of Jejunal Segments
- Segment Trimming: Gently blot the resected jejunal segment on moist filter paper. Trim any residual mesentery carefully to avoid damaging the intestinal wall.
- Cannulation and Securing: Slide a slender, blunt-ended rod (e.g., a thin glass rod or a polished metal probe) into the lumen of the segment. Secure one end of the segment very gently to the rod using a pre-placed silk suture.
- Eversion Procedure: Holding the free end of the suture, carefully and slowly pull the intestinal segment over the rod, turning it inside-out. This process exposes the mucosal epithelium to the external incubation medium.
- Sac Preparation (Optional): For the everted sac technique, slide the everted segment off the rod. Tie one end securely with a suture. Fill the resulting sac with a small volume (e.g., 0.3 ml) of oxygenated KRB buffer using a syringe with a fine needle [27]. Finally, tie off the other end to create a closed, fluid-filled sac ready for incubation.
Key Experimental Parameters and Data
Table 2: Quantitative Anatomical and Functional Benchmarks for Murine Jejunum
| Parameter | Value in Non-Pregnant / Control State | Value in Late-Pregnant State (GD17.5) | Notes / Method of Measurement |
|---|---|---|---|
| Total SI Weight | Baseline | ~20% heavier [28] | Weighed immediately post-excision. |
| Total SI Length | Baseline | ~10% longer [28] | Measured under slight tension on chilled surface. |
| Jejunal Villi Length | Baseline | ~18% longer [28] | Fixed tissue, histological sectioning and measurement. |
| Active Glucose Transport (Isc) | Present | Similar per unit area [28] | Measured in Ussing chamber; indicates functional capacity. |
| SGLT1 Expression | Variable by region | Increased in some regions (e.g., duodenum) [28] | Western blot of Brush Border Membrane Vesicles (BBMV) [2]. |
Workflow and Functional Validation
The following diagram illustrates the complete journey of the jejunal tissue from the animal to functional analysis, highlighting key validation steps.
Figure 1: Workflow for Jejunal Segment Preparation and Validation.
Troubleshooting and Critical Steps
- Tissue Viability: The entire process from euthanasia to placing the tissue in oxygenated buffer should be completed as rapidly as possible. Prolonged ischemia or rough mechanical handling will compromise cellular function and transporter activity.
- Eversion Technique: The eversion step is mechanically stressful. Use fine, smooth tools and perform the inversion gently and steadily. Applying excessive force can damage the epithelial layer, leading to leaky sacs and non-physiological results.
- Functional Validation: Always include control and reference samples. The functionality of the prepared sacs should be confirmed by demonstrating a significant inhibition of glucose absorption in the presence of a specific SGLT1 inhibitor like phlorizin [27]. Furthermore, consistent with findings on intestinal plasticity, researchers should account for physiological states (e.g., pregnancy, fasting) that inherently alter jejunal anatomy and molecular transporter profiles [28] [2].
In ex vivo glucose absorption measurement using jejunal sacs, the composition of the buffer solution is not merely a background medium but a critical experimental variable that directly influences physiological relevance and data reliability. The ionic environment maintains tissue viability, regulates transporter activity, and preserves mucosal integrity during experimentation. Proper buffer composition ensures that the measured glucose absorption accurately reflects in vivo physiological processes rather than artifacts of experimental conditions. This application note provides a comprehensive framework for optimizing buffer systems specifically for jejunal sac experiments, incorporating recent advances in intestinal physiology and absorption methodology.
The jejunal sac model, a well-established preparation for studying intestinal transport, involves isolating segments of the jejunum, filling them with oxygenated buffer solutions containing compounds of interest, and measuring transmural transport. The success of this technique hinges on maintaining the functional and structural integrity of the intestinal epithelium throughout the experimental timeframe, a requirement fundamentally dependent on the buffer's ionic composition, oxygenation, and physicochemical properties.
Fundamental Buffer Compositions for Jejunal Sac Experiments
Standard Physiological Buffer Formulations
The choice of buffer system significantly impacts experimental outcomes, particularly for compounds whose solubility and permeability are pH-dependent. Research demonstrates that buffer composition can cause sixfold variations in drug solubility and notable differences in effective permeability coefficients (P~app~) [29]. The following table summarizes standard physiological buffer formulations used in intestinal absorption studies:
Table 1: Composition of Standard Physiological Buffers for Intestinal Research
| Component | Krebs-Ringer Buffer (KRB) | Krebs-Henseleit Buffer | Hanks' Balanced Salt Solution (HBSS) | Phosphate Buffered Saline (PBS) |
|---|---|---|---|---|
| Sodium Chloride (NaCl) | 118 mM | 118 mM | 137 mM | 137 mM |
| Potassium Chloride (KCl) | 4.7 mM | 4.7 mM | 5.4 mM | 2.7 mM |
| Calcium Chloride (CaCl₂) | 2.5 mM | 2.5 mM | 1.3 mM | - |
| Magnesium Sulfate (MgSO₄) | 1.2 mM | 1.2 mM | 0.8 mM | - |
| Sodium Phosphate (NaH₂PO₄/Na₂HPO₄) | 1.2 mM | 1.2 mM | 0.34 mM Na₂HPO₄ | 10 mM |
| Sodium Bicarbonate (NaHCO₃) | 25 mM | 25 mM | 4.2 mM | - |
| D-Glucose | 11 mM | 11 mM | 5.6 mM | - |
| Other Key Components | - | - | 0.44 mM KH₂PO₄ | - |
| Typical pH Range | 7.3-7.4 | 7.3-7.4 | 7.2-7.4 | 7.2-7.4 |
| Oxygenation Requirement | 95% O₂ / 5% CO₂ | 95% O₂ / 5% CO₂ | Air/CO₂ mixture | Air equilibrium |
Krebs-Ringer Buffer (KRB) is particularly well-suited for jejunal sac experiments investigating glucose absorption [27]. Its high bicarbonate concentration requires continuous carbogenation (95% O₂ / 5% CO₂) to maintain physiological pH, which simultaneously ensures optimal oxygen delivery to the tissue. The presence of divalent cations (Ca²⁺, Mg²⁺) is essential for maintaining tight junction integrity, thereby controlling paracellular transport and ensuring that glucose absorption occurs primarily via the transcellular pathway.
Impact of Buffer Composition on Solute Properties
The ionic composition, pH, and buffer capacity directly influence the solubility and permeability of test compounds, which must be considered when designing experiments. A comparative study of ibuprofen demonstrated that its saturated solubility varied sixfold across eight common physiological buffers, from a low in HBSS to a high in PBS at pH 7.4 [29]. These differences were primarily attributed to final pH variations upon drug saturation and the presence of solubilizing components. Notably, Fed State Simulated Intestinal Fluid (FeSSIF), which contains bile salts and lipids, significantly enhanced solubility due to micellar solubilization, while the presence of divalent ions in Krebs buffer reduced the solubility of some anionic compounds.
Permeability results can also be buffer-dependent. The effective permeability coefficient (P~app~) of ibuprofen was significantly higher in PBS and FaSSIF compared to citrate and HBSS buffers, highlighting that buffer selection can directly influence absorption measurements [29]. Therefore, reporting exact buffer composition is crucial for reproducing experimental findings.
Advanced Optimization: Ionic and Oxygenation Parameters
Optimizing the Ionic Environment for Glucose Transport Studies
Glucose absorption in the jejunum occurs primarily via the coordinated action of the apical sodium-glucose cotransporter 1 (SGLT1) and the basolateral glucose transporter 2 (GLUT2). The ionic environment of the buffer directly powers this process.
- Sodium Dependence: SGLT1 is a secondary active transporter that couples glucose transport with sodium ions moving down their electrochemical gradient. The typical Na⁺ concentration in KRB (∼138 mM) maintains this critical gradient. Reduction of sodium concentration directly diminishes active glucose uptake.
- Energy Substrate: Including 11 mM D-glucose in the buffer provides an energy substrate for the tissue, helping to maintain viability during the experiment. However, for tracer studies, this may be replaced with mannitol for osmotic balance.
- Divalent Cations: Calcium (2.5 mM) and magnesium (1.2 mM) are essential for preserving tight junction integrity and cellular signaling. Their omission can increase paracellular permeability, potentially confounding glucose absorption measurements.
Recent research on dietary proteins highlights the dynamic regulation of intestinal glucose transport. Digested proteins from casein, fish gelatin, and other sources have been shown to acutely reduce glucose uptake and GLUT2 mRNA expression in enterocytes [27]. This suggests that buffer composition could be modified to investigate specific regulatory mechanisms by including protein hydrolysates or specific amino acids.
Oxygenation Strategies for Tissue Viability
The high metabolic rate of intestinal epithelium demands adequate oxygen delivery to maintain ATP-dependent processes, including active transport and cellular homeostasis.
Diagram 1: Oxygenation impact on glucose absorption.
For jejunal sac experiments, continuous oxygenation with carbogen (95% O₂ / 5% CO₂) is the gold standard [27]. The 5% CO₂ is essential for maintaining the bicarbonate buffer system at physiological pH (7.3-7.4). In experiments where bicarbonate-free buffers (e.g., PBS, HEPES) are used, alternative pH stabilization methods are available, but these systems lack the physiological buffering characteristics of the bicarbonate-CO₂ system.
It is important to distinguish this tissue-level oxygenation from systemic hyperoxia, which has been shown to disrupt gut microbiota ecology by increasing luminal oxygen availability and promoting facultative anaerobe overgrowth [30]. In ex vivo preparations, maximizing oxygen delivery to the intestinal tissue itself is paramount for maintaining viability, as the vascular system is no longer functional.
Detailed Experimental Protocol: Glucose Absorption Using Jejunal Sacs
Jejunal Sac Preparation and Installation
This protocol outlines the optimized procedure for measuring ex vivo glucose absorption using rodent jejunal sacs, based on established methodologies with critical modifications for enhanced reliability [27].
Table 2: Reagent Solutions for Jejunal Sac Experiments
| Reagent/Solution | Composition/Specification | Primary Function | Notes/Critical Parameters |
|---|---|---|---|
| Krebs-Ringer Buffer (KRB) | As in Table 1 | Physiological maintenance medium | Must be freshly prepared; gas with carbogen for ≥20 min before use |
| Carbogen Gas | 95% O₂, 5% CO₂ | Tissue oxygenation & pH maintenance | Use medical grade; bubble continuously at low flow rate |
| D-Glucose | 10-100 mM in KRB | Absorption substrate | Concentration depends on study goals (kinetics vs. capacity) |
| Radioisotopic Tracer | ³H- or ¹⁴C-labeled glucose | Transport quantification | Follow radiation safety protocols; use minimal necessary activity |
| Anaesthetic | Isoflurane or sodium pentobarbital | Humane euthanasia | Institutionally approved protocol required |
| Antioxidant Cocktail | N-acetylcysteine (1-5 mM) | Reduction of oxidative stress | Optional for prolonged experiments |
Step 1: Animal Preparation and Tissue Harvest
- Anesthetize adult Wistar rats (200-250 g) using an institutionally approved anesthetic (e.g., isoflurane, 5% in oxygen) [28] [27].
- Following deep anesthesia, perform a midline laparotomy to access the abdominal cavity.
- Identify the proximal jejunum (starting approximately 5 cm distal to the ligament of Treitz) and carefully dissect a segment of 10-15 cm in length.
- Excise the segment and immediately place it in ice-cold, pre-oxygenated KRB to slow metabolic activity and prevent ischemic damage.
- Gently flush the luminal contents with cold KRB using a blunt-ended syringe to remove residual digesta without damaging the mucosal surface.
Step 2: Sac Preparation and Installation
- Divide the cleaned jejunal segment into individual sacs of 1 cm length using sharp surgical scissors [27].
- Carefully tie off one end of each sac with surgical silk (4-0).
- Using a fine-tipped pipette or syringe, fill each sac with 0.3 mL of oxygenated KRB containing the experimental treatment (e.g., glucose, inhibitors, protein digests) and the isotopic tracer (³H- or ¹⁴C-labeled glucose, 0.02 μCi/mL) [27].
- Tie off the proximal end to create a sealed sac. Ensure the sac is taut but not over-distended to avoid compromising blood flow to the mucosa.
- Weigh each filled sac to determine the initial mass.
Step 3: Incubation and Sampling
- Individually place sacs in 50 mL Erlenmeyer flasks containing 20 mL of oxygenated KRB (serosal buffer).
- Maintain the flasks in a water bath at 37°C with continuous carbogen gassing throughout the incubation period.
- Gently agitate the flasks using an orbital shaker (60-80 oscillations/minute) to ensure adequate mixing and minimize unstirred water layers.
- Following a standard incubation period (typically 60-120 minutes), remove the sacs and carefully blot them on absorbent paper.
- Weigh the sacs to determine final mass.
- Sacrifice the tissue by cutting both ends and collect the serosal fluid for analysis.
- Sac content can be recovered by puncturing the sac or washing the lumen with a known volume of buffer.
Analytical Methods and Data Calculation
Glucose Absorption Quantification:
- Measure the radioactivity in both the initial dosing solution and the collected serosal fluid using liquid scintillation counting.
- Calculate the apparent permeability coefficient (P~app~) using the following equation:
P~app~ = (dQ/dt) / (A × C₀)
where dQ/dt is the transport rate (mol/s), A is the nominal surface area of the sac (cm²), and C₀ is the initial concentration in the donor compartment (mol/mL) [29].
- Alternatively, express results as cumulative glucose transport (μmol/cm tissue/h) or percentage of dose transported.
Viability Assessment:
- Monitor tissue viability throughout the experiment by visual inspection (maintenance of pink color, absence of edema or discoloration).
- Confirm viability post-experiment by measuring lactate dehydrogenase (LDH) release into the serosal buffer or using histological examination of fixed tissue samples (e.g., H&E staining).
Diagram 2: Jejunal sac experiment workflow.
Troubleshooting and Technical Considerations
Common Experimental Challenges and Solutions
Table 3: Troubleshooting Guide for Jejunal Sac Experiments
| Problem | Potential Causes | Recommended Solutions |
|---|---|---|
| Low Glucose Transport | Tissue non-viability, insufficient oxygenation, incorrect buffer pH, incorrect sodium concentration | Verify carbogen delivery, check pH (7.3-7.4), confirm Na⁺ concentration (~138 mM), include positive control |
| High Variability Between Sacs | Inconsistent sac preparation, regional differences along jejunum, uneven oxygenation | Use consistent sac length (1 cm), take adjacent sacs for replicates, ensure uniform gas bubbling |
| Poor Tissue Viability | Prolonged ischemia during dissection, bacterial contamination, excessive stretching | Minimize dissection time (<5 min), use ice-cold buffer during setup, include antibiotics in buffer |
| Buffer pH Drift | Inadequate CO₂ gassing, bacterial growth, outdated buffer components | Ensure tight seals on incubation vessels, use fresh buffer daily, check CO₂ concentration (5%) |
| Low Signal in Tracer Studies | Insufficient radioactive tracer, quenching in scintillation counting, tracer instability | Validate tracer concentration, use appropriate scintillation cocktail, confirm tracer purity |
Methodological Variations and Applications
The basic jejunal sac protocol can be modified to address specific research questions:
- Inhibitor Studies: To investigate specific transport pathways, include pharmacological inhibitors in the buffer. For example, phlorizin (0.1-1 mM) can be used to specifically inhibit SGLT1-mediated glucose transport [27].
- Protein Digest Co-incubation: As evidenced by recent research, digested dietary proteins (e.g., casein, fish gelatin at 5 mg/mL) can be included to study their acute effects on glucose transport and transporter expression [27].
- Mucosal vs. Serosal Sampling: While the standard protocol measures serosal-to-mucosal transport, the direction can be reversed to study secretory processes or basolateral transport mechanisms.
- Ussing Chamber Integration: For more detailed electrophysiological measurements, the jejunal sac preparation can be adapted to the Ussing chamber technique, allowing for simultaneous measurement of short-circuit current and transepithelial resistance [31].
Optimizing buffer composition and oxygenation parameters is fundamental to obtaining physiologically relevant data from ex vivo jejunal sac experiments. The ionic environment must faithfully replicate key physiological conditions—particularly sodium concentration for SGLT1-mediated glucose transport—while maintaining tissue viability through continuous carbogen gassing. The standard Krebs-Ringer bicarbonate buffer remains the gold standard for such studies, though researchers should be aware of how specific modifications (divalent cations, pH, buffer capacity) can influence experimental outcomes.
As research advances, particularly in understanding how dietary components like protein hydrolysates regulate glucose absorption, the jejunal sac model—when coupled with precisely optimized buffer systems—continues to offer valuable insights into intestinal transport mechanisms with direct relevance to drug development and nutritional science.
The everted jejunal sac model is a classical ex vivo technique used to investigate the mechanisms and kinetics of intestinal nutrient absorption, particularly for sugars like glucose. The model involves inverting a segment of the jejunum, so that the mucosal epithelium faces outward into the incubation solution, and the serosal surface faces the inner fluid-filled sac. This configuration allows for the direct study of transepithelial transport from the mucosal solution to the serosal compartment [32] [33].
The primary mechanism for glucose absorption in the small intestine is active transport mediated by the Na+/Glucose cotransporter 1 (SGLT1) located on the apical membrane of enterocytes. The driving force for this transport is the sodium gradient established by the basolateral Na+/K+ ATPase pump [32]. The everted sac model is ideally suited to study this saturable, active process, as well as to investigate the effects of pharmaceuticals, plant extracts, or dietary compounds on glucose absorption capacity [5] [27]. By measuring the accumulation of glucose or its analogs in the serosal fluid over time, researchers can quantify absorption rates and elucidate transport pathways.
Materials and Reagents
Research Reagent Solutions
The following table details the essential reagents and materials required for the everted jejunal sac experiment.
Table 1: Key Research Reagents and Their Functions in the Everted Sac Assay
| Reagent/Material | Function/Application | Example from Literature |
|---|---|---|
| Krebs-Ringer Bicarbonate (KRB) Buffer | A physiological salt solution providing ions (Na+, K+, Ca2+, Mg2+, Cl-, HCO3-) to maintain tissue viability and electrophysiological function [27]. | Used as the standard incubation medium in ex vivo glucose absorption experiments with rat jejunal sacs [27]. |
| Oxygen/Carbogen Gas (95% O2 / 5% CO2) | Provides oxygenation for tissue metabolism and maintains the pH of the bicarbonate buffer at approximately 7.4 [2]. | Standard procedure for maintaining physiological conditions in Ussing chamber and organ bath studies [2]. |
| D-Glucose | The primary nutrient whose absorption kinetics are being studied. | |
| Phloridzin (Phlorizin) | A specific, competitive inhibitor of SGLT1. Used to confirm the involvement of the active SGLT1 transport pathway [32]. | Suppressed glucose-induced short-circuit current in broiler chicken jejunum, demonstrating SGLT1 activity [34]. |
| α-Methyl-D-Glucopyranoside (AMG) | A non-metabolizable analog of glucose transported by SGLT1. Used to trace glucose uptake without interference from cellular metabolism [2] [27]. | Used in Caco-2 cell uptake assays and tracer studies to measure SGLT1-mediated transport specifically [27]. |
| Lannea edulis Aqueous Extract | An example of a plant extract investigated for its ability to modulate glucose absorption, potentially via SGLT1 inhibition [5] [17]. | Significantly decreased glucose movement in the everted rat jejunum model [5]. |
Specialized Equipment
- Organ Bath or Incubation Chamber: A temperature-controlled water bath with racks to hold multiple sacs.
- Surgical Instruments: Fine scissors, forceps, and silk sutures.
- Carbogen Gas Tank and Tubing: For continuous oxygenation of the incubation medium.
- Glucometer or Glucose Assay Kit: For quantifying glucose concentration in serosal fluid samples.
Experimental Workflow
The diagram below outlines the key steps involved in preparing and conducting an everted jejunal sac experiment for measuring glucose absorption.
Detailed Protocol
Animal and Tissue Preparation
- Fasting: Adult Wistar rats (or other suitable model) should be fasted for 16 hours prior to the experiment to ensure a standardized baseline and reduce the influence of endogenous nutrients [27].
- Euthanasia and Dissection: Humanely euthanize the animal according to approved ethical guidelines. Immediately open the abdominal cavity and excise the entire small intestine.
- Jejunal Isolation: Identify the proximal jejunum (distal to the duodenum). Dissect a segment of approximately 10-15 cm in length [27].
- Luminal Flushing: Gently flush the cold saline solution or ice-cold KRB buffer through the isolated segment to remove intestinal contents.
Eversion and Sac Preparation
- Eversion: Carefully slide the proximal end of the intestinal segment over a thin, smooth glass rod. Gently push the distal end to invert the entire segment, turning the mucosal surface outward. This procedure requires practice to avoid tissue damage.
- Sac Formation: Cut the everted intestine into smaller segments of 1-2 cm in length. Tie off one end of each segment with suture thread. Fill the resulting sac with a pre-warmed and oxygenated KRB buffer (approximately 0.3 - 0.5 mL) using a blunt needle and syringe. Tie off the other end to create a sealed, fluid-filled sac [5] [27].
Incubation and Sample Collection
- Incubation Setup: Place each prepared sac into a separate incubation tube (organ bath) containing a pre-warmed (37°C) and oxygenated (95% O2 / 5% CO2) KRB buffer supplemented with glucose and any test compounds (e.g., plant extracts, inhibitors).
- Glucose Administration and Dosing: The mucosal (external) solution is the site for glucose administration. The specific concentration can vary based on the research question.
- For basic absorption kinetics: A common concentration is 10-20 mM glucose in the KRB buffer.
- For testing inhibitory effects: As demonstrated in a study on Lannea edulis, a concentration of 0.5 mg/mL of the aqueous extract was effective in significantly reducing glucose movement in the everted rat jejunum [5].
- Incubation Parameters:
- Temperature: Maintain a constant 37°C throughout the incubation.
- Duration: A typical incubation period is 30-60 minutes.
- Oxygenation: Continuously bubble the incubation medium with 95% O2 / 5% CO2 to maintain pH and tissue viability.
- Sample Collection: At the end of the incubation period, carefully remove the sac from the solution. Gently blot it dry on filter paper. Puncture the sac and collect the serosal (internal) fluid into a microcentrifuge tube for subsequent glucose analysis.
Data Collection and Anticipated Results
Quantitative Incubation Parameters
The table below summarizes key experimental parameters derived from the literature for reliable ex vivo glucose absorption measurement.
Table 2: Standardized Experimental Parameters for Everted Jejunal Sac Studies
| Parameter | Recommended Setting | Biological Rationale & Literature Support |
|---|---|---|
| Fasting Duration | 16 hours [27] | Standardizes animal's metabolic state; upregulates jejunal SGLT1 activity, making it more responsive to glucose upon refeeding [2]. |
| Sac Length | 1 cm [27] | Provides a standardized tissue unit for reproducible measurement and comparison between treatment groups. |
| Serosal Fill Volume | 0.3 mL [27] | Standardized volume allows for accurate calculation of glucose concentration changes in the internal compartment. |
| Incubation Temperature | 37°C | Maintains physiological temperature for optimal enzyme and transporter function. |
| Atmosphere | 95% O2 / 5% CO2 [2] | Provides oxygenation for active transport and maintains pH of bicarbonate buffer at ~7.4. |
| Effective Inhibitor Concentration | 0.5 mg/mL (for L. edulis extract) [5] | Example of a concentration shown to significantly reduce glucose absorption in the rat jejunal model. |
Glucose Quantification and Analysis
- Glucose Measurement: Determine the glucose concentration in the collected serosal fluid using a glucose assay kit or a sensitive glucometer.
- Data Calculation: Calculate the rate of glucose transport, often expressed as µmol of glucose accumulated per cm of tissue per unit time (e.g., µmol/cm/hr).
- Statistical Analysis: Compare glucose transport rates between control (glucose only) and experimental groups (e.g., glucose plus inhibitor) using appropriate statistical tests (e.g., Student's t-test, ANOVA).
Mechanism of Glucose Transport and Inhibitor Action
The following diagram illustrates the primary cellular mechanism of glucose absorption in the jejunum and the potential sites of action for pharmacological or natural inhibitors studied using the everted sac model.
Key Mechanism: The transport process is initiated by the Na+/K+ ATPase pump on the basolateral membrane, which maintains a low intracellular Na+ concentration. This gradient drives the SGLT1 transporter on the apical membrane to co-transport Na+ and glucose into the cell against glucose's concentration gradient. Glucose then exits the cell into the blood via facilitative diffusion through the GLUT2 transporter on the basolateral membrane [32]. Inhibitors like phloridzin (or bioactive compounds in plant extracts like Lannea edulis or Myrtle Berry Seed) compete with glucose for binding to SGLT1, thereby reducing active glucose uptake [32] [5] [17].
Troubleshooting and Technical Notes
- Low Viability/Activity: Ensure rapid tissue processing after dissection, consistent oxygenation, and use of fresh, pre-warmed buffers. Tissue conductance can be an indicator of viability; diminished conductance suggests poorer tissue integrity [34].
- High Variability Between Sacs: Use animals of the same age, sex, and genetic background. Standardize the dissection region (proximal jejunum) and the skill of the operator performing the eversion.
- No Inhibitor Effect: Verify the activity and solubility of the inhibitor. Pre-incubate the sacs with the inhibitor for 10-15 minutes before adding glucose to ensure adequate binding.
- Segment-Specific Responses: Be aware that glucose absorption capacity and regulatory mechanisms can differ along the length of the small intestine. The jejunum is often the primary site for active SGLT1-mediated glucose absorption, but this can be modulated by fasting/feeding states [2].
Within the study of intestinal physiology and the development of novel therapeutics for metabolic diseases, the ex vivo jejunal sac model stands as a fundamental technique for the direct investigation of glucose absorption dynamics. This method allows researchers to isolate the jejunum, the primary site for dietary glucose absorption, to study the transport mechanisms from the mucosal (luminal) side to the serosal (blood) side under controlled conditions. Accurate measurement of serosal glucose concentration and the subsequent calculation of absorption rates are therefore critical for evaluating the function of glucose transporters, understanding the impact of nutritional status, and screening potential anti-diabetic compounds that target the intestine [2] [35]. These application notes provide a detailed protocol for conducting these measurements, framed within the context of a broader research thesis on ex vivo glucose absorption.
Physiological Context and Key Transport Mechanisms
Intestinal glucose absorption is a tightly regulated process, primarily mediated by the Sodium-Glucose Transporter 1 (SGLT1) located in the apical membrane of enterocytes. This transporter facilitates the active, sodium-coupled uptake of glucose from the intestinal lumen into the cell. The glucose then exits across the basolateral membrane into the serosal compartment via the facilitative glucose transporter GLUT2 [2] [22]. Recent research underscores that this process is not static but is dynamically modulated by physiological states. For instance, fasting has been shown to upregulate SGLT1 function and expression in the jejunum, preparing the intestine for efficient nutrient uptake once feeding resumes. Conversely, a high-glucose diet can suppress jejunal glucose absorption, indicating a segment-specific autoregulatory mechanism to prevent acute hyperglycemia [2].
The following diagram illustrates the primary glucose transport pathway and the core experimental setup of the everted sac model.
Established Experimental Models and Quantitative Data
The ex vivo investigation of glucose absorption utilizes several well-characterized models, each providing distinct but complementary data. The everted intestinal sac is a classic preparation used to directly measure the accumulation of glucose in the serosal fluid over time. The Ussing chamber is another powerful technique that measures the short-circuit current (ΔIsc), which is a direct, real-time electrophysiological correlate of active, SGLT1-mediated glucose transport [2] [35]. Furthermore, the isolated vascularly perfused intestine model allows for the sensitive quantification of absorbed glucose traced with radioactive isotopes, differentiating between transcellular and paracellular routes [22].
The table below summarizes key quantitative findings from recent studies employing these models, highlighting how different experimental conditions and interventions affect glucose absorption.
Table 1: Key Quantitative Findings from Ex Vivo and In Vitro Intestinal Glucose Absorption Studies
| Experimental Model | Intervention / Condition | Key Measured Outcome | Reported Change | Interpretation & Reference |
|---|---|---|---|---|
| Ussing Chamber (Mouse) | 24-48 hour fasting | Glucose-induced ΔIsc in jejunum | Robust increase compared to fed state | Fasting upregulates active SGLT1-mediated glucose absorption in the jejunum. [2] |
| Ussing Chamber (Broiler chickens) | Animal age (1-week vs. 5-week old) | ΔIsc in response to D-maltose | Significantly higher in 1-week-old chicks | Active glucose transport across the jejunal epithelium decreases with growth. [35] |
| Isolated Vascularly Perfused Rat Intestine | Luminal SGLT1 blockade (Phlorizin) | Total glucose absorption at 100 mmol/L | ~60% decrease | Confirms SGLT1's major role; remaining absorption suggests alternative pathways. [22] |
| Isolated Vascularly Perfused Rat Intestine | Basolateral GLUT2 blockade (Phloretin) | Total glucose absorption at 100 mmol/L | ~70% decrease | GLUT2 is critical for glucose exit; some absorption persists. [22] |
| Ussing Chamber (Mouse) | Myrtle Berry Seed Aqueous Extract (MBSAE) | Glucose-induced short-circuit current | Significant reduction | Suggests a direct inhibitory effect on intestinal glucose absorption, potentially via SGLT1. [17] |
Detailed Protocol: Everted Jejunal Sac Assay
This protocol details the procedure for measuring serosal glucose accumulation using the everted jejunal sac model, adapted from referenced studies [2] [35] [22].
Reagents and Equipment
Table 2: Research Reagent Solutions and Essential Materials
| Item | Function / Specification |
|---|---|
| Krebs-Ringer Bicarbonate (KRB) Buffer | Standard physiological saline, gassed with 95% O₂/5% CO₂, pH 7.4. |
| D-Glucose | Substrate for absorption studies. Prepare a stock solution (e.g., 100 mM) in KRB buffer. |
| Phlorizin | A specific, high-affinity SGLT1 inhibitor. Used to confirm SGLT1-mediated transport. |
| Phloretin | An inhibitor of GLUT2. Used to block basolateral glucose efflux. |
| Oxygen-Carbogen Gas Mixture | (95% O₂ / 5% CO₂) For oxygenation and pH maintenance of buffers. |
| Ussing Chamber System | For simultaneous measurement of short-circuit current and tissue conductance. |
| Water Bath | Maintained at 37°C for incubation of everted sacs. |
| Glucose Assay Kit | Enzymatic (e.g., glucose oxidase/peroxidase) or other validated method for quantifying glucose concentration. |
Step-by-Step Workflow
The entire experimental procedure, from tissue preparation to data analysis, is outlined in the workflow below.
Step 1: Tissue Isolation and Preparation
- Euthanize the animal according to approved ethical guidelines.
- Quickly open the abdominal cavity and excise the entire small intestine.
- Identify the jejunal segment (typically the proximal two-fifths of the small intestine following the duodenum) and place it in ice-cold, oxygenated KRB buffer.
- Carefully flush the lumen with cold buffer to remove intestinal contents.
- Evert the jejunal segment gently over a glass rod or using fine forceps, so the mucosal surface faces outward.
Step 2: Sac Preparation and Incubation
- Cut the everted jejunum into segments of uniform length (e.g., 3-4 cm).
- Ligate one end of each segment and fill it with a pre-warmed, glucose-free serosal buffer (e.g., KRB) using a syringe. Avoid over-distension.
- Ligate the other end to create a closed sac.
- Weigh the filled sac to obtain a tare weight.
- Incubate each sac in a separate flask containing a known volume of pre-warmed, oxygenated mucosal buffer (KRB with a defined concentration of D-glucose, e.g., 10-25 mM) in a shaking water bath at 37°C for a predetermined time (e.g., 30-60 minutes).
Step 3: Sample Collection and Glucose Analysis
- After incubation, carefully remove the sac from the flask, gently blot it dry, and weigh it again.
- Puncture the sac and collect the serosal fluid into a pre-chilled microcentrifuge tube.
- Centrifuge the serosal fluid if necessary to remove any cellular debris.
- Analyze the glucose concentration in the serosal fluid using a validated method, such as an enzymatic glucose assay kit based on glucose oxidase/peroxidase reactions, which produces a colored product measurable with a spectrophotometer [36] [37].
- Retain an aliquot of the initial mucosal buffer for baseline glucose measurement.
Step 4: Data Calculation and Analysis The glucose absorption rate can be expressed in multiple ways:
- Serosal Glucose Accumulation:
(Glucose_serosal * Volume_serosal) / (Time * Sac Weight) - Mucosal Glucose Disappearance:
(Glucose_mucosal_initial - Glucose_mucosal_final) * Volume_mucosal) / (Time * Sac Weight) - Using chamber data: The change in short-circuit current (ΔIsc) upon glucose addition is measured in µA/cm² and is a direct readout of electrogenic transport [2] [35].
For inhibitor studies, include control sacs incubated with vehicle and experimental sacs incubated with the inhibitor (e.g., 0.1-0.5 mM Phlorizin) in the mucosal buffer.
Advanced Methodological Considerations
To ensure robust and physiologically relevant data, researchers should account for several advanced factors:
- Animal Status and Fasting: The nutritional status of the animal profoundly impacts results. A 24-48 hour fasting period prior to the experiment significantly upregulates jejunal SGLT1 activity, leading to stronger absorption signals [2].
- Viability and Integrity Controls: Always include control segments to verify tissue viability. This can be done by measuring the transport of a non-metabolizable glucose analog like α-Methyl-D-glucopyranoside (AMG) or by assessing tissue conductance in an Ussing chamber.
- Distinguishing Transport Pathways: To dissect the contribution of active versus passive transport, experiments should be designed with and without specific inhibitors (Phlorizin for SGLT1) and at different glucose concentrations to observe saturable versus non-saturable kinetics [22]. The paracellular pathway can be assessed using markers like Mannitol [22].
By adhering to these detailed protocols and considerations, researchers can reliably measure serosal glucose and calculate absorption rates, providing valuable insights into intestinal function and the efficacy of novel therapeutic compounds.
The sodium-glucose cotransporter 1 (SGLT1) serves as the principal mediator of active glucose absorption at the apical membrane of enterocytes in the small intestine, particularly at low luminal glucose concentrations [38]. Its critical role in maintaining glucose homeostasis has established SGLT1 as a significant target for managing postprandial hyperglycemia, a key concern in metabolic disorders like type 2 diabetes [17] [38]. Research has demonstrated that inhibition of SGLT1 function reduces intestinal glucose absorption, thereby lowering postprandial blood glucose levels without systemic drug exposure [17] [39]. This application note details standardized protocols and case studies for evaluating the efficacy of bioactive compounds as SGLT1 inhibitors using ex vivo models, specifically focusing on the everted jejunal sac technique, to support drug discovery and functional food development.
Key Mechanisms of SGLT1-Mediated Glucose Absorption
Glucose absorption in the small intestine occurs primarily through a two-step process. First, SGLT1 at the apical (brush border) membrane of enterocytes co-transports glucose with sodium ions against its concentration gradient. This active transport is driven by the sodium gradient maintained by Na+/K+-ATPase on the basolateral membrane. Second, glucose exits the enterocyte into the bloodstream via facilitated diffusion through GLUT2 transporters located in the basolateral membrane [38]. At high intraluminal glucose concentrations (>30 mM), a secondary, rapid translocation of GLUT2 to the apical membrane may contribute to additional glucose uptake [38].
The critical role of SGLT1 is highlighted by genetic disorders; individuals lacking functional SGLT1 suffer from glucose-galactose malabsorption, confirming its non-redundant role in dietary glucose uptake [38]. The expression and membrane localization of SGLT1 are regulated by various factors, including fasting and feeding states [2], dietary composition [38], and locally produced hormones such as angiotensin II (AII), which exerts autocrine control over SGLT1-dependent glucose transport [40].
The following diagram illustrates the primary pathway through which bioactive compounds inhibit SGLT1 to reduce glucose absorption.
Quantitative Efficacy of Selected Bioactive Compounds
Research across multiple ex vivo and in vitro models has demonstrated the efficacy of various natural extracts and compounds in modulating SGLT1-mediated glucose absorption. The table below summarizes the key findings from recent studies.
Table 1: Efficacy of Bioactive Compounds on SGLT1-Mediated Glucose Absorption
| Compound/Extract | Experimental Model | Key Findings on Glucose Absorption | Suggested Mechanism |
|---|---|---|---|
| Myrtle Berry Seeds Aqueous Extract (MBSAE) [17] | Mouse jejunal epithelium (Using chamber); Alloxan-induced diabetic rats | Significantly reduced glucose-induced short-circuit current ($I_{sc}$). Lowered plasma glucose and improved metabolic markers in vivo. | Direct inhibition of intestinal glucose absorption, potentially via SGLT1 modulation. |
| Lannea edulis Leaf Extract [5] | Everted rat jejunum | 0.5 mg/mL significantly decreased glucose movement from mucosa to serosa (p < 0.001). | Reduced intestinal glucose absorption; rich in flavonoids, tannins, phenols, and saponins. |
| Angiotensin II (AII) [40] | Rat everted intestinal sleeves | 0-100 nM inhibited SGLT1-dependent glucose uptake in a dose-dependent manner. Inhibitory effect attenuated by losartan (AT1 receptor antagonist). | Rapid, autocrine inhibition of SGLT1, reducing its expression at the brush border membrane (BBM). |
| Digested Dietary Proteins [41] | Caco-2/TC7 cells | Casein, fish gelatin, and others decreased apical AMG (SGLT1-dependent) glucose uptake after 1-hour pre-incubation. | Digested protein-derived peptides and amino acids decrease SGLT1/GLUT2 mRNA expression. |
| Compounds from Lilium lancifolium [39] | Caco-2 cell monolayers | Kaempferol, caffeic acid, and quercetin-3-O-β-D-galactoside inhibited glucose uptake in a concentration-dependent manner. | Down-regulated SGLT1 and GLUT2 expression; inhibited α-glucosidase activity. |
Detailed Experimental Protocol: Everted Jejunal Sac Assay
This protocol provides a standardized methodology for assessing the effect of bioactive compounds on active, SGLT1-mediated glucose absorption using the ex vivo everted jejunal sac model, a cornerstone technique in the broader thesis research context.
Materials and Reagents
Table 2: Essential Research Reagents and Solutions
| Reagent/Solution | Function/Description | Example from Literature |
|---|---|---|
| Krebs-Ringer Bicarbonate (KRB) Buffer | Physiological salt solution to maintain tissue viability and ionic balance. Typically contains NaCl, KCl, CaCl₂, KH₂PO₄, MgSO₄, NaHCO₃, and glucose [5]. | Pre-gassed with 95% O₂/5% CO₂; pH 7.4 [40] [5]. |
| D-Glucose | Substrate for SGLT1 transport. Often used with a radioactive or fluorescent tracer for quantification. | 2-10 mM concentration in mucosal buffer [40] [5]. |
| Phloridzin (or Phlorizin) | Specific, competitive SGLT1 inhibitor. Serves as a positive control for inhibition experiments. | 0.5-1.0 mM; used to confirm SGLT1-specific component of uptake [40] [34]. |
| Test Compound/Extract | Bioactive substance under investigation for SGLT1 inhibitory activity. | Dissolved in appropriate solvent (e.g., DMSO, KRB buffer) and used at varying concentrations [5]. |
| Oxygen-Carbogen Mix (95% O₂ / 5% CO₂) | Gas mixture for carbogenation of buffers. Provides oxygen for tissue respiration and maintains buffer pH. | Continuously bubbled through KRB buffer before and during incubation [40]. |
Step-by-Step Procedure
Tissue Preparation:
- Euthanize the experimental animal (e.g., rat, mouse) following approved ethical guidelines.
- Quickly open the abdominal cavity and excise the entire small intestine.
- Flush the intestinal lumen with ice-cold, oxygenated KRB buffer to remove luminal contents.
- Isolate the jejunum (the middle section of the small intestine, typically starting 10 cm distal to the ligament of Treitz) [40].
- Gently evert the jejunal segment over a glass rod or using careful manipulation, transforming it into a serosa-out, mucosa-in preparation.
Sac Preparation and Filling:
- Cut the everted intestine into segments of uniform length (e.g., 3-4 cm).
- Tie off one end of each segment with surgical suture.
- Fill the sac with a small volume (e.g., 0.5-1.0 mL) of oxygenated KRB buffer (serosal solution) using a syringe with a blunt-end needle.
- Tie off the other end to create a closed, filled sac.
Incubation with Test Compounds:
- Place each prepared sac into a separate incubation flask (e.g., 25-50 mL Erlenmeyer flask) containing oxygenated KRB buffer with a known concentration of D-glucose (e.g., 10 mM) in the mucosal solution.
- Add the test compound or vehicle control to the mucosal incubation buffer.
- Gas the flask with 95% O₂/5% CO₂, seal, and incubate in a shaking water bath at 37°C for a set time (e.g., 30-60 minutes) [5].
Sample Collection and Measurement:
- After incubation, remove the sac from the flask and carefully drain the serosal fluid from inside the sac.
- The primary endpoint is the measurement of glucose that has been transported from the mucosal medium into the serosal fluid. This can be quantified using:
- Radioactive tracer: If 14C-labeled glucose or its analog α-methyl-D-glucopyranoside (AMG) is used, measure radioactivity in the serosal fluid by liquid scintillation counting [40].
- Colorimetric/Glucose Oxidase assay: If using non-labeled glucose, measure the glucose concentration in the serosal fluid using a standard glucose assay kit.
- Tissue viability can be confirmed by measuring lactate dehydrogenase (LDH) release or by visual inspection of the epithelial layer.
The following workflow diagram summarizes the key steps of this protocol.
Complementary and Advanced Methodologies
Ussing Chamber System
The Ussing chamber technique provides real-time, functional measurement of electrogenic glucose transport across intact intestinal epithelium. In this system, glucose addition to the mucosal side generates a rapid increase in short-circuit current ($I{sc}$), which represents the net movement of Na+ ions coupled to glucose via SGLT1 [17] [2]. Inhibition of this glucose-induced $I{sc}$ is a direct indicator of SGLT1 blockade. This method was effectively used to demonstrate the inhibitory effect of Myrtle Berry Seed Aqueous Extract (MBSAE) [17] and to characterize segment-specific (jejunum vs. ileum) and state-specific (fed vs. fasted) regulation of glucose absorption [2].
Cell-Based Assays (Caco-2 Model)
Differentiated Caco-2 cell monolayers, which spontaneously express SGLT1 and form tight junctions, are a valuable in vitro model. Glucose uptake is typically measured using a non-metabolizable tracer like 14C-AMG or fluorescent glucose analogs. Pre-incubating Caco-2 cells with digested dietary proteins (e.g., casein, fish gelatin) or specific plant compounds (e.g., kaempferol from Lilium lancifolium) has been shown to significantly reduce SGLT1-mediated glucose uptake and downregulate SGLT1 mRNA expression [41] [39]. The integrity of the cell monolayer must be monitored by measuring transepithelial electrical resistance (TEER) [39].
The everted jejunal sac technique, complemented by the Ussing chamber and Caco-2 cell models, provides a robust and physiologically relevant ex vivo platform for the discovery and validation of novel SGLT1 inhibitors. The documented efficacy of diverse natural extracts—from myrtle berry seeds to Lannea edulis leaves—highlights the rich potential of bioactive compounds in managing postprandial hyperglycemia through targeted inhibition of intestinal glucose absorption. The standardized protocols detailed herein offer a reliable framework for researchers in drug development and functional food science to systematically evaluate new compounds, ultimately contributing to innovative strategies for metabolic disease management.
Enhancing Assay Performance: Troubleshooting and Critical Optimization Strategies
Within the context of ex vivo research on glucose absorption, the jejunal sac model provides a valuable tool for investigating transport mechanisms across the intestinal epithelium. The integrity and viability of the excised tissue are paramount for generating physiologically relevant data. This application note details common pitfalls—specifically regarding tissue viability, edge damage, and mucosal integrity—encountered during the preparation and use of jejunal sacs, and provides standardized protocols to mitigate these issues, thereby enhancing the reliability of data related to glucose absorption studies.
Pitfall Analysis and Mitigation Strategies
The successful use of ex vivo intestinal sacs hinges on overcoming specific technical challenges that can compromise experimental outcomes. The table below summarizes the primary pitfalls, their consequences for glucose absorption studies, and recommended solutions.
Table 1: Common Pitfalls in Jejunal Sac Preparation and Their Mitigation
| Pitfall | Impact on Glucose Absorption Studies | Evidence-Based Mitigation Strategy |
|---|---|---|
| Tissue Viability Loss | Loss of active, transcellular glucose transport via SGLT1/GLUT2 [22]. | Utilize pre-warmed (37°C), oxygenated (95% O₂/5% CO₂) physiological buffer (e.g., TC199, DMEM) to maintain cellular metabolism and transporter function [42]. |
| Edge Damage | Disruption of epithelial continuity, enabling unregulated paracellular glucose flux and overestimation of passive absorption [22]. | Handle tissue with extreme care using blunt instruments; securely ligate with sutures without crushing the tissue segment to preserve the functional epithelial barrier [42]. |
| Compromised Mucosal Integrity | Leads to non-physiological, high paracellular permeability, confounding the measurement of specific glucose transporter activity [22] [42]. | Verify integrity by measuring the flux of non-absorbable markers like FITC-dextran 4,400 (FD-4) and only using sacs with low baseline permeability [42]. |
| Inconsistent Tissue Sourcing | Regional variations in transporter density and function along the jejunum lead to high data variability [22]. | Standardize the anatomical source of the jejunal segment relative to the pyloric sphincter and avoid areas with visible Peyer's patches [42]. |
Core Experimental Protocol: Jejunal Sac Preparation and Glucose Absorption Measurement
This protocol is adapted from established ex vivo methodologies [42] and is designed to minimize the pitfalls discussed above, specifically for investigating glucose absorption.
Reagents and Equipment
Table 2: Research Reagent Solutions for Ex Vivo Glucose Absorption Studies
| Item | Function/Explanation | Example/Specification |
|---|---|---|
| Oxygenated Buffer | Maintains tissue viability and physiological pH (7.3-7.4) during dissection and incubation [42]. | TC199 or DMEM, bubbled with 95% O₂/5% CO₂. |
| Phlorizin | A specific SGLT1 inhibitor. Used to block active, sodium-dependent glucose transport across the apical membrane, allowing for the quantification of the SGLT1-mediated vs. non-mediated absorption components [22]. | Typically applied to the luminal (mucosal) compartment at µM concentrations. |
| Phloretin | A GLUT2 inhibitor. Used to block facilitated glucose transport, primarily at the basolateral membrane, helping to delineate the contribution of this transporter [22]. | Typically applied to the vascular (serosal) compartment at mM concentrations. |
| 14C-D-Glucose | Radioactive tracer allowing for highly sensitive and accurate quantification of total glucose absorption, distinct from endogenous sources [22]. | Added to the luminal solution. |
| FITC-Dextran 4,400 (FD-4) | A paracellular permeability marker. Its flux from mucosa to serosa is used to assess and monitor the integrity of the tight junctions in the prepared sac [42]. | Added to the luminal solution at 1 mg/mL. |
| Suture Material | For creating secure, leak-proof ligations at the ends of the intestinal sac without causing excessive crush injury [42]. | Non-absorbable, sterile suture (e.g., silk). |
Step-by-Step Workflow
- Dissection and Isolation: Euthanize the animal according to approved ethical protocols. Quickly open the abdomen and identify the small intestine. Ligate and excise a consistent segment of the jejunum (e.g., a 5 cm segment distal to the pyloric sphincter). Immediately place the tissue in pre-warmed, oxygenated buffer [42].
- Luminal Flushing: Gently flush the luminal contents from the isolated jejunal segment using a syringe filled with pre-warmed (37°C) phosphate-buffered saline (PBS) to remove mucus and debris that could interfere with absorption [42].
- Sac Preparation: Measure a specific length (e.g., 5 cm) of the flushed jejunum and securely tie one end with a suture. Using a blunted catheter attached to a syringe, carefully fill the sac with 300 µL of pre-warmed experimental solution (e.g., oxygenated buffer containing glucose, 14C-D-glucose, and FD-4). Secure the open end with a second suture to create a closed sac [42].
- Incubation and Sampling: Place the prepared sac in a conical tube containing 20 mL of oxygenated, pre-warmed buffer (serosal compartment). Incubate the tube in a water bath at 37°C with gentle agitation. At predetermined time points (e.g., 0, 30, 60, 90, 120 min), take 100 µL samples from the serosal compartment, replacing the volume with fresh pre-warmed buffer each time [42].
- Analysis:
- Glucose Absorption: Quantify the appearance of 14C-D-glucose in the serosal samples using a liquid scintillation counter [22].
- Mucosal Integrity: Measure the fluorescence of FD-4 in the serosal samples (excitation/emission: 495 nm/519 nm) to calculate its permeability [42].
- Data Calculation: Calculate the Apparent Permeability (Papp) for both glucose and FD-4 to standardize measurements across sacs of different sizes [42].
Experimental Workflow Visualization
The following diagram illustrates the key steps in the jejunal sac preparation protocol, highlighting critical actions for maintaining tissue viability and integrity.
Application in Glucose Absorption Research
The isolated jejunal sac model is particularly powerful for dissecting the complex mechanisms of intestinal glucose absorption. Research indicates that glucose is absorbed via both active transcellular routes (mediated by SGLT1 and GLUT2 transporters) and passive paracellular pathways [22]. The protocols described here are essential for accurately characterizing these mechanisms.
For instance, the use of specific transport inhibitors is a key application of this model. Adding phlorizin to the luminal solution can block SGLT1, allowing researchers to quantify the contribution of this transporter. One study using a vascularly perfused rat intestine model found that SGLT1 blockade reduced glucose absorption by approximately 60%, indicating that a significant portion (~30-40%) of absorption occurred via non-SGLT1 mediated pathways, later shown to include paracellular transport [22]. Similarly, the integrity marker FD-4 is crucial for validating that the measured glucose transport is a specific, transcellular process and not an artifact of a generally "leaky" tissue preparation [42].
Table 3: Quantifying Glucose Transport Mechanisms Using Inhibitors
| Experimental Condition | Typical Change in Glucose Absorption | Interpretation |
|---|---|---|
| Luminal Phlorizin (SGLT1 blocker) | Reduction of ~60% at 100 mmol/L glucose [22] | Quantifies the fraction of glucose absorption mediated by SGLT1. |
| Vascular Phloretin (GLUT2 blocker) | Reduction of ~70-80% [22] | Quantifies the importance of basolateral GLUT2 for overall transepithelial glucose transport. |
| Combined SGLT1 & GLUT2 Blockade | ~30% of absorption remains [22] | Reveals the contribution of passive/paracellular glucose absorption pathways. |
| Increased FD-4 Flux | Correlates with increased paracellular glucose absorption [22] [42] | Confounds specific transporter data; underscores the need for integrity monitoring. |
Attention to the detailed protocols for preserving tissue viability, minimizing edge damage, and rigorously assessing mucosal integrity is not merely a technical exercise—it is a fundamental requirement for generating reliable and interpretable data on glucose absorption using ex vivo jejunal sacs. By implementing the standardized methods and mitigation strategies outlined in this application note, researchers can significantly reduce experimental artifact and advance our understanding of intestinal nutrient transport.
Within intestinal physiology and drug development research, the ex vivo jejunal sac model is a cornerstone technique for investigating the mechanisms of nutrient absorption. A critical step in employing this model is the precise experimental validation of active transport pathways, distinguishing them from passive diffusion. This application note provides a detailed protocol for validating active glucose transport in ex vivo jejunal sacs through the specific use of phloridzin inhibition and sodium-free controls. The methodology is framed within a broader thesis on quantifying glucose absorption, providing researchers with a robust framework to ensure data accuracy and mechanistic insight.
Glucose absorption in the small intestine occurs via two primary transporters: the sodium-glucose cotransporter 1 (SGLT1), which mediates active transport, and glucose transporter 2 (GLUT2), which facilitates passive diffusion [1] [39]. At low luminal glucose concentrations (typically < 30 mM), SGLT1 is the dominant pathway, actively transporting glucose into enterocytes against its concentration gradient by coupling it with sodium ions down their electrochemical gradient [1] [43]. This active process is energy-dependent and can be saturable. In contrast, at high luminal glucose concentrations (> 30 mM), facilitative diffusion via GLUT2, which can be rapidly translocated to the brush border membrane, becomes significant [1] [44]. The following diagram illustrates these core mechanisms and the points of intervention for the validation techniques discussed in this protocol.
Theoretical Background
Mechanisms of Intestinal Glucose Absorption
The absorption of dietary glucose is a complex process initiated by the hydrolysis of complex carbohydrates into monosaccharides in the intestinal lumen [39]. The resulting glucose molecules are then absorbed by enterocytes primarily through the coordinated action of SGLT1 and GLUT2 transporters. The SGLT1 transporter, located in the brush border membrane, is responsible for active glucose uptake. This transporter couples the inward movement of one glucose molecule with two sodium ions, utilizing the steep sodium gradient maintained by the basolateral Na+/K+ ATPase pump [1] [43]. The energy for this process is derived from the ATP-dependent pumping of sodium out of the cell, creating a low intracellular sodium concentration that drives sodium and glucose influx. The expression and activity of SGLT1 are influenced by dietary carbohydrates and regulatory factors, including peptide hormones such as glucagon-like peptide-1 (GLP-1) and leptin [1].
Once inside the enterocyte, glucose exits across the basolateral membrane into the bloodstream via GLUT2, a facilitative diffusion transporter that does not require energy and moves glucose down its concentration gradient [1] [44]. Under conditions of high luminal glucose concentration (>30 mM), GLUT2 is rapidly recruited to the apical membrane, providing a high-capacity pathway for glucose absorption via facilitated diffusion [1] [44]. This dynamic translocation is regulated by signaling pathways involving G-proteins, phospholipase C β2 (PLC-β2), and protein kinase C βII (PKCβII) [44]. In metabolic diseases such as type 2 diabetes, this regulatory balance is disturbed, leading to pathological enhancement of intestinal glucose absorption and contributing to postprandial hyperglycemia [1] [44].
Rationale for Validating Active Transport
The quantification of glucose absorption in ex vivo models must distinguish between the contributions of active transport and passive diffusion to yield mechanistically meaningful data. Simply measuring total glucose uptake does not reveal the underlying transport pathways, which is crucial for understanding basic physiology, evaluating the effects of diseases like diabetes on absorption, and screening potential therapeutic compounds that may target specific transporters [44] [45].
The use of specific inhibitors and controlled conditions allows for this discrimination. Phloridzin, a competitive antagonist of SGLT1, and sodium-free buffers, which remove the driving force for SGLT1, are highly specific tools for isolating the active component of transport. A significant reduction in glucose uptake in the presence of either condition provides strong evidence for a substantial active transport component. Furthermore, these validation steps serve as critical quality controls, confirming the viability and functional integrity of the ex vivo tissue preparation by demonstrating the presence of an energy-dependent, saturable transport system.
Experimental Protocols
Core Protocol: Ex Vivo Glucose Absorption Using Jejunal Sacs
This protocol outlines the standard procedure for measuring glucose absorption in everted jejunal sacs, a preparation that exposes the mucosal brush border to the incubation medium directly.
Materials:
- Animal Model: Adult mice (e.g., C57BL/6, 8-9 weeks old) or rats (e.g., Wistar, 180-220 g) are commonly used [46] [45].
- Krebs-Bicarbonate Ringer (KBR) Buffer (Standard): 120 mM NaCl, 5.5 mM KCl, 2.5 mM CaCl₂, 1.2 mM MgCl₂, 1.2 mM NaH₂PO₄, 20 mM NaHCO₃, and 11 mM glucose; pH 7.4 when gassed with 95% O₂/5% CO₂ [47] [46].
- Sodium-Free KBR Buffer: Equimolar replacement of NaCl with Choline Chloride or N-Methyl-D-glucamine (NMDG) Chloride, and NaHCO₃ with KHCO₃.
- Inhibitor Stock Solution: 10-100 mM Phloridzin in DMSO or ethanol.
- Glucose Assay Kit: Based on the glucose oxidase method or other suitable detection methods.
- Equipment: Dissection tools, water bath or heating block maintained at 37°C (or species-specific core temperature), carbogen tank (95% O₂/5% CO₂), incubation chambers, syringes.
Procedure:
- Tissue Harvesting: Sacrifice the animal according to approved ethical guidelines. Immediately open the abdominal cavity and locate the small intestine. Gently excise a segment of the jejunum (typically 10-15 cm in length, distal to the ligament of Treitz).
- Tissue Preparation: Flush the jejunal segment thoroughly with ice-cold, oxygenated KBR buffer to remove luminal contents. Carefully evert the sac using a blunt rod or suture, so the mucosal surface faces outward.
- Sac Preparation: Fill a syringe with oxygenated, warm KBR buffer. Tie off one end of the everted segment, gently fill it with a defined volume (e.g., 0.5-1.0 mL) of KBR buffer (this represents the serosal compartment), and tie off the other end to create a closed sac.
- Incubation:
- Pre-warm the incubation medium (KBR buffer containing the desired concentration of glucose, e.g., 5-45 mM) to 37°C in a beaker or flask with continuous oxygenation [46].
- Weigh the filled sac to obtain a tare weight.
- Immerse the sac in the incubation medium and incubate for a defined period (typically 15-60 minutes) with continuous oxygenation and gentle agitation.
- Sample Collection: After incubation, carefully remove the sac, gently blot it dry, and re-weigh. Puncture the sac and collect the serosal fluid. Retain samples of the initial mucosal incubation medium for analysis.
- Glucose Quantification: Use a glucose assay kit to measure the glucose concentration in the serosal fluid and the initial/final mucosal medium.
- Data Analysis: Calculate the rate of glucose transport. Common metrics include:
- Serosal Glucose Accumulation: (Glucose concentration in serosal fluid × volume of serosal fluid) / (incubation time × tissue weight).
- Mucosal Glucose Disappearance: (Initial mucosal glucose - Final mucosal glucose) / (incubation time × tissue weight).
Validation Protocol A: Phloridzin Inhibition
This protocol is integrated into the core procedure to specifically assess the SGLT1-mediated component of glucose uptake.
Procedure:
- Prepare two identical sets of incubation media as per the core protocol.
- To the experimental set, add phloridzin from the stock solution to a final concentration of 0.1-0.5 mM [46]. Add an equivalent volume of the vehicle (DMSO/ethanol) to the control set.
- Divide the everted jejunal sacs from a single animal into paired control and experimental groups.
- Incubate the control and experimental sacs in their respective media simultaneously, following the core protocol steps 4-6.
- Calculate the percentage inhibition of glucose transport attributable to SGLT1 using the formula:
- % Inhibition = [1 - (Glucose Transportexperimental / Glucose Transportcontrol)] × 100
Validation Protocol B: Sodium-Free Controls
This protocol determines the sodium-dependence of glucose transport, a hallmark of SGLT1 activity.
Procedure:
- Prepare two incubation media: the standard KBR buffer and the Sodium-Free KBR buffer.
- Ensure both buffers are osmotically balanced and contain the same concentration of glucose.
- Divide the everted jejunal sacs from a single animal into paired control (standard KBR) and experimental (Sodium-Free KBR) groups.
- Incubate the sacs in their respective media simultaneously, following the core protocol steps 4-6.
- Calculate the percentage of sodium-dependent transport, which reflects active transport via SGLT1:
- % Sodium-Dependent Transport = [1 - (Glucose Transportsodium-free / Glucose Transportcontrol)] × 100
The following workflow diagram integrates these core and validation protocols into a single, coherent experimental sequence.
Data Presentation and Analysis
Compilation of Quantitative Data from Literature
The following tables summarize key quantitative findings from relevant studies that utilize phloridzin, sodium manipulation, or other inhibitors to study glucose transport, providing a reference for expected results.
Table 1: Inhibitor and Ionic Control Effects on Glucose Transport Parameters
| Experimental Condition | Model System | Key Quantitative Effect | Interpretation & Citation |
|---|---|---|---|
| Phloridzin (0.3 mM) | Mouse jejunum (Ussing chamber) | Dose-dependent reduction in active glucose uptake (ΔIsc) induced by 45 mM glucose. | Confirms SGLT1 is the primary mediator of active glucose transport at high concentrations. [46] |
| Sodium-Free Buffer | In vitro intestinal prep. | Virtual cessation of glucose absorption. | Demonstrates absolute Na+ dependence of the primary active transport pathway. [43] |
| Ouabain / Digitalis | In vitro intestinal prep. | Inhibition of glucose absorption. | Inhibits Na+/K+ ATPase, dissipating the Na+ gradient essential for SGLT1 function. [43] |
| Sodium Orthovanadate | Rat small intestine | Reduced mRNA expression of GLUT2 and α-glucosidase; delayed glucose absorption. | Acts through multiple mechanisms, including inhibition of transporter expression. [45] |
| Berberine (200 mg/kg) | Diabetic mouse model | Decreased intestinal glucose transport by 45.7%; inhibited GLUT2 translocation to brush border. | Reduces postprandial hyperglycemia by targeting the facilitative GLUT2 pathway. [44] |
Table 2: Impact of Physiological and Pathological States on Glucose Transport
| State / Intervention | Model System | Effect on Transport / Transporter | Citation |
|---|---|---|---|
| High Luminal Glucose (>30 mM) | Mammalian intestine | Rapid translocation of GLUT2 to apical membrane; increased contribution of facilitative diffusion. | [1] [44] |
| Type 2 Diabetes | Human & mouse studies | Increased expression/activity of SGLT1 and GLUT2; enhanced intestinal glucose absorption. | [1] [44] |
| Oestrous Cycle (Pro-oestrus) | Mouse jejunum | Higher active glucose transport compared to oestrus stage. | Suggests hormonal regulation of intestinal glucose uptake. [46] |
| Low-Salt Diet (782 mg Na+/day) | Hypertensive patients | Increased plasma glucose and insulin AUC after OGTT. | Systemic insulin resistance induced by low Na+ may indirectly affect intestinal handling. [48] |
| Ethanol (6% v/v) | Rabbit jejunum | Reduced uptake of 1mM and 40mM glucose; increased Km, reduced Jdm and Pd. | Complex, multi-faceted inhibition of both active and passive transport components. [49] |
Interpretation of Results and Common Pitfalls
A successful validation is indicated by a significant reduction (typically >70-80%) in glucose transport rates in the presence of either phloridzin or sodium-free conditions when using low-to-moderate glucose concentrations. This confirms that SGLT1-mediated active transport is the dominant mechanism under those specific experimental conditions.
A partial inhibition suggests a mixed contribution of active and passive pathways. This is expected at very high glucose concentrations where GLUT2-mediated facilitative diffusion becomes significant. In this case, the phloridzin/sodium-sensitive component represents the active transport fraction.
High variability between sacs from the same animal can arise from uneven tissue viability, damage during eversion, or regional differences along the jejunum. Using paired tissues from the same animal for control and experimental groups and randomizing tissue allocation are essential to mitigate this.
Lack of significant inhibition could indicate non-viable tissue (failed positive control), incorrect inhibitor concentration, or the use of a glucose concentration that overwhelmingly favors the passive, phloridzin-insensitive GLUT2 pathway. Assessing tissue viability with a compound like carbachol, which should elicit a physiological response, is recommended [46].
The Scientist's Toolkit
Table 3: Essential Reagents and Materials for Validating Active Glucose Transport
| Item | Specifications / Example | Primary Function in Protocol |
|---|---|---|
| Phloridzin | ≥98% purity; 10-100 mM stock in DMSO. | Competitive, high-affinity SGLT1 inhibitor used to isolate the active transport component. |
| Sodium-Free Buffer Salts | Choline Chloride, NMDG Chloride, KHCO₃. | To formulate incubation buffers that eliminate the Na+ gradient, the driving force for SGLT1. |
| Krebs-Bicarbonate Ringer | Standard physiological salt solution with 11 mM glucose, gassed with 95% O₂/5% CO₂. | Maintains tissue viability, pH, and ionic balance during ex vivo incubation. [47] |
| Glucose Assay Kit | Glucose Oxidase/POD-based, fluorometric, or HPLC. | Accurate quantification of glucose concentration in serosal and mucosal samples. |
| Everted Sac Setup | Surgical tools, sutures/silk ties, syringes, incubation chambers. | Preparation and maintenance of the functional ex vivo intestinal tissue model. |
| Carbogen Gas | 95% O₂ / 5% CO₂ mixture. | Oxygenation of tissue and maintenance of buffer pH at 7.4. |
| Therapeutic Compounds (e.g., Berberine) | Positive control for GLUT2 modulation. [44] | To test or demonstrate effects on the facilitative diffusion pathway in comparative studies. |
The rigorous validation of active transport mechanisms is not merely a procedural step but a fundamental requirement for generating reliable and interpretable data in ex vivo jejunal sac research. The concurrent application of phloridzin inhibition and sodium-free controls provides a powerful, self-reinforcing strategy to confirm the presence and quantify the contribution of SGLT1-mediated active transport. By integrating these validation protocols, researchers can dissect the complex interplay of glucose transporters, accurately assess the impact of pathophysiological states like diabetes, and robustly evaluate the mechanism of action of novel compounds targeting intestinal sugar absorption. This approach ensures that conclusions drawn from the ex vivo model are mechanistically grounded and physiologically relevant.
The fidelity of ex vivo glucose absorption measurement using jejunal sacs is fundamentally dependent on the maintenance of physiological conditions that mirror the in vivo environment. During the transition from a living organism to an ex vivo preparation, intestinal tissue is acutely vulnerable to hypoxia, thermal stress, and osmotic imbalance. These stressors can rapidly induce cellular damage, alter transporter activity, and compromise barrier integrity, leading to unreliable experimental data. This document provides detailed Application Notes and Protocols for optimizing three critical parameters—oxygenation, temperature, and osmolarity—to ensure the functional integrity of jejunal sacs and the validity of subsequent absorption measurements. Adherence to these protocols is essential for generating reproducible, physiologically relevant results in pharmacology and nutraceutical development research.
Physiological Parameters and Optimization Strategies
Oxygenation: Preventing Hypoxic Injury
Background: The intestinal epithelium has a high metabolic rate and is exceptionally susceptible to hypoxic damage, which disrupts active transport processes, including those mediated by SGLT1 [1]. Proper oxygenation is therefore not merely a supportive measure but a prerequisite for the viability of the ex vivo tissue and the accuracy of glucose absorption kinetics.
Application Note: A balanced carbogen gas mixture (95% O₂, 5% CO₂) is superior to 100% oxygen. The inclusion of CO₂ is critical for maintaining the pH of the bicarbonate-buffered incubation solution (e.g., Krebs-Ringer Buffer) within the physiological range of 7.2-7.4.
Protocol: Continuous Oxygenation of Incubation Media
- Preparation: Pre-equilibrate the incubation buffer (e.g., Krebs-Ringer Bicarbonate buffer) by bubbling with carbogen (95% O₂/5% CO₂) for at least 20 minutes prior to the experiment. This saturates the buffer with oxygen and stabilizes the pH.
- Setup: Utilize a heated water bath or jacketed incubation chamber to maintain the buffer temperature at 37°C.
- Continuous Supply: During the incubation of jejunal sacs, maintain a gentle, continuous stream of carbogen into the incubation vessel. A gas dispersion tube with a fine porosity frit is recommended to produce small bubbles, maximizing the surface area for gas exchange.
- Monitoring: The oxygenation setup should ensure that the media remains a vibrant, pink-red color, indicating a oxygenated state of the phenol red indicator, corresponding to a physiological pH.
Temperature: Maintaining Metabolic Homeostasis
Background: Temperature directly governs all enzymatic and transport processes. Deviations from core body temperature can significantly alter glucose absorption rates, as demonstrated in avian models where heat stress (35°C vs. 25°C) induced severe intestinal structural damage and dysfunction [50]. Furthermore, a study on murine small intestine showed that anatomical and molecular adaptations support increased nutrient uptake capacity during late pregnancy, a process dependent on normal physiological temperature [28].
Application Note: A thermostatically controlled system is non-negotiable. The use of a recirculating water bath or an electronically heated chamber with active feedback control is essential to prevent the temperature fluctuations common in passive heating blocks.
Protocol: Precision Temperature Control for Jejunal Sacs
- Calibration: Regularly verify the temperature of the incubation medium itself using a calibrated thermometer, not just the setting of the heating unit.
- Rapid Transfer: Following dissection and sac preparation, transfer the tissues to the pre-warmed, oxygenated buffer as quickly as possible to minimize thermal shock and preserve ATP levels.
- Consistent Environment: Maintain the entire experimental workflow, including tissue dissection baths and solution reservoirs, at 37°C. The use of pre-warmed instruments can further prevent local cooling of the tissue.
Osmolarity: Preserving Epithelial Integrity
Background: The osmolarity of the incubation medium must closely match that of plasma (~290-310 mOsm/kg) to prevent net water movement into or out of the enterocytes. Hypotonic solutions cause cell swelling and rupture, while hypertonic solutions lead to cell shrinkage and can disrupt tight junctions, adversely affecting both transcellular and paracellular transport pathways [1].
Application Note: While Krebs-Ringer formulations are standard, their osmolarity can vary with batch preparation. Always verify the final osmolarity empirically, as the addition of glucose, drugs, or test compounds will alter the total osmolarity.
Protocol: Preparation and Validation of Iso-osmotic Buffers
- Preparation: Use high-purity reagents and distilled/deionized water to prepare the buffer stock solution according to a standardized, published recipe.
- Measurement: Measure the osmolarity of the final prepared buffer using a vapor pressure or freezing-point depression osmometer.
- Adjustment: If necessary, adjust the osmolarity to the target of 300 mOsm/kg by adding small amounts of solid NaCl (to increase) or distilled water (to decrease). Re-measure after each adjustment.
- Documentation: Record the final, measured osmolarity for every experiment as a critical quality control parameter.
Table 1: Summary of Key Physiological Parameters and Optimization Targets
| Parameter | Physiological Target | Experimental Implementation | Consequence of Deviation |
|---|---|---|---|
| Oxygenation | Arterial pO₂ > 80 mmHg | Continuous bubbling with 95% O₂ / 5% CO₂ | Cellular hypoxia; loss of active transport; reduced tissue viability. |
| Temperature | 37°C (Mammalian) | Heated chamber with feedback control & pre-warmed solutions | Altered kinetics of transporters and enzymes; loss of barrier function. |
| Osmolarity | 290-310 mOsm/kg | Empirical measurement & adjustment of incubation buffer | Cell swelling/shrinkage; disruption of tight junctions. |
| pH | 7.2 - 7.4 | Use of HCO₃⁻ buffer equilibrated with 5% CO₂ | Altered protein function and transporter activity. |
Integrated Experimental Workflow
The optimization of individual parameters must be integrated into a cohesive experimental timeline. The following diagram and protocol outline the complete workflow from sac preparation to data collection.
Diagram Title: Integrated Workflow for Ex Vivo Jejunal Sac Experiment
Detailed Protocol: Glucose Absorption Assay Using Jejunal Sacs Adapted from the methodology utilized in Frontiers in Nutrition [27]
Objective: To measure the active absorption of glucose from the mucosal to the serosal side of the intestine.
Reagents & Materials:
- Krebs-Ringer Bicarbonate (KRB) Buffer, pH 7.4
- Carbogen gas (95% O₂ / 5% CO₂)
- Glucose and radio-labeled tracer (e.g., 3H- or 14C-glucose) or other detection probe
- Dissection toolkit (scissors, forceps)
- Surgical silk suture
- Temperature-controlled incubation chamber with gas dispersion tubes
- Syringes and needles
Procedure:
- Sac Preparation: Euthanize the animal according to approved ethical guidelines. Rapidly dissect out the proximal jejunum (the primary site of glucose absorption [28] [1]) and place it in ice-cold, oxygenated KRB buffer. Flush the lumen thoroughly with the same buffer to remove intestinal contents. Cut the segment into 1-2 cm lengths.
- Sac Formation: Evert each intestinal segment if necessary, or simply tie off one end with suture. Carefully fill the sac with a pre-warmed, oxygenated KRB buffer (the serosal solution) using a syringe. The volume should be sufficient to slightly distend the tissue. Tie off the top end to create a closed, fluid-filled sac.
- Pre-incubation: Place the prepared sacs into a flask containing a large volume of oxygenated KRB buffer at 37°C (the mucosal solution). Pre-incubate for 5-10 minutes with continuous carbogen bubbling to allow the tissue to equilibrate and recover from the dissection process.
- Experimental Incubation: Transfer each sac to an individual incubation vessel (e.g., a 50 ml conical tube) containing a known volume of fresh, warm, oxygenated KRB buffer supplemented with the experimental treatment (e.g., glucose, inhibitory compounds, digested proteins [27]). Maintain vigorous carbogen bubbling and temperature control throughout the incubation period (typically 30-60 minutes).
- Sampling: At the end of the incubation period, carefully remove the sac from the vessel. Gently blot it dry and puncture it with a needle. Collect the serosal fluid from inside the sac into a microcentrifuge tube.
- Analysis: Quantify the glucose concentration in the serosal fluid using an appropriate method, such as a glucose oxidase assay, HPLC, or by measuring radioactivity if a tracer was included in the mucosal solution.
The Scientist's Toolkit: Essential Reagents and Materials
Table 2: Key Research Reagent Solutions for Jejunal Sac Studies
| Item | Function / Rationale | Example / Specification |
|---|---|---|
| Krebs-Ringer Bicarbonate (KRB) Buffer | Provides physiological levels of essential ions (Na⁺, K⁺, Ca²⁺, Mg²⁺, Cl⁻) and pH buffering via HCO₃⁻/CO₂. | Must be equilibrated with 5% CO₂ to maintain pH 7.4. |
| Carbogen Gas (95% O₂ / 5% CO₂) | Serves as the source of oxygen for tissue respiration and carbon dioxide for pH homeostasis. | Medical grade; used with gas dispersion tubes for efficient bubbling. |
| D-Glucose | The primary substrate for studying absorption kinetics via SGLT1 and GLUT2 transporters. | High-purity grade; prepare a stock solution in KRB for consistent dosing. |
| Phlorizin | A specific, competitive inhibitor of the SGLT1 transporter. Used as a pharmacological tool to confirm active transport mechanisms. | Typically used at 0.1-0.5 mM concentration in the mucosal solution. |
| Sodium Butyrate | A short-chain fatty acid that can improve intestinal barrier integrity and mitigate oxidative stress, as shown in heat-stress models [50]. | Can be added to the serosal solution at 0.5-1.0 g/kg diet equivalent. |
The reliability of data generated from ex vivo jejunal sac models is inextricably linked to the meticulous maintenance of a physiological milieu. By systematically implementing the protocols described herein for the control of oxygenation, temperature, and osmolarity, researchers can significantly enhance the validity and reproducibility of their findings in glucose absorption research. This rigorous approach provides a robust platform for the screening of novel compounds, the study of macronutrient interactions, and the advancement of therapeutic strategies for metabolic diseases.
Addressing Age and Growth-Related Variations in Transport Capacity
Within the broader thesis investigating ex vivo glucose absorption, this application note addresses a critical confounding variable: age and growth-related variations in nutrient transport capacity. A comprehensive understanding of these physiological changes is essential for researchers and drug development professionals designing and interpreting studies involving jejunal sacs and other ex vivo intestinal models. This document synthesizes current experimental data into actionable protocols and quantitative references to control for age-related effects, thereby enhancing the reliability of research outcomes in pharmacokinetics and nutrient absorption studies.
Quantitative Data on Age-Related Variations
Data from independent studies consistently demonstrate that the capacity for active glucose transport across the jejunal epithelium varies significantly with age and developmental stage.
Table 1: Documented Age and Growth-Related Variations in Jejunal Glucose Transport
| Study Model | Age/Growth Comparison | Key Observed Change in Transport | Associated Molecular Findings |
|---|---|---|---|
| Broiler Chickens [35] | 1-week-old vs. 5-week-old | - Significantly higher active glucose transport in 1-week-old chicks.- Glucose-induced short-circuit current (ΔIsc) was significantly greater in juveniles. | - No significant difference in mRNA expression of SGLT1, GLUT2, or Na+/K+-ATPase.- Maltase activity remained unchanged. |
| Pregnant Mice [28] | Non-pregnant vs. Late-pregnant (GD 17.5) | - Active glucose transport per unit area was similar, despite anatomical changes.- Increased total capacity via organ expansion. | - Region-specific changes in carbohydrate transporter expression (Slc5a1, Slc2a2, Slc2a5).- Heavier (20%) and longer (10%) small intestine with longer villi (18%). |
These findings highlight that functional transport capacity can change independently of transporter gene expression, emphasizing the need for functional ex vivo assays.
Experimental Protocols for Assessing Transport Capacity
The following protocols provide methodologies for direct functional assessment and molecular analysis of glucose transport, critical for characterizing age-related phenotypes.
Protocol for Ex Vivo Glucose Transport Using Ussing Chamber
This technique directly measures active, electrogenic glucose transport across intact jejunal epithelium [35].
Key Applications:
- Quantifying functional changes in glucose absorption capacity across different age groups.
- Testing the effects of pharmaceutical compounds on SGLT1-mediated transport.
Procedure:
- Tissue Preparation: Euthanize the animal humanely and according to institutional ethical guidelines. Rapidly dissect and isolate the jejunum. Flush the lumen with ice-cold, oxygenated physiological buffer (e.g., Krebs-Ringer bicarbonate solution).
- Mucosal Stripping: Open the intestinal segment longitudinally and mount it in a Ussing chamber, exposing a defined surface area of mucosa and serosa to separate hemichambers.
- Buffer Conditions: Maintain both hemichambers with identical, oxygenated buffer at 37°C. Add glucose (e.g., 10 mM) to the mucosal (luminal) hemichamber.
- Electrophysiological Measurement: Measure the short-circuit current (Isc) continuously. The addition of glucose to the mucosal side will activate SGLT1, leading to an increase in Isc (ΔIsc). This ΔIsc is a direct indicator of active electrogenic glucose transport.
- Validation: Confirm the specificity of the response by adding a specific SGLT1 inhibitor (e.g., phlorizin) to the mucosal compartment, which should abolish the glucose-induced ΔIsc.
Protocol for Molecular Analysis of Transporter Expression
This protocol supports the functional data by quantifying mRNA expression of key glucose transporters [28] [51].
Key Applications:
- Correlating functional transport changes with transcriptional regulation of SGLT1/Slc5a1 and GLUT2/Slc2a2.
- Determining regional specificity of transporter expression along the duodenum-jejunum-ileum axis.
Procedure:
- Tissue Collection: Following dissection, snap-freeze jejunal segments (and other intestinal regions if required) in liquid nitrogen. Store at -80°C until analysis.
- RNA Isolation: Homogenize tissue samples and extract total RNA using a commercial reagent (e.g., Trizol). Treat with DNase to remove genomic DNA contamination.
- cDNA Synthesis: Reverse transcribe equal amounts of RNA (e.g., 1 μg) into cDNA using a high-efficiency reverse transcription kit.
- Quantitative PCR (qPCR):
- Perform reactions in triplicate using SYBR Green or TaqMan chemistry.
- Use validated, intron-spanning primers for target genes (e.g., Slc5a1, Slc2a2, Slc2a5) and reference housekeeping genes (e.g., β-Actin, 36B4).
- For absolute quantification, use a standard curve generated from plasmids containing the specific cDNA amplicon [51].
- Analyze data using the ΔΔCt method for relative quantification or standard curves for absolute copy number determination.
Experimental Workflow and Signaling Pathways
The following diagrams outline the core experimental workflow and the primary molecular pathway involved in jejunal glucose absorption.
Diagram 1: Experimental workflow for assessing age-related variations in jejunal glucose transport, integrating functional and molecular analyses.
Diagram 2: Key pathway for active glucose absorption in the jejunum, mediated by SGLT1 and GLUT2 transporters.
The Scientist's Toolkit: Research Reagent Solutions
Table 2: Essential Materials for Jejunal Glucose Absorption Studies
| Item | Function/Application in Research |
|---|---|
| Ussing Chamber System | Core apparatus for measuring real-time, active electrogenic ion and nutrient transport across intact epithelial tissues [35]. |
| Oxygenated Krebs-Ringer Bicarbonate Buffer | Physiological solution to maintain tissue viability and electrophysiological function during ex vivo experiments. |
| D-Glucose / D-Maltose | Substrates for assessing SGLT1-mediated transport and disaccharidase-dependent absorption pathways [35]. |
| Phlorizin | Specific, high-affinity inhibitor of SGLT1; used to validate the mechanism of observed glucose transport. |
| RNA Isolation Reagent (e.g., Trizol) | For high-quality total RNA extraction from snap-frozen intestinal segments for downstream molecular analysis [28] [51]. |
| Quantitative PCR Kit (SYBR Green / TaqMan) | For precise quantification of mRNA expression levels of nutrient transporters (e.g., Slc5a1, Slc2a2) and housekeeping genes. |
| Validated qPCR Primers | Primer sets designed for absolute or relative quantification of specific glucose transporter mRNAs [51]. |
Within the context of ex vivo glucose absorption measurement using jejunal sacs, a fundamental challenge is the accurate interpretation of data to distinguish between active, transporter-mediated uptake and passive, paracellular diffusion. Understanding the contribution of each pathway is crucial for elucidating the complete mechanism of nutrient absorption, the impact of dietary interventions, and the efficacy of pharmaceutical compounds. Active transport mechanisms, such as those mediated by the Sodium-glucose cotransporter 1 (SGLT1), are characterized by their saturability, ion-dependence, and specificity. In contrast, passive paracellular diffusion occurs through the tight junctions between epithelial cells, driven by concentration gradients and solvent drag, and is generally non-saturable and less specific [52] [2]. This application note provides detailed protocols and data interpretation frameworks for researchers aiming to deconvolute these pathways using jejunal sac preparations.
Experimental Approaches for Pathway Discrimination
A combination of strategic experimental designs and specific pharmacological agents is required to dissect the contributions of active and passive transport. The key approaches are summarized in the table below.
Table 1: Experimental Approaches for Discriminating Glucose Absorption Pathways
| Experimental Approach | Mechanism Investigated | Key Methodological Feature | Interpretation of Positive Result |
|---|---|---|---|
| Ion Replacement | Active, SGLT1-mediated transport | Replacement of luminal Na+ with a non-transportable cation (e.g., NMDG or K+) [32] [2] | Significant reduction in glucose uptake indicates a Na+-dependent active process. |
| Pharmacological Inhibition | Active, SGLT1-mediated transport | Application of a specific SGLT1 inhibitor (e.g., Phloridzin) to the mucosal solution [32] [53] | Inhibition of glucose uptake confirms the involvement of SGLT1. |
| Paracellular Probe Use | Passive, paracellular diffusion | Co-incubation with a non-metabolizable, hydrophilic probe of similar size to glucose (e.g., Mannitol, 182 Da) [52] | Increased probe absorption indicates enhanced paracellular permeability, which may also facilitate glucose diffusion. |
| Substrate Specificity & Saturation | Active, transporter-mediated transport | Measurement of uptake kinetics using substrates with different affinities (e.g., glucose vs. fructose) or across a range of concentrations [52] [35] | Saturable kinetics and specificity for glucose over fructose indicate carrier-mediated transport. |
The following diagram illustrates the logical workflow for applying these approaches to interpret data from jejunal sac experiments.
Detailed Ex Vivo Jejunal Sac Protocol for Assessing Glucose Transport
This protocol, adapted from established methodologies [42] [32], details the preparation and use of everted intestinal sacs from the jejunum to study glucose absorption.
Materials and Reagents
- Laboratory Animals: Mice or chickens of desired age and physiological status (e.g., fasted or fed). All procedures must adhere to institutional animal ethics guidelines.
- Dissection Instruments: Fine scissors, forceps.
- Physiological Buffer: Oxygenated (95% O₂ / 5% CO₂) Ringer's solution or Krebs-Henseleit buffer, maintained at 37°C.
- Everting Rod: A thin, smooth glass or metal rod.
- Suture Material.
- Syringe and Blunted Catheter: For filling the everted sacs.
- Incubation Tubes: 50 mL conical tubes or similar.
- Water Bath: Shaking, set to 37°C.
- Test Solutions: Glucose dissolved in oxygenated buffer, with or without inhibitors (e.g., 10-20 mM Phloridzin). Mannitol solution for paracellular assessment.
Step-by-Step Methodology
Tissue Dissection:
- Euthanize the animal according to approved protocols.
- Open the abdominal cavity and swiftly locate the small intestine.
- Identify the jejunal segment (typically the middle section of the small intestine).
- Excise a segment of jejunum (e.g., 4-8 cm in length) and immediately place it in ice-cold, oxygenated buffer.
Preparation of Everted Sacs:
- Gently flush the lumen of the isolated segment with buffer to remove any contents.
- Carefully slide one end of the segment onto a fine everting rod.
- Secure the proximal end with a suture, and gently evert the entire segment by pushing the distal end over the rod, turning the mucosal surface outward.
- Slide the everted intestine off the rod. Tie one end with a suture to create a closed sac.
- Using a syringe and blunted catheter, fill the sac with 0.5-2.0 mL of pre-warmed, oxygenated incubation buffer containing your test substances (e.g., glucose, mannitol, inhibitor).
- Tie the open end securely with a second suture to create a sealed sac. Ensure the sac is taut but not over-distended.
Incubation and Sampling:
- Place each prepared sac into an individual incubation tube containing 15-20 mL of oxygenated, pre-warmed serosal buffer.
- Incubate the tubes in a shaking water bath at 37°C for a predetermined time (e.g., 30-120 minutes).
- At the end of the incubation period, remove the sacs from the tubes.
- Carefully puncture the sac and collect the serosal fluid from inside.
- Also collect samples from the mucosal (external) solution.
Sample Analysis:
- Analyze the glucose concentration in both the serosal and mucosal samples using a glucose oxidase assay, glucose meter, or HPLC.
- If using a radioactive tracer (e.g., ¹⁴C-glucose), measure the radioactivity using a scintillation counter.
- For paracellular studies, analyze mannitol concentration using a specific assay kit [52].
Data Interpretation and Analysis
Calculating Apparent Permeability (Papp)
The apparent permeability coefficient can be calculated to quantify and compare transport rates [42].
Papp = (δQ/δt) / (A * C₀)
Where:
- δQ/δt is the slope of the cumulative amount of compound in the receiver compartment (serosal side) versus time (in seconds).
- A is the surface area of the intestinal tissue (in cm²).
- C₀ is the initial concentration of the compound in the donor compartment (mucosal side).
Representative Quantitative Data
The following table synthesizes quantitative findings from key studies that have utilized these principles to distinguish glucose absorption pathways.
Table 2: Representative Data from Glucose Absorption Studies
| Experimental Condition | Model System | Key Quantitative Finding | Interpretation |
|---|---|---|---|
| Glucose vs. Fructose Ingestion | Human in vivo (Urinary excretion) [52] | Mannitol excretion: 0.52 ± 0.27 g (Glucose solution) vs. 0.39 ± 0.13 g (Fructose solution). A 33% increase. | Glucose, but not fructose, enhances paracellular absorption of a mannitol probe, likely via SGLT1-activated opening of tight junctions. |
| Phloridzin Inhibition | Broiler Chicken Jejunum (Ussing chamber) [53] | Phloridzin suppressed glucose-induced current in 1-wk-old chicks (P=0.016) but not in 5-wk-old chickens. | Active, SGLT1-mediated glucose uptake is significant in young chicks but decreases with growth, suggesting a developmental shift in absorption mechanisms. |
| Fasting (48h) vs. Fed | Mouse Jejunum (Ussing chamber) [2] | Robust glucose-induced current observed in jejunum of fasted mice, but little to no current under fed conditions. | Fasting upregulates functional SGLT1 activity in the jejunum, indicating dynamic, segment-specific regulation of active transport. |
The Scientist's Toolkit: Essential Reagents for Pathway Investigation
Table 3: Key Research Reagents for Investigating Glucose Transport Pathways
| Reagent / Tool | Function / Mechanism of Action | Application in Experiments |
|---|---|---|
| Phloridzin | A potent and specific competitive inhibitor of SGLT1. Binds to the glucose binding site on the transporter, blocking Na+-glucose cotransport [32] [53]. | Applied to the mucosal solution to selectively inhibit and quantify the contribution of SGLT1-mediated active glucose uptake. |
| Mannitol | A non-metabolizable, hydrophilic sugar alcohol (182 Da) that is passively absorbed via the paracellular route [52]. | Used as a probe to assess tight junction permeability. An increase in its absorption indicates enhanced paracellular flux. |
| N-Methyl-D-Glucamine (NMDG) | A large, non-transportable organic cation used to replace Na+ in physiological buffers [53] [2]. | Used in ion-replacement studies to eliminate the Na+ gradient that drives SGLT1 activity, thereby isolating the active transport component. |
| Ouabain | A specific inhibitor of Na+/K+-ATPase, the primary pump that maintains the basolateral Na+ gradient [53]. | Applied to the serosal side to indirectly inhibit SGLT1 by dissipating the transcellular Na+ gradient, confirming the energy dependence of uptake. |
| FITC-Dextran | A fluorescent-labeled polysaccharide. Available in various molecular weights (e.g., 4.4 kDa) to probe the sieving properties of the paracellular pathway [42]. | Provides a sensitive, quantifiable marker for assessing intestinal barrier integrity and permeability to larger molecules. |
The interplay of these pathways under different physiological conditions is complex. The following diagram summarizes the key cellular mechanisms of glucose absorption and the points of action for critical reagents.
Beyond the Sac: Correlating Findings with Ussing Chamber and In Vivo Models
The study of intestinal electrogenic transport, particularly for nutrients like glucose, is a cornerstone of physiological and pharmacological research. The everted sac technique and the Ussing chamber system are two foundational ex vivo methods used to investigate these transport processes. The choice between them dictates the type and quality of data that can be obtained, from cumulative absorption to real-time functional kinetics. This application note provides a detailed comparative analysis of these two methodologies, focusing on their application in measuring sodium-glucose linked transport (SGLT1-mediated) in the jejunum. We summarize key quantitative data in structured tables, provide detailed protocols for key experiments, and visualize the core workflows and biological pathways to serve as a practical guide for researchers and drug development professionals.
Core Principle and Quantitative Comparison
The everted sac technique, a classic method pioneered in the 1950s, involves inverting a segment of the intestine to expose the mucosal surface to the oxygenated incubation medium. Glucose transport is typically measured by quantifying its accumulation in the serosal fluid over time, often using glucose meters or spectrophotometric assays [32] [35]. In contrast, the Ussing chamber allows for the measurement of electrogenic transport in real-time. When glucose is transported via SGLT1, sodium ions are co-transported into the enterocyte, generating a current across the epithelium. This change in short-circuit current (ΔIsc) is a direct, sensitive measure of active, electrogenic transport [54] [2].
The table below summarizes the fundamental characteristics and typical outcomes of both methods as evidenced by recent research.
Table 1: Comparative Analysis of the Everted Sac and Ussing Chamber Techniques
| Feature | Everted Sac Technique | Ussing Chamber System |
|---|---|---|
| Primary Measured Parameter | Cumulative glucose concentration in serosal fluid over time [5] [35]. | Change in short-circuit current (ΔIsc, µA/cm²) upon glucose challenge [54] [2]. |
| Type of Data | End-point, cumulative absorption. | Real-time, kinetic function. |
| Tissue Viability Assessment | Indirect, inferred from results. | Direct, via baseline potential difference and resistance [55]. |
| Key Experimental Readouts | - Glucose transport rate across regions [35]- Inhibitor effects on cumulative uptake [32]. | - Kinetics of glucose-induced ΔIsc [56] [54]- Regional variation (duodenum, jejunum, ileum) [54] [2]- Dose-response to glucose & inhibitors [54]. |
| Reported Glucose Response | Higher serosal glucose in proximal jejunum of 1-week-old chicks vs. 5-week-old [35]. | ΔIsc significantly higher in distal jejunum vs. duodenum and ileum at 45 mM glucose [54]. |
| Inhibition Profile | Phlorizin (SGLT1 inhibitor) decreases glucose accumulation [32]. | Phlorizin causes dose-dependent reduction in glucose-induced ΔIsc [54]. |
| Physiological Insight | Identifies net absorption capacity and regional differences [35]. | Reveals dynamic regulation (e.g., by fasting [2] or ovarian cycle [54]). |
Detailed Experimental Protocols
Protocol for the Everted Sac Experiment
This protocol is adapted from studies investigating glucose absorption in rodent and chicken jejunum [32] [5] [35].
Materials:
- Krebs-Ringer Bicarbonate (KRB) Buffer: The standard physiological salt solution, gassed with carbogen (95% O₂ / 5% CO₂).
- D-Glucose Solution: Prepared in KRB buffer; 25-45 mM concentrations are typical for challenging the tissue.
- Phlorizin: A specific SGLT1 inhibitor, used to confirm the active transport component (e.g., 0.1-0.5 mM).
- Animal Jejunum Tissue: Typically from mice, rats, or chickens. The jejunum is dissected immediately after euthanasia.
Procedure:
- Tissue Preparation: Euthanize the animal following approved ethical guidelines. Rapidly dissect and isolate the jejunum. Gently flush the lumen with ice-cold, oxygenated KRB buffer to remove intestinal contents.
- Eversion: Carefully slide a glass rod or blunt-ended tool into the intestinal segment. Grip one end with forceps and invert the tissue over the rod, effectively turning it inside out to expose the mucosal epithelium.
- Sac Formation: Tie one end of the everted segment with surgical suture. Fill the sac (serosal space) with a small volume (e.g., 0.5-1 mL) of oxygenated KRB buffer (with or without glucose). Tie off the other end to create a closed, fluid-filled sac.
- Incubation: Place the prepared sacs into incubation flasks containing oxygenated KRB buffer with the desired concentration of D-glucose (mucosal solution). Maintain the system at 37°C with continuous oxygenation and gentle shaking for a set period (e.g., 30-60 minutes).
- Sample Collection: After incubation, carefully retrieve the sacs. Puncture the sac and collect the serosal fluid.
- Glucose Quantification: Measure the glucose concentration in the serosal fluid using a glucose meter [32] or other analytical methods (e.g., glucose oxidase assay). Compare to initial levels to determine the net mucosal-to-serosal transport.
Protocol for the Ussing Chamber Experiment
This protocol is optimized for measuring active glucose transport in mouse jejunum, as described in recent studies [54] [2].
Materials:
- Ussing Chamber System: Including chambers, voltage/current clamps, and data acquisition software (e.g., systems from Physiologic Instruments) [55].
- Krebs-Ringer Bicarbonate (KRB) Buffer: Gassed with carbogen (95% O₂ / 5% CO₂), maintained at 37°C.
- D-Glucose: Prepared as a concentrated stock solution for mucosal-side addition.
- D-Mannitol: Used as an osmotic balancer in the serosal solution when glucose is added to the mucosal side.
- Carbachol: A cholinergic agonist used as a positive control to confirm tissue viability and responsiveness at the end of the experiment [28] [54].
- Phlorizin: Specific SGLT1 inhibitor for mechanistic studies.
Procedure:
- Tissue Preparation & Mounting: Euthanize the mouse and rapidly excise the entire small intestine. Flush with ice-cold KRB buffer. Isolate the jejunum and strip the external muscle layers (seromuscular stripping) to minimize smooth muscle contribution [2]. Open the segment longitudinally and mount it between the two halves of the Ussing chamber, which features a defined aperture (typically 0.1-0.3 cm²).
- Chamber Setup: Add pre-warmed, oxygenated KRB buffer (with 5-10 mM glucose typically on the serosal side for energy) to both the mucosal and serosal reservoirs. The system is maintained at 37°C with continuous carbogen gassing.
- Equilibration: Voltage-clamp the tissue to 0 mV and allow it to equilibrate for approximately 20 minutes until a stable baseline short-circuit current (Isc) and transepithelial resistance (TER) are established.
- Glucose Challenge: Add a known concentration of D-glucose (e.g., 45 mM) exclusively to the mucosal reservoir. Concurrently, add an osmotically equivalent amount of D-mannitol to the serosal reservoir to prevent fluid shifts.
- Data Acquisition: Record the resulting change in short-circuit current (ΔIsc). The ΔIsc is calculated as the difference between the peak current reached within a few minutes after glucose addition and the baseline current just before addition [54].
- Viability & Inhibition Checks:
- Viability Test: After the glucose response, add carbachol (e.g., 100 µM) to the serosal side. A robust increase in Isc confirms tissue viability and receptor responsiveness.
- Mechanistic Confirmation: In parallel experiments, pre-treat or co-treat the mucosal side with phlorizin (e.g., 0.2-0.4 mM) to confirm the SGLT1-specific component of the ΔIsc.
Visualizing the Workflows and Biology
The following diagrams, generated using DOT language, illustrate the core experimental workflows and the underlying biological mechanism of electrogenic glucose transport.
Electrogenic Glucose Transport Mechanism
Experimental Workflow Comparison
The Scientist's Toolkit: Key Research Reagent Solutions
The table below lists essential reagents and materials used in these experiments, along with their critical functions.
Table 2: Essential Reagents and Materials for Ex Vivo Glucose Transport Studies
| Reagent / Material | Function / Application | Key Considerations |
|---|---|---|
| Krebs-Ringer Bicarbonate (KRB) Buffer | Physiological salt solution mimicking extracellular fluid; provides ions and pH balance for tissue viability. | Must be continuously gassed with carbogen (95% O₂ / 5% CO₂) to maintain pH at ~7.4. |
| Phlorizin | A potent and specific natural inhibitor of SGLT1. | Used to confirm the active, sodium-dependent component of glucose transport in both techniques [32] [54]. |
| D-Mannitol | An osmotically active sugar alcohol that is poorly absorbed. | Used in Ussing chambers as an osmotic balancer when adding glucose to the mucosal side, preventing water flux-induced artifacts [54]. |
| Carbachol | A cholinergic agonist that stimulates chloride secretion in intestinal epithelia. | Serves as a positive control in Ussing chambers to confirm tissue viability and responsiveness at the experiment's conclusion [28] [54]. |
| EasyMount Ussing Chamber & VCC MC8 Clamp | Commercial system for precise electrophysiological measurements. | Provides controlled temperature, gas exchange, and automated voltage-clamping for high-fidelity ΔIsc and TER data [55]. |
Correlating Ex Vivo Absorption with Oral Glucose Tolerance Tests In Vivo
Within the framework of a broader thesis on ex vivo glucose absorption measurement, this application note provides a detailed protocol for directly correlating data obtained from jejunal sac preparations with in vivo oral glucose tolerance tests (OGTTs). The small intestine's capacity to absorb glucose is highly plastic, responding to physiological states such as fasting, feeding, and pregnancy [28] [2]. This plasticity necessitates robust experimental models that can bridge the gap between isolated tissue function and whole-organism physiology. The everted intestinal sac technique, a classic ex vivo preparation, allows for the precise investigation of transporter kinetics and regulation under controlled conditions. However, extrapolating these findings to predict an entire organism's glycemic response requires a carefully designed and integrated experimental approach. This document outlines standardized methodologies for performing these correlated studies, aiming to provide researchers with a reliable framework to validate ex vivo findings against the complex endocrine and neural responses captured by an in vivo OGTT.
Background and Scientific Rationale
Glucose absorption in the small intestine is primarily mediated by the sodium-glucose cotransporter 1 (SGLT1) on the apical membrane of enterocytes. This electrogenic process, first described by Crane, couples the transport of two sodium ions with one glucose molecule, utilizing the sodium gradient established by the basolateral Na+/K+ ATPase [57] [32]. The absorbed glucose then exits the cell via facilitative glucose transporters (GLUT2) on the basolateral membrane.
The regulation of this absorptive capacity is complex and segment-specific. For instance, studies in mice have shown that the jejunal response to glucose is dynamic; while minimal SGLT1-mediated current is detected in the jejunum of ad libitum-fed mice, a robust absorptive capacity is unmasked after a 24- to 48-hour fast [2]. This indicates that the jejunum possesses a potent mechanism for up- and down-regulation of glucose absorption in response to nutritional status. Furthermore, physiological states such as pregnancy induce significant anatomical adaptations, including an increase in small intestinal weight, length, and villus height, which collectively increase the organ's absorptive surface area and capacity [28].
The oral glucose tolerance test (OGTT) is a cornerstone in vivo method for assessing systemic glucose handling. It measures the body's integrated response to a glucose load, encompassing intestinal absorption, incretin hormone secretion (e.g., GLP-1 and GIP), pancreatic insulin release, and peripheral tissue glucose disposal [58]. The "incretin effect"—the phenomenon whereby oral glucose elicits a greater insulin response than isoglycemic intravenous administration—highlights the critical role of gut-derived signals [58]. Surgical interventions like ileal interposition, which enhances nutrient delivery to the distal ileum, demonstrate the profound impact of gut anatomy on glucose homeostasis, leading to improved glucose tolerance and enhanced GLP-1 secretion independent of weight loss [59].
Therefore, correlating ex vivo absorption data with in vivo OGTT outcomes allows researchers to:
- Determine whether changes in transporter function observed in isolated tissues translate to measurable physiological effects.
- Dissect the relative contributions of intestinal absorption versus post-absorptive mechanisms (e.g., insulin sensitivity) to overall glycemic control.
- Evaluate the therapeutic potential of compounds or interventions aimed at modulating intestinal glucose uptake.
Integrated Experimental Workflow
The following section outlines a sequential workflow for conducting correlated ex vivo and in vivo studies. The diagram below illustrates the key stages and decision points in this integrated experimental approach.
Key Experimental Protocols
Protocol 1: In Vivo Oral Glucose Tolerance Test (OGTT)
The OGTT provides a whole-system readout of glucose homeostasis and is a critical benchmark for validating ex vivo findings.
Materials:
- Experimental animals (e.g., C57BL/6 mice)
- Glucose solution (e.g., 1.25 g/kg of 25% dextrose)
- Blood collection tubes containing EDTA, aprotinin, and a DPP-4 inhibitor [59]
- Glucometer or glucose analyzer
- Equipment for tail snip or retro-orbital bleeding
Procedure:
- Fasting: Fast animals for a defined period (e.g., 6-16 hours) with ad libitum access to water. Note: Fasting duration significantly influences jejunal SGLT1 activity and must be standardized [2].
- Baseline Blood Sample (t=0): Collect a blood sample via tail snip or other appropriate method. Measure baseline blood glucose and, if possible, plasma insulin and active GLP-1.
- Glucose Gavage: Orally administer the glucose load using a gavage needle. The standard dose for mice is 1.25 - 2.0 g/kg body weight [59].
- Serial Blood Sampling: Collect subsequent blood samples at scheduled time points (e.g., 15, 30, 60, 90, and 120 minutes post-gavage).
- Sample Processing: Centrifuge blood samples immediately to separate plasma. Stabilize samples for hormone analysis (e.g., add DPP-4 inhibitor for GLP-1 measurement) and store at -80°C until assay.
- Data Analysis: Plot a glucose and/or insulin curve over time. Calculate the Area Under the Curve (AUC) for glucose and insulin using the trapezoidal rule to provide a single metric for glucose tolerance and insulin response [59] [58].
Protocol 2: Ex Vivo Glucose Absorption Using Everted Jejunal Sacs
The everted sac preparation directly measures the functional capacity of the intestinal epithelium to absorb glucose.
Materials:
- Krebs-Ringer bicarbonate (KRB) buffer, gassed with 95% O₂ / 5% CO₂
- Glucose
- Phloridzin (SGLT1 inhibitor)
- Ouabain (Na+/K+ ATPase inhibitor)
- Surgical instruments
- Water bath maintained at 37°C
- Oxygen source
- Glucometer or glucose assay kit
Procedure:
- Tissue Collection: Euthanize the animal and perform a laparotomy. Excise the entire small intestine rapidly.
- Eversion: Flush the intestine with ice-cold KRB buffer to remove luminal contents. Carefully slide the intestine onto a chilled glass rod and evert it, turning the mucosal surface outward [32].
- Sac Preparation: Divide the everted intestine into segments (typically 3-4 cm in length). Tie one end of each segment, fill it with a pre-warmed, oxygenated serosal solution (e.g., KRB buffer with or without glucose), and tie off the other end to create a closed sac.
- Incubation: Place each filled sac into a separate incubation flask containing a pre-warmed, oxygenated mucosal solution (KRB buffer with a known concentration of glucose, e.g., 25 mM). Incubate the flasks in a shaking water bath at 37°C for a set time (e.g., 30-60 minutes) with continuous oxygenation.
- Sample Collection: After incubation, remove the sacs. Gently blot and weigh them. Puncture the sac and collect the serosal fluid. Analyze the glucose concentration in the serosal fluid (post-incubation) and the mucosal fluid (pre- and post-incubation) using a glucometer or glucose assay kit.
- Data Calculation: Glucose transport can be expressed as the rate of glucose appearance in the serosal compartment (µmol/cm/hour) or the change in glucose concentration in the mucosal compartment.
Experimental Variations for Mechanistic Insight:
- Sodium Dependence: Replace NaCl in the KRB buffer with an equimolar concentration of choline chloride or mannitol.
- SGLT1 Inhibition: Add phloridzin (e.g., 0.1-0.5 mM) to the mucosal solution.
- ATPase Inhibition: Add ouabain (e.g., 1 mM) to the serosal solution [32].
Data Presentation and Analysis
Quantitative Data from Model Systems
The following tables summarize key quantitative findings from various experimental models relevant to glucose absorption, providing a reference for expected outcomes.
Table 1: Anatomical and Functional Adaptations in the Small Intestine During Pregnancy in Mice
| Parameter | Non-pregnant Mice | Late-pregnant Mice (GD 17.5) | Change | P-value |
|---|---|---|---|---|
| Small Intestinal Weight | Baseline | +20% | Increase | < 0.001 |
| Small Intestinal Length | Baseline | +10% | Increase | 0.027 |
| Villus Length | Baseline | +18% | Increase | < 0.001 |
| Active Glucose Transport (per unit area) | Baseline | Similar | No Change | N.S. |
Data adapted from Overduin et al. (2025) [28]. N.S.: Not Significant.
Table 2: Impact of Fasting and Diet on Jejunal Glucose Absorption in Mice
| Experimental Condition | Effect on Jejunal Glucose-Induced Isc (SGLT1 activity) | Key Molecular Finding |
|---|---|---|
| Ad Libitum Fed (Standard Diet) | Little to no activity observed [2] | Low SGLT1 protein in brush border membrane [2] |
| 24-48 Hour Fasting | Robust increase in activity observed [2] | Increased SGLT1 expression in brush border membrane [2] |
| High Glucose Diet (60%, 3 days) | Suppressed activity in jejunum [2] | SGLT1-mediated transport confined to ileum [2] |
Correlation Analysis
To establish a direct correlation, plot the ex vivo glucose transport rate (from Protocol 2) for each animal against its corresponding in vivo OGTT AUC value (from Protocol 1). A positive correlation would suggest that inter-individual variations in intestinal absorptive capacity are a key determinant of systemic glucose tolerance. A weak or absent correlation indicates that other factors, such as incretin effects, insulin sensitivity, or hepatic glucose metabolism, are dominant. Statistical significance can be assessed using Pearson or Spearman correlation coefficients.
The Scientist's Toolkit: Key Research Reagents
The following table lists essential reagents and their critical functions in these experiments.
Table 3: Essential Research Reagents for Glucose Absorption Studies
| Reagent / Material | Function / Application | Experimental Context |
|---|---|---|
| Phloridzin | Potent and specific inhibitor of SGLT1. Used to confirm the active, Na+-dependent component of glucose absorption. | Ex vivo everted sac and Ussing chamber studies [32]. |
| Ouabain | Specific inhibitor of the basolateral Na+/K+ ATPase. Depletes the Na+ gradient, thereby inhibiting SGLT1 function. | Ex vivo everted sac studies to demonstrate coupling to Na+ gradient [32]. |
| DPP-4 Inhibitor | Prevents the rapid degradation of active GLP-1 (7-36) amide in blood samples, allowing for accurate measurement. | In vivo OGTT for incretin hormone analysis [59]. |
| Krebs-Ringer Bicarbonate (KRB) Buffer | Physiological salt solution, maintained with 95% O₂ / 5% CO₂, providing a proper ionic and pH environment for tissue viability. | Ex vivo intestinal preparations (everted sacs, Ussing chambers) [32]. |
| GLP-1 ELISA Kit | Quantifies plasma levels of glucagon-like peptide-1, a key incretin hormone that enhances glucose-stimulated insulin secretion. | In vivo OGTT follow-up analysis [59]. |
Mechanistic Insights and Advanced Applications
Understanding the molecular machinery behind glucose absorption provides deeper context for the data generated. The following diagram illustrates the key transporters and regulatory pathways involved in intestinal glucose uptake, many of which can be probed using the protocols described.
Pathway Notes:
- Core Transport (Solid lines): The canonical pathway involves SGLT1-mediated apical uptake and GLUT2-mediated basolateral efflux, driven by the Na+ gradient from Na+/K+ ATPase and membrane potential maintained by Kv channels [57].
- Regulatory Pathways (Dashed line): Under high luminal glucose concentrations, GLUT2 can be rapidly inserted into the apical membrane, providing a secondary, high-capacity absorption route [57]. The activity of SGLT1 is influenced by the membrane potential, which is regulated by potassium channels (e.g., KCNQ1). Inhibition of these channels can depolarize the cell, reducing the driving force for Na+-coupled glucose uptake and improving glucose tolerance [57].
This integrated ex vivo and in vivo approach is highly applicable in preclinical drug development. For example, the antidiabetic effects of natural extracts like Myrtle Berry Seed Aqueous Extract (MBSAE) have been linked to the inhibition of jejunal glucose absorption, a mechanism that can be conclusively demonstrated using Ussing chamber experiments and subsequently confirmed by improved glucose tolerance in diabetic animal models [17]. Similarly, this correlative strategy is essential for validating the mechanisms of new anti-obesity drugs that target intestinal nutrient absorption without severely disrupting the balance of other nutrients [57].
The study of intestinal glucose absorption is pivotal for understanding nutrient metabolism and developing therapeutics for metabolic disorders such as diabetes and obesity. Ex vivo models, particularly the everted jejunal sac preparation, have long served as a foundational tool for investigating absorptive processes in a near-physiological context [32]. This model preserves the native cellular architecture, nerve supply, and blood flow, allowing for the direct assessment of transporter kinetics and the effects of luminal compounds. A key strength of this system is its ability to provide direct evidence for sodium-dependent active transport, as demonstrated by its use in teaching the fundamental principles of Na+/glucose cotransport (SGLT1) for over five decades [32].
However, to dissect molecular mechanisms at the cellular level, bridge findings to human physiology, and enable higher-throughput screening, researchers must transition to in vitro cellular models. The human intestinal epithelial cell lines Caco-2 and HT-29, especially when used in co-culture, have emerged as a powerful and reductionist system that recapitulates many key features of the intestinal barrier [60] [61]. This application note details the rationale and methodologies for bridging research from ex vivo jejunal sac studies to sophisticated co-culture models of the human intestine, with a specific focus on applications in glucose absorption research.
Model Systems: A Comparative Analysis
The following table summarizes the core characteristics of the ex vivo and in vitro models discussed, highlighting their complementary strengths and applications.
Table 1: Comparison of Model Systems for Studying Intestinal Glucose Absorption
| Feature | Everted Jejunal Sac (Ex Vivo) | Caco-2/HT29-MTX Co-culture (In Vitro) |
|---|---|---|
| Physiological Relevance | High; maintains intact tissue structure, enteric nerves, and blood flow [32] | Moderate; mimics human intestinal epithelium with polarized cells and tight junctions [60] [61] |
| Key Applications | Confirming sodium-dependency of transport, measuring transmural flux, teaching core physiology [32] | Screening compound effects (e.g., nutrients, drugs), studying transporter expression/regulation, permeability studies [60] [27] |
| Throughput | Low | Moderate to High |
| Technical Complexity | Moderate, requires animal surgery | Moderate, requires cell culture expertise and extended differentiation time (2-3 weeks) [61] |
| Species Origin | Typically rodent (e.g., mouse, rat) [32] | Human |
| Mucus Layer | Native mucus present | Present via secretion by HT29-MTX cells [61] |
| Key Glucose Transporters | SGLT1, GLUT2 [32] | SGLT1, GLUT2, GLUT1 [60] |
Establishing the Caco-2/HT29-MTX Co-culture Model
The Caco-2 cell line spontaneously differentiates into enterocyte-like cells, while the HT29-MTX cell line, when adapted to methotrexate, differentiates into mucus-producing goblet cells. Their co-culture creates a more physiologically relevant intestinal model than Caco-2 monocultures [61].
Protocol: Co-culture Setup and Differentiation for Transport Studies
Materials:
- Caco-2 cells (e.g., from Sigma-Aldrich or ATCC)
- HT29-MTX cells (e.g., from Sigma-Aldrich)
- Dulbecco's Modified Eagle Medium (DMEM) with high glucose (4.5 g/L or 25 mM) [60] [27]
- Supplementation: 10-20% Fetal Bovine Serum (FBS), 1% Non-Essential Amino Acids (NEAA), 1% L-glutamine, and 1% penicillin/streptomycin [60] [27]
- Tissue culture flasks and transwell inserts (e.g., 3.0 μm pore polyester membrane)
Procedure:
- Maintenance Culture: Grow Caco-2 and HT29-MTX cells separately in complete DMEM at 37°C in a 10% CO₂ [60] or 5% CO₂ [27] humidified atmosphere. Passage cells at ~80% confluence.
- Co-culture Seeding:
- Trypsinize and count both cell lines.
- Mix Caco-2 and HT29-MTX cells at a desired ratio. A 90:10 (Caco-2:HT29-MTX) ratio is a common starting point to form a confluent epithelium with a representative mucus layer [61].
- Seed the cell mixture onto the apical compartment of transwell inserts at a density of ~250,000 cells per 4.2 cm² insert [27].
- Add culture medium to both the apical and basolateral compartments.
- Differentiation:
- Culture the cells for at least 21 days, changing the medium every 2-3 days.
- To induce and maintain differentiation, culture the cells in serum-free medium on the apical side and supplemented medium on the basolateral side for the final two weeks [27].
- Monitor the formation of tight junctions by regularly measuring the Transepithelial Electrical Resistance (TEER) until stable, high values are obtained (typically >300 Ω×cm²).
The following workflow diagram illustrates the key steps in establishing and using this co-culture model for glucose absorption studies.
Experimental Applications and Quantitative Findings in Co-culture Models
The Caco-2/HT29-MTX co-culture system is highly versatile for investigating the effects of various compounds on intestinal function. Recent studies have quantified the impacts of fruit extracts and dietary proteins on glucose transport and barrier function.
Table 2: Quantitative Effects of Bioactive Compounds in Caco-2/HT29-MTX Models
| Intervention | Experimental Setup | Key Quantitative Findings | Biological Implication |
|---|---|---|---|
| Fruit Juice Extracts [60] | Treatment of co-culture with XAD7-enriched extracts | Chokeberry extract most effectively reduced transcription of GLUT1, GLUT2, and antioxidant genes CAT/SOD. Goji berry, elderberry, and apple copigment fractions showed the best barrier regeneration. | Polyphenol-rich extracts can directly modulate glucose transporter expression and improve barrier integrity, varying by source. |
| Dietary Proteins (Digested) [27] | Apical pre-incubation of Caco-2/TC7 monolayers with 5 mg/ml digested proteins for 1h | Digested proteins (e.g., casein, fish gelatin, pea) reduced glucose uptake in vitro. Acute ingestion in rats improved glucose tolerance and decreased GLUT2 mRNA in enterocytes. | Peptides from protein digestion are key regulators of intestinal glucose absorption, partly via GLUT2 modulation. |
The Scientist's Toolkit: Essential Research Reagents
Success in glucose absorption studies relies on a specific toolkit of reagents and assays. The table below details key solutions for probing transporter activity and cellular metabolism.
Table 3: Key Research Reagent Solutions for Glucose Uptake Studies
| Reagent / Assay | Function / Principle | Key Characteristics |
|---|---|---|
| 2-Deoxy-D-Glucose (2DG) [62] | Glucose analog; transported into cells and phosphorylated (trapped). Measured via radiolabeled (³H, ¹⁴C) or colorimetric kits. | Gold standard for unidirectional glucose uptake. Not further metabolized. |
| 2-NBDG [63] [64] | Fluorescent glucose analog (2-[N-(7-Nitrobenz-2-oxa-1,3-diazol-4-yl)amino]-2-deoxy-D-glucose). | Enables real-time, single-cell analysis via flow cytometry or microscopy. Can have non-specific background [64]. |
| 6AzGal with Click Chemistry [64] | Azide-tagged galactose analog (6-azido-6-deoxy-D-galactose) taken up by GLUTs. Labeled via copper-free click reaction with BDP-DBCO. | High accuracy, low background. Ideal for complex ex vivo and in vivo single-cell analyses with immunophenotyping. |
| Cytochalasin B & WZB-117 [64] | Pharmacological inhibitors of glucose transporters (GLUTs). | Used to confirm GLUT-specific uptake. Cytochalasin B is an endofacial inhibitor; WZB-117 is an exofacial inhibitor. |
| INFOGEST Digestion Protocol [27] | Standardized in vitro simulated gastrointestinal digestion (salivary, gastric, intestinal phases). | Critical for preparing physiologically relevant food digesta (e.g., proteins) to test their effects on absorption. |
Detailed Experimental Protocols
Protocol: Glucose Uptake Assay Using 2-NBDG
This protocol adapts the use of fluorescent glucose analogs for the co-culture model, allowing for the quantification of glucose transporter activity [63].
Materials:
- Differentiated Caco-2/HT29-MTX co-culture on transwell inserts
- 2-NBDG (e.g., from Thermo Fisher)
- Hanks' Balanced Salt Solution (HBSS) or glucose-free buffer
- Test compounds (e.g., digested proteins, plant extracts)
- Flow cytometer or fluorescent plate reader
Procedure:
- Pre-incubation: Wash the differentiated co-cultures with pre-warmed glucose-free buffer. Pre-treat the apical side with your test compound dissolved in buffer for a predetermined time (e.g., 1 hour [27]).
- Uptake Phase: Replace the apical medium with glucose-free buffer containing a defined concentration of 2-NBDG (e.g., 100-200 μM [63]) and the test compound. Incubate at 37°C for a set time (e.g., 15-45 minutes).
- Termination: Stop the uptake by placing the inserts on ice and washing the cells thoroughly with ice-cold PBS containing a GLUT inhibitor (e.g., phlorizin) to remove all extracellular 2-NBDG.
- Analysis:
- For Flow Cytometry: Trypsinize the cells, resuspend in cold PBS, and analyze immediately. The median fluorescence intensity corresponds to the rate of glucose uptake.
- For Fluorescence Microscopy: Fix the cells and image directly on the membrane.
Protocol: Gene Expression Analysis of Glucose Transporters
Understanding the molecular effects of interventions requires analyzing transporter expression levels [60] [27].
Materials:
- TRIzol or other RNA extraction kit
- cDNA synthesis kit
- Quantitative PCR (qPCR) system
- Primers for genes of interest (e.g., GLUT2, SGLT1, CAT, SOD) and housekeeping genes.
Procedure:
- Treatment and Lysis: After treatment, lyse the cells directly in the transwell insert using an appropriate lysis buffer.
- RNA Extraction: Extract total RNA following the manufacturer's instructions. Ensure RNA integrity and purity.
- cDNA Synthesis and qPCR: Synthesize cDNA from equal amounts of RNA. Perform qPCR using gene-specific primers.
- Data Analysis: Calculate relative gene expression using the 2^(-ΔΔCt) method, normalizing to housekeeping genes and comparing to the control group.
The following diagram outlines the core decision-making process for selecting the appropriate glucose uptake assay based on research goals.
Assessing Predictive Value for Bioavailability and Drug Absorption
Within drug development, bioavailability is defined as the extent and rate at which an active drug substance enters systemic circulation, thereby accessing the site of action [65]. Intestinal permeability is a principal determinant of oral drug absorption and a critical parameter in the Biopharmaceutics Classification System (BCS) [65]. While in vivo human studies are the gold standard, ex vivo and in situ models provide valuable predictive tools that bridge the gap between simple in vitro assays and complex, costly clinical trials [65].
This application note details the use of the ex vivo everted gut sac model, a technique that preserves the intact intestinal epithelium, including its metabolic enzymes and transporter proteins [65]. Framed within broader research on glucose absorption, this protocol provides a validated methodology for assessing the permeability and absorption kinetics of new chemical entities, focusing on the rodent jejunum.
Background and Principles
Key Concepts: Bioaccessibility vs. Bioavailability
A compound's journey from ingestion to systemic effect involves several key stages:
- Bioaccessibility (BC): The fraction of a compound released from its matrix and made available for intestinal absorption after gastrointestinal digestion [33].
- Bioavailability (BA): The fraction of an administered compound that reaches systemic circulation unchanged and can exert a bioactive effect [33].
The everted gut sac model directly investigates the crucial step linking these two: intestinal absorption.
The Everted Gut Sac Model in Context
The everted gut sac is a well-established ex vivo preparation used to study intestinal absorption and metabolism [65]. Its key features and advantages include:
- Preserved Physiology: Maintains the intact intestinal mucosa, including tight junctions, mucus layer, and a full complement of drug-metabolizing enzymes and uptake/efflux transporters [65].
- Segmental Specificity: Allows for investigation of region-dependent absorption (e.g., duodenum, jejunum, ileum) [65].
- Direct Measurement: Enables quantification of both mucosal-to-serosal transport and tissue uptake, providing insights into permeation mechanisms [65].
As research into functional foods and peptide-based drugs advances, this model is particularly relevant for studying the absorption of biomolecules whose bioefficiency may be affected by digestion and transport processes [33].
Materials and Reagents
Research Reagent Solutions
| Item | Function/Description |
|---|---|
| Krebs-Bicarbonate Ringer (KBR) Buffer | Standard physiological buffer for ex vivo intestinal studies; provides ions and nutrients for tissue viability [47]. |
| Oxygen-Carbon Dioxide Gas Mixture (95% O₂ / 5% CO₂) | Constant oxygenation maintains tissue viability and metabolic activity during experiment [47]. |
| Serosal Fluid (e.g., KBR) | The solution inside the sac (serosal side); sampled to determine the quantity of drug that has been absorbed. |
| Mucosal Fluid (e.g., KBR + Drug) | The solution bathing the outside of the sac (mucosal side); contains the test compound(s) at a defined concentration. |
| Test Compound | The drug or nutrient whose absorption is being investigated (e.g., glucose, peptides, new chemical entities). |
| Chemical Permeation Enhancers (CPEs) | Agents (e.g., surfactants) used in formulation strategies to improve absorption of low-permeability actives [66]. |
Experimental Protocol: Everted Jejunal Sac for Glucose Absorption
This protocol is adapted from established methodologies [65] and contextualized for investigating glucose absorption, as explored in related research [41].
Reagent Preparation
- Krebs-Bicarbonate Ringer (KBR) Buffer: Prepare containing 120 mM NaCl, 5.5 mM KCl, 2.5 mM CaCl₂, 1.2 mM MgCl₂, 1.2 mM NaH₂PO₄, 20 mM NaHCO₃, and 11 mM glucose. Adjust to pH 7.4 and continuously oxygenate with 95% O₂ / 5% CO₂ [47].
- Mucosal (Donor) Solution: Dissolve the test compound (e.g., glucose or a drug of interest) in the pre-oxygenated KBR buffer. For studies involving digested proteins, supernatants from the INFOGEST protocol can be used as the donor solution [41].
- Serosal (Receiver) Solution: Use oxygenated KBR buffer without the test compound.
Sac Preparation and Mounting
- Tissue Isolation: Euthanize the rodent (e.g., rat or mouse) following approved ethical guidelines. Immediately excise the small intestine, with careful attention to the jejunal segment.
- Eversion: Gently flush the intestinal segment with ice-cold, oxygenated KBR to remove luminal contents. Carefully evert the jejunal segment over a glass rod or silicone tube, turning the mucosal surface outward.
- Sac Formation: Cut the everted intestine into 3-4 cm segments. Tie one end of each segment with surgical suture. Fill the resulting sac with serosal solution using a syringe. Tie off the other end to create a closed, fluid-filled sac.
- Incubation: Immerse each prepared sac in a separate flask containing the mucosal solution. Maintain constant oxygenation with 95% O₂ / 5% CO₂ and incubate in a water bath at 37°C with gentle shaking.
Sample Collection and Analysis
- Serial Sampling: At predetermined time intervals (e.g., every 15 minutes for up to 120 minutes), withdraw a specific volume (e.g., 100 µL) from the serosal fluid inside the sac.
- Replacement: After each sampling, replace the volume with fresh, pre-warmed, and oxygenated serosal solution to maintain a constant hydrostatic pressure.
- Termination: At the end of the experiment, drain the serosal fluid completely and record the final volume. The sac tissue can be blotted dry and weighed for normalization or further analysis (e.g., molecular biology).
- Analytical Quantification: Analyze the collected serosal samples and the initial/final mucosal solutions using an appropriate technique (e.g., HPLC, LC-MS/MS for drugs; glucose oxidase assay for glucose) to determine the concentration of the test compound.
Data Analysis and Interpretation
Key Calculated Parameters
The following quantitative parameters can be derived from the experimental data to assess absorption.
| Parameter | Formula / Description | Application / Interpretation |
|---|---|---|
| Apparent Permeability Coefficient (Papp) | P_app = (dQ/dt) / (A * C₀) Where: dQ/dt = transport rate (mol/s); A = tissue surface area (cm²); C₀ = initial donor concentration (M) [47]. |
Standardizes absorption rates for comparison between compounds; higher Papp indicates greater permeability. |
| Serosal Transfer Rate | Cumulative amount of compound appearing in the serosal compartment over time (e.g., µmol/min/cm²) [65]. | Direct measure of the rate of compound absorption across the intestinal tissue. |
| Tissue Uptake | Amount of compound retained within the intestinal tissue itself at the end of the experiment (e.g., µmol/g tissue) [65]. | Indicates potential interaction with tissue, metabolism, or binding. |
| Mucosal-to-Serosal Transport Ratio | (Concentration in Serosa / Initial Concentration in Mucosa) over time. | A simple ratio to compare the relative absorption efficiency between different treatment groups or compounds. |
Investigating Transport Mechanisms
The model can be used to probe specific transport pathways, such as those for glucose:
- SGLT1-Mediated Transport: Perform experiments in the presence of a specific SGLT1 inhibitor like phlorizin. A significant reduction in glucose Papp indicates active, carrier-mediated uptake.
- GLUT2-Mediated Transport: Investigate the contribution of the facilitative glucose transporter GLUT2, whose expression can be modulated by dietary components [41].
Workflow and Pathway Visualization
The following diagram summarizes the key stages of the everted gut sac experiment, from tissue preparation to data analysis.
Diagram 1: Experimental workflow for the everted gut sac model.
The absorption of glucose in the jejunum involves specific transport proteins, as illustrated below.
Diagram 2: Key transporters in jejunal glucose absorption.
Model Validation and Comparison
Quantitative Data from Literature
The predictive power of ex vivo models is benchmarked against human absorption data.
| Compound / Model | Measured Permeability (Papp or Peff) | Correlation with Human Absorption | Key Findings |
|---|---|---|---|
| Ex Vivo Porcine Jejunum (Ussing Chamber) [47] | Papp,pig for various transporter substrates | Good correlation with human Peff,human | Validated activity of 7 clinically relevant apical/basolateral drug transporters (e.g., PEPT1, P-gp). |
| Caco-2 Cell Model [67] | Papp,Caco2 (in vitro) | Poorly correlative data for some transporters | Limited by cancer origin and non-physiological transporter expression compared to human intestine. |
| Digested Proteins & Glucose Uptake (Caco-2/TC7) [41] | Inhibition of 14C-AMG uptake | Inferred reduction in human glucose absorption | Casein, fish gelatin, and other digested proteins decreased glucose uptake, suggesting a role in modulating absorption. |
Advantages and Limitations
Advantages:
- More physiologically relevant than simple cell monolayers due to the presence of intact mucosa, mucus, and functional enzymes/transporters [65].
- Allows for direct control of experimental conditions and easy sampling.
- More ethically acceptable and less costly than in vivo studies, aligning with the 3Rs principles [67].
Limitations:
- Lacking neuronal inputs, hormonal cues, and blood flow present in vivo [65].
- Tissue viability is limited post-excision (typically 2-4 hours).
- Inter-species differences (e.g., rat vs. human) must be considered when extrapolating data.
The ex vivo everted gut sac model is a robust and predictive tool for assessing the intestinal absorption and permeability of new chemical entities and nutrients like glucose. When integrated into a broader research strategy that may include in vitro digestion (e.g., INFOGEST) and other ex vivo systems like the Ussing chamber, it provides critical insights into bioavailability. Its ability to preserve the native tissue architecture and biochemical machinery makes it invaluable for de-risking drug development and understanding fundamental absorption mechanisms.
In the study of glucose absorption and the development of antidiabetic therapeutics, reliance on any single experimental model can lead to incomplete or misleading conclusions. The intricate physiology of the intestinal barrier, with its complex transport mechanisms and cellular composition, demands a research approach that integrates multiple methodologies [68]. This application note provides a consolidated framework for employing a multi-method strategy, centered on the ex vivo jejunal sac model, to generate robust, translatable data on glucose absorption mechanisms and modulation. By systematically correlating data from in vitro, ex vivo, and in vivo models, researchers in drug development can de-risk the pipeline and strengthen the evidence for novel therapeutic mechanisms, such as the inhibition of intestinal sodium-glucose cotransporters (SGLT1) [17] [27].
Key Quantitative Findings from Integrated Models
The following table synthesizes quantitative outcomes from various studies that employed a multi-method approach to investigate the modulation of jejunal glucose absorption, providing a clear comparison of key findings.
Table 1: Key Quantitative Findings from Integrated Glucose Absorption Studies
| Intervention / Model | Key Measured Outcome | Result | Significance/Implication | Citation |
|---|---|---|---|---|
| Myrtle Berry Seeds Aqueous Extract (MBSAE) | Glucose-induced short-circuit current (ex vivo, mice jejunum) | Significant reduction | Suggests direct inhibition of glucose absorption, potentially via SGLT1 modulation. | [17] |
| Myrtle Berry Seeds Aqueous Extract (MBSAE) | Plasma Glucose (in vivo, alloxan-induced diabetic rat) | Significant reduction | Confirms systemic antidiabetic effect of the extract. | [17] |
| Digested Dietary Proteins (e.g., Casein) | Glucose tolerance (in vivo, Wistar rat) | Improved tolerance without affecting insulin secretion | Points to a gut-mediated mechanism for improved glucose homeostasis. | [27] |
| Digested Dietary Proteins | GLUT2 mRNA expression in enterocytes (in vitro) | Decreased expression | Identifies a potential molecular mechanism for reduced glucose absorption. | [27] |
| Engineered Small Intestine (Chicken Jejunum) | Apparent Permeability (Papp) of glucose (ex vivo) | Papp(B-A): 1.36 ± 0.37 × 10⁻⁵ cm/s | Provides a quantitative baseline for glucose permeability in an alternative ex vivo model. | [69] |
Detailed Experimental Protocols
This section outlines detailed methodologies for the key experiments cited, providing a practical guide for researchers to replicate and build upon this integrated approach.
Protocol for Ex Vivo Jejunal Sac Preparation and Glucose Transport Measurement
This protocol is adapted from procedures used to study the effects of digested proteins and plant extracts on glucose absorption [27] [69].
Principle: Excised segments of the jejunum are fashioned into sacs filled with a glucose-containing buffer. The transport of glucose from the mucosal (inner) to the serosal (outer) side is then quantified over time.
Materials:
- Animals: Adult Wistar rats (typically 150-250g), fasted for 16 hours.
- Dissection Tools: Surgical scissors, fine forceps, suture silk.
- Buffers: Ice-cold Krebs-Ringer Bicarbonate (KRB) buffer or Krebs-Henseleit buffer, oxygenated with carbogen (95% O₂, 5% CO₂) [69].
- Test Compound: Digested protein samples [27] or plant extract [17] dissolved in buffer.
- Tracer: ³H-D-glucose or ¹⁴C-α-methyl-D-glucopyranoside (14C-AMG) [27].
- Equipment: Water bath maintained at 37°C, oxygen supply, scintillation counter.
Procedure:
- Tissue Isolation: Sacrifice the fasted rat according to approved ethical guidelines. Immediately open the abdominal cavity and locate the small intestine. Identify the proximal jejunum (the segment immediately following the duodenum).
- Excision and Flushing: Gently dissect out a 10-15 cm length of the jejunum. Place it in a petri dish containing ice-cold, oxygenated KRB buffer. Carefully flush the lumen with the same buffer to remove intestinal contents.
- Sac Preparation: Cut the jejunal segment into smaller, uniform sections (e.g., 2-4 cm in length). Gently slide each section onto a glass rod. Tie off one end with suture silk to create a blind sac.
- Sac Filling: Using a syringe with a blunt needle, fill each sac with 0.3-0.5 mL of the pre-warmed, oxygenated KRB buffer containing the test compound (e.g., digested proteins at 31.25 mg/mL) and the isotopic glucose tracer (e.g., 0.02 μCi/mL) [27].
- Incubation: Securely tie the open end of the filled sac. Place each sac in an individual incubation flask containing 10-20 mL of oxygenated KRB buffer without glucose. Continuously oxygenate the flask and incubate in a shaking water bath at 37°C for a predetermined time (e.g., 40-60 minutes).
- Sample Collection: After incubation, carefully remove the sac from the flask. Gently blot it dry. Puncture the sac and collect the serosal fluid from inside.
- Analysis: Quantify the radioactivity in the serosal fluid using a scintillation counter. Normalize the results to the protein content of the tissue or the initial mucosal glucose concentration. Apparent permeability (Papp) can be calculated using established formulas [69].
Protocol for In Vitro Glucose Uptake in Caco-2/TC7 Cell Monolayers
This protocol complements ex vivo findings by providing a high-throughput human-cell-based model to screen compounds [27].
Principle: Differentiated Caco-2/TC7 cell monolayers on permeable filters mimic the human intestinal epithelium. The uptake of a radiolabeled glucose analog from the apical side is measured in the presence and absence of the test compound.
Materials:
- Cell Line: Caco-2/TC7 cells.
- Culture Ware: 4.2 cm² transwell inserts with microporous (3 μm) PET membranes.
- Media: Dulbecco's Modified Essential Medium (DMEM) with high glucose and supplements.
- Uptake Buffer: Non-supplemented DMEM or Hanks' Balanced Salt Solution (HBSS).
- Substrate: 2 mM α-methyl-D-glucopyranoside (AMG) and 0.2 μCi/mL ¹⁴C-AMG.
- Inhibitor: 0.5 mM phlorizin in cold PBS (to stop uptake).
- Test Compound: Digested proteins or extracts (e.g., 5 mg/mL for pre-incubation) [27].
Procedure:
- Cell Culture and Differentiation: Seed Caco-2/TC7 cells at a density of 250,000 cells per transwell insert. Culture for 2-3 weeks, changing the medium regularly, to allow for full differentiation and polarization into an enterocyte-like monolayer.
- Pre-incubation: Pre-incubate the cell monolayers for 1 hour at 37°C with the test compound dissolved in the uptake buffer on the apical side.
- Uptake Phase: Replace the apical buffer with a fresh uptake buffer containing both the test compound, 2 mM AMG, and the tracer ¹⁴C-AMG. Incubate for a specific time (e.g., 40 minutes).
- Termination: Stop the uptake by washing the cells three times with ice-cold PBS containing 0.5 mM phlorizin, a specific SGLT1 inhibitor.
- Lysis and Scintillation Counting: Solubilize the cells in a lysis buffer (e.g., Solvable). Transfer the lysate to a scintillation vial, add scintillation cocktail, and measure the radioactivity. Normalize the counts to the total protein content of the lysate (determined by a BCA assay).
The Scientist's Toolkit: Essential Research Reagents & Materials
Table 2: Key Research Reagent Solutions for Jejunal Glucose Absorption Studies
| Reagent / Material | Function / Application | Example & Notes |
|---|---|---|
| Krebs-Ringer Bicarbonate (KRB) Buffer | Physiological salt solution for ex vivo organ bath experiments; maintains tissue viability and ionic balance. | Must be continuously oxygenated with carbogen (95% O₂ / 5% CO₂) to maintain physiological pH and oxygen levels [27] [69]. |
| α-methyl-D-glucopyranoside (AMG) | Non-metabolizable glucose analog used to specifically study SGLT1-mediated transport. | Transported by SGLT1 but not by GLUT2, allowing for isolated study of apical uptake. Often used in radiolabeled form (¹⁴C-AMG) [27]. |
| Phlorizin | Potent and specific competitive inhibitor of SGLT1. | Used as a pharmacological tool to confirm SGLT1 involvement in transport studies and to stop uptake assays [27]. |
| Simulated Intestinal Fluids (SIF) | Biorelevant digestion medium for in vitro pretreatment of protein samples or other test compounds. | Prepared according to standardized protocols (e.g., INFOGEST) to simulate the ionic composition and enzymes of the human gut [27] [69]. |
| Caco-2/TC7 Cell Line | Well-established in vitro model of the human intestinal epithelium. | Forms polarized monolayers with brush border enzymes and functional transporters (SGLT1, GLUT2), ideal for high-throughput screening [27]. |
| Ussing Chamber System | An ex vivo technique to measure real-time ion and nutrient transport across intact intestinal epithelium. | Directly measures the electrogenic component of glucose transport (via SGLT1) as a change in short-circuit current (Isc) [17]. |
Visualizing the Integrated Workflow and Mechanism of Action
The following diagrams, created using DOT language and compliant with the specified color and contrast guidelines, illustrate the core experimental workflow and the primary molecular mechanism under investigation.
Integrated Research Workflow
Glucose Transport Mechanism in Enterocytes
Conclusion
The everted jejunal sac technique remains a cornerstone method for the direct, cost-effective investigation of intestinal glucose absorption mechanisms. Its strength lies in its ability to delineate active, transporter-mediated uptake from passive diffusion, providing crucial insights for nutritional science and drug development, particularly for diabetes management. Future directions should focus on standardizing protocols across laboratories, further integrating this ex vivo data with sophisticated in vitro organoid models and in vivo findings, and expanding its application to explore the impact of gut microbiome metabolites and complex food matrices on glucose absorption. This will solidify its role in the development of next-generation therapeutic and nutritional interventions.
References
- 1. Mechanisms of Glucose in the Small Intestine in Health... Absorption [https://pmc.ncbi.nlm.nih.gov/articles/PMC8308647/]
- 2. Regulatory mechanisms of glucose absorption in the ... [https://www.nature.com/articles/s41598-023-38024-w]
- 3. villus Jejunal and absorption tight junction permeability... paracellular [https://particleandfibretoxicology.biomedcentral.com/articles/10.1186/s12989-020-00357-z]
- 4. Quantifying Intestinal Glucose Using Isolated Vascularly... Absorption [https://bio-protocol.org/en/bpdetail?id=5514&type=0]
- 5. Lannea edulis lowers blood glucose by modulating ... [https://www.frontiersin.org/journals/pharmacology/articles/10.3389/fphar.2025.1618241/full]
- 6. The Role of SGLT1 and GLUT2 in Intestinal Glucose ... [https://pmc.ncbi.nlm.nih.gov/articles/PMC3935955/]
- 7. Regulation of Intestinal Glucose Absorption by Ion ... [https://pmc.ncbi.nlm.nih.gov/articles/PMC4728656/]
- 8. The facilitated component of intestinal glucose absorption [https://pmc.ncbi.nlm.nih.gov/articles/PMC2278489/]
- 9. The role of GLUT2 in glucose metabolism in multiple organs ... [https://pmc.ncbi.nlm.nih.gov/articles/PMC10374759/]
- 10. Unique Regulation of Na-K-ATPase during Growth and ... [https://pmc.ncbi.nlm.nih.gov/articles/PMC6628168/]
- 11. Nutrient transport in the small intestine: Na+,K+-ATPase ... [https://www.sciencedirect.com/science/article/pii/S0032579119438704]
- 12. The second sodium pump: from the function to the gene - PMC [https://pmc.ncbi.nlm.nih.gov/articles/PMC3350626/]
- 13. Robert K. Crane—Na+-glucose cotransporter to cure? - PMC [https://pmc.ncbi.nlm.nih.gov/articles/PMC3605518/]
- 14. Sodium-glucose transport proteins [https://en.wikipedia.org/wiki/Sodium-glucose_transport_proteins]
- 15. Possible Sodium and D-Glucose Cotransport in Isolated ... [https://www.nature.com/articles/pr1979454.pdf]
- 16. Active Glucose Transport 2020 and Beyond - PMC [https://pmc.ncbi.nlm.nih.gov/articles/PMC7812037/]
- 17. Modulation of Jejunal Glucose Absorption as a Central ... [https://pubmed.ncbi.nlm.nih.gov/40937515/]
- 18. Early posthatch feeding influences small intestine ... [https://pmc.ncbi.nlm.nih.gov/articles/PMC12495159/]
- 19. Applying different morphometric intestinal mucosa methods ... [https://www.sciencedirect.com/science/article/pii/S0032579123003681]
- 20. Morphometric Analysis of Developmental Alterations in the ... [https://www.mdpi.com/2076-2615/13/20/3292]
- 21. An analysis of intestinal morphology and incretin ... [https://www.nature.com/articles/s41598-022-22511-7]
- 22. Glucose absorption by isolated, vascularly perfused rat intestine [https://pmc.ncbi.nlm.nih.gov/articles/PMC11971594/]
- 23. Jejunal Glucose Absorption Is Enhanced by Epidermal ... [https://www.sciencedirect.com/science/article/pii/S0022316623057322]
- 24. Functional differentiation of human jejunum and ileum [https://pmc.ncbi.nlm.nih.gov/articles/PMC1413011/]
- 25. Delphinidin Reduces Glucose Uptake in Mice Jejunal ... [https://www.mdpi.com/1422-0067/18/4/750]
- 26. Upgrading In Vitro Digestion Protocols with Absorption ... [https://www.mdpi.com/2076-3417/14/18/8320]
- 27. An Exploratory Study of the Role of Dietary Proteins in ... [https://www.frontiersin.org/journals/nutrition/articles/10.3389/fnut.2021.769773/full]
- 28. Differential changes in anatomical, molecular and functional ... [https://pmc.ncbi.nlm.nih.gov/articles/PMC12325091/]
- 29. Effect of buffer media composition on the solubility and ... [https://www.sciencedirect.com/science/article/abs/pii/S0378517302006452]
- 30. Hyperoxia as a driver of gut dysbiosis [https://www.frontiersin.org/journals/microbiology/articles/10.3389/fmicb.2025.1675652/full]
- 31. Comparison of the effects of the intestinal permeation ... [https://www.sciencedirect.com/science/article/pii/S0928098720304735]
- 32. transport into everted Glucose of the small intestine of mice sacs [https://pubmed.ncbi.nlm.nih.gov/24292921/]
- 33. A Critical Review on In Vitro and Ex Vivo Models of the ... [https://www.mdpi.com/2624-5647/6/1/23]
- 34. Development of active jejunal glucose absorption in broiler ... [https://www.sciencedirect.com/science/article/pii/S0032579123003231]
- 35. Active transport of glucose across the jejunal epithelium ... [https://www.sciencedirect.com/science/article/pii/S0032579119301506]
- 36. 5 Ways To Get Students Interested In Intestinal Glucose ... [https://www.labster.com/blog/get-students-interested-intestinal-glucose-transport]
- 37. An enhanced glucose analysis method based on ... [https://www.sciencedirect.com/science/article/abs/pii/S1350449525003019]
- 38. Mechanisms of Glucose Absorption in the Small Intestine ... [https://www.mdpi.com/2072-6643/13/7/2474]
- 39. Glucose absorption regulation and mechanism of the ... [https://www.sciencedirect.com/science/article/abs/pii/S0278691521000442]
- 40. Involvement of an enterocyte renin–angiotensin system in ... [https://pmc.ncbi.nlm.nih.gov/articles/PMC2277173/]
- 41. An Exploratory Study of the Role of Dietary Proteins in ... [https://pmc.ncbi.nlm.nih.gov/articles/PMC8808719/]
- 42. Ex Vivo Intestinal Sacs to Assess Mucosal Permeability in ... [https://pmc.ncbi.nlm.nih.gov/articles/PMC4781746/]
- 43. Glucose Absorption - an overview [https://www.sciencedirect.com/topics/medicine-and-dentistry/glucose-absorption]
- 44. Berberine Decreases Intestinal GLUT2 Translocation and ... [https://www.mdpi.com/1422-0067/23/1/327]
- 45. Inhibition of small-intestinal sugar absorption mediated by ... [https://pmc.ncbi.nlm.nih.gov/articles/PMC4612002/]
- 46. Active glucose transport varies by small intestinal region ... [https://pubmed.ncbi.nlm.nih.gov/37022128/]
- 47. Using Ex Vivo Porcine Jejunum to Identify Membrane ... [https://pmc.ncbi.nlm.nih.gov/articles/PMC7555276/]
- 48. Sodium restriction and insulin resistance: A review of 23 ... [https://journalofmetabolichealth.org/index.php/jmh/article/view/78/242]
- 49. Acute exposure of rabbit jejunum to ethanol [https://link.springer.com/article/10.1007/BF01296262]
- 50. Sodium butyrate alleviates high ambient temperature-induced ... [https://bmcvetres.biomedcentral.com/articles/10.1186/s12917-025-04583-5]
- 51. Quantitative Analysis of Glucose Transporter mRNAs in ... [https://pmc.ncbi.nlm.nih.gov/articles/PMC3075937/]
- 52. Glucose ingestion increases passive absorption of a ... [https://pmc.ncbi.nlm.nih.gov/articles/PMC12168217/]
- 53. Development of active jejunal glucose absorption in broiler ... [https://pmc.ncbi.nlm.nih.gov/articles/PMC10404788/]
- 54. Active glucose transport varies by small intestinal region and ... [https://pmc.ncbi.nlm.nih.gov/articles/PMC10988461/]
- 55. Epithelial Transport Explained – Ussing Chamber Research [https://physiologicinstruments.com/blogs/news/epithelial-transport-explained-ussing-chamber-research?srsltid=AfmBOorD1KiJiUbeJFVdsp0qUwLkjNAfJjXq7FJXfNab2Peq97ip8Nr7]
- 56. Comparison of intestinal glucose flux and electrogenic ... [https://pubmed.ncbi.nlm.nih.gov/31746628/]
- 57. Regulation of Intestinal Glucose Absorption by Ion ... [https://www.mdpi.com/2072-6643/8/1/43]
- 58. In Vivo Models for Incretin Research: From the Intestine to ... [https://pmc.ncbi.nlm.nih.gov/articles/PMC4803560/]
- 59. Ileal interposition improves glucose tolerance and insulin ... [https://pmc.ncbi.nlm.nih.gov/articles/PMC2950685/]
- 60. The influence of fruit juice extracts on glucose intestinal ... [https://pubs.rsc.org/en/content/articlehtml/2025/fo/d4fo03950e]
- 61. Advancements in techniques for analyzing cell permeability [https://www.sciencedirect.com/science/article/pii/S2405844025022236]
- 62. Glucose Uptake Assays [https://www.revvity.com/ask/glucose-uptake-assays]
- 63. Spatially Resolved Measurement of Dynamic Glucose Uptake ... [https://pmc.ncbi.nlm.nih.gov/articles/PMC7701360/]
- 64. Post-click labeling enables highly accurate single cell ... [https://www.nature.com/articles/s42003-024-06164-y]
- 65. Ex vivo and in situ approaches used to study intestinal ... [https://www.sciencedirect.com/science/article/abs/pii/S1056871913002736]
- 66. Formulation strategies to improve the efficacy of intestinal ... [https://www.sciencedirect.com/science/article/pii/S0169409X21003185]
- 67. Drug Screening, Oral Bioavailability and Regulatory Aspects [https://pmc.ncbi.nlm.nih.gov/articles/PMC8399541/]
- 68. In Vitro and Ex Vivo Models to Study Molecular Trafficking ... [https://www.mdpi.com/1422-0067/26/21/10535]
- 69. Predicting human glucose response curve using an ... [https://www.sciencedirect.com/science/article/abs/pii/S0260877420304817]