Decoding CGM Sensor Errors: A Complete Guide to Interpretation and Resolution for Research and Clinical Trials
This article provides a comprehensive framework for researchers and drug development professionals to understand, interpret, and resolve Continuous Glucose Monitor (CGM) sensor error messages.
Decoding CGM Sensor Errors: A Complete Guide to Interpretation and Resolution for Research and Clinical Trials
Abstract
This article provides a comprehensive framework for researchers and drug development professionals to understand, interpret, and resolve Continuous Glucose Monitor (CGM) sensor error messages. It covers foundational error classifications, methodological protocols for standardized response, systematic troubleshooting strategies, and validation techniques for ensuring data integrity in clinical research settings. The guide emphasizes protocol development to minimize data loss and maintain trial validity.
Understanding CGM Sensor Errors: A Scientific Taxonomy for Research Integrity
Technical Support Center
Troubleshooting Guides
T1: "Sensor Error" / "Temporary Sensor Issue" Alert
- User-Facing Symptom: The CGM display shows a "Sensor Error" message, and glucose readings are temporarily unavailable.
- Underlying Sensor Pathology (Research Hypothesis): This generic alert often masks disruptions in the core electrochemical sensing mechanism. Primary etiologies include transient biofouling, localized ischemia at the insertion site causing a low-oxygen microenvironment, or micro-movements that temporarily distort the diffusion layer.
- Investigation Protocol:
- In-Vitro Simulation: Recreate the error in a flow cell system. Introduce controlled concentrations of common interferents (e.g., acetaminophen, ascorbic acid) or modulate dissolved O₂ levels.
- Signal Analysis: Apply Fast Fourier Transform (FFT) to the raw current signal (Iraw). Look for specific noise patterns (e.g., high-frequency spikes indicative of motion artifact vs. low-frequency drift from biofouling).
- Post-Hoc Sensor Characterization: Use scanning electron microscopy (SEM) on explanted sensors from animal models to correlate error events with physical membrane damage or cellular encapsulation.
T2: "Calibration Error" / "Unable to Calibrate"
- User-Facing Symptom: The device rejects fingerstick blood glucose (BG) values entered for calibration.
- Underlying Sensor Pathology (Research Hypothesis): A significant, non-linear deviation between the sensor's current output and the reference blood glucose value. Causes include sensor sensitivity (Slope) decay, excessive background current (Ibg) shift, or a compromised reference electrode.
- Investigation Protocol:
- Two-Point Check Calibration: In a benchtop study, measure sensor output in 100 mg/dL and 400 mg/dL reference solutions. Calculate apparent Sensitivity (nA/(mg/dL)) and Ibg.
- Compare to Baseline: Deviation >15% from the sensor's factory-determined sensitivity suggests chemical degradation of the enzyme or membrane failure.
- Reference Electrode Potentiometry: Measure the voltage stability of the Ag/AgCl reference electrode. Drift >5 mV can invalidate the working electrode's operation.
T3: "Signal Loss" or "Sensor Failed"
- User-Facing Symptom: The CGM stops transmitting data entirely.
- Underlying Sensor Pathology (Research Hypothesis): Complete failure of the electrochemical cell or the telemetry unit. This can be due to physical wire fracture, complete enzyme deactivation, loss of sensor-to-transmitter connectivity, or critical voltage drop in the transmitter battery.
- Investigation Protocol:
- Continuity & Impedance Testing: Use a multimeter to check for open circuits in the sensor filament. Perform electrochemical impedance spectroscopy (EIS) to detect extreme increases in charge-transfer resistance.
- RF Protocol Analysis: Use a software-defined radio (SDR) to monitor the 2.4 GHz ISM band for failed handshake protocols between sensor and transmitter.
- Accelerated Aging Study: Subject sensors to high temperature/humidity (e.g., 60°C, 90% RH) and track time-to-failure to model shelf-life and durability.
Frequently Asked Questions (FAQs)
Q1: In our preclinical study, multiple sensors simultaneously displayed "Sensor Error." Is this a batch defect or a systemic experimental issue? A: First, rule out environmental interferents. Were animals dosed with drugs known to cross-react (e.g., certain antibiotics, exogenous peroxides)? Check common equipment: is an MRI or diathermy device causing electromagnetic interference? Perform a control experiment with sensors in a static glucose solution. If errors persist in vitro, a batch defect in the enzyme or membrane layer is likely.
Q2: How can we quantitatively differentiate between "noise" from motion artifact and true physiological glycemia variability in raw CGM data? A: Implement a moving standard deviation filter on the first derivative of the signal (dIraw/dt). Motion artifact typically produces sharp, high-amplitude deviations over short time windows (<1 min). True physiological variation is smoother. Correlate with accelerometer data if available. The table below summarizes key metrics:
Table 1: Differentiating Signal Noise from Physiological Variation
| Metric | Motion Artifact | Physiological Variation |
|---|---|---|
| dIraw/dt | >10 nA/sec | Typically <5 nA/sec |
| Duration | Short bursts (30-90 sec) | Sustained trends (>5 min) |
| FFT Peak | High frequency (>0.1 Hz) | Low frequency (<0.05 Hz) |
| Accel. Correlation | High (r > 0.7) | Low (r < 0.3) |
Q3: What is the definitive experiment to confirm sensor biofouling as the root cause of a gradual signal drift ("Signal Degradation" alert)? A: Conduct a recovery test. After an in-vivo study, carefully explant the sensor. Gently rinse it with PBS (pH 7.4) to remove non-adherent material. Then, place it in a fresh, stirred 100 mg/dL glucose calibration solution. Measure output. If the signal returns to >90% of its Day 1 baseline, the drift was likely due to a stagnant diffusion layer (correctable). If output remains low (<70%), perform SEM/EDX analysis on the membrane to visualize protein/cellular adhesion and elemental composition changes.
Q4: Are "Check Transmitter" warnings solely a hardware problem, or can they relate to the sensor-transmitter electrochemical interface? A: While often a low-battery issue, they can indicate a failure in the potentiostat circuit within the transmitter. This circuit applies the constant voltage to the sensor and measures the tiny current. If this circuit fails, the sensor, though functional, appears "dead." To diagnose, use a reference potentiostat to apply 0.55V to the explained sensor in a glucose solution. If a normal current is generated, the fault lies in the transmitter's circuitry.
Experimental Protocol: In-Vitro Simulation of a "Sensor Error" Event
Objective: To systematically determine which physiological variable (O₂ drop, interferent, mechanical stress) most reliably triggers a "Sensor Error" alert in Model X CGM.
Materials: See The Scientist's Toolkit below. Method:
- Setup: Mount 10 new Model X sensors in a temperature-controlled (37°C) flow cell.
- Baseline: Perfuse with 100 mg/dL glucose in PBS (pO₂ ~150 mmHg) at 0.1 µL/min for 2 hours. Record stable Iraw.
- Intervention Phase (6 hours):
- Group A (Low O₂): Switch to solution saturated with 5% CO₂ / 95% N₂ (pO₂ ~40 mmHg).
- Group B (Interferent): Add 1 mg/dL acetaminophen to the standard perfusion solution.
- Group C (Mechanical Shock): Subject the flow cell to a calibrated vibration plate (50 Hz, 0.5g amplitude).
- Monitoring: Log Iraw from the sensor and record the onset time of any "Sensor Error" alert on the connected research display.
- Recovery: Return all groups to standard perfusion (Step 2) for 2 hours. Record which sensors recover to within 15% of baseline Iraw.
- Analysis: Compare mean time-to-error-alert between groups using ANOVA. Perform post-hoc EIS on all sensors.
The Scientist's Toolkit: Key Research Reagent Solutions
Table 2: Essential Materials for CGM Error Investigation
| Item | Function & Rationale |
|---|---|
| Potentiostat/Galvanostat (e.g., PalmSens4) | Applies precise voltage to sensor working electrode and measures nanoamp-level current; essential for in-vitro signal replication. |
| ISO/IEC 15197:2013 Compliant Glucose Analyzer | Provides gold-standard reference blood glucose values for calibration error studies. |
| Electrochemical Impedance Spectroscope | Non-destructively probes sensor membrane health and charge-transfer resistance to diagnose degradation. |
| Controlled Gas Mixing System | Precisely lowers dissolved O₂ in perfusion solutions to simulate tissue ischemia. |
| Proteinaceous Biofouling Solution (e.g., 4 g/dL BSA + 1 g/dL γ-Globulin in PBS) | Mimics the protein adsorption phase of the foreign body response in-vitro. |
| Scanning Electron Microscope (SEM) with EDX | Visualizes ultrastructural damage, biofilm, or membrane delamination on explanted sensors. |
Visualizations
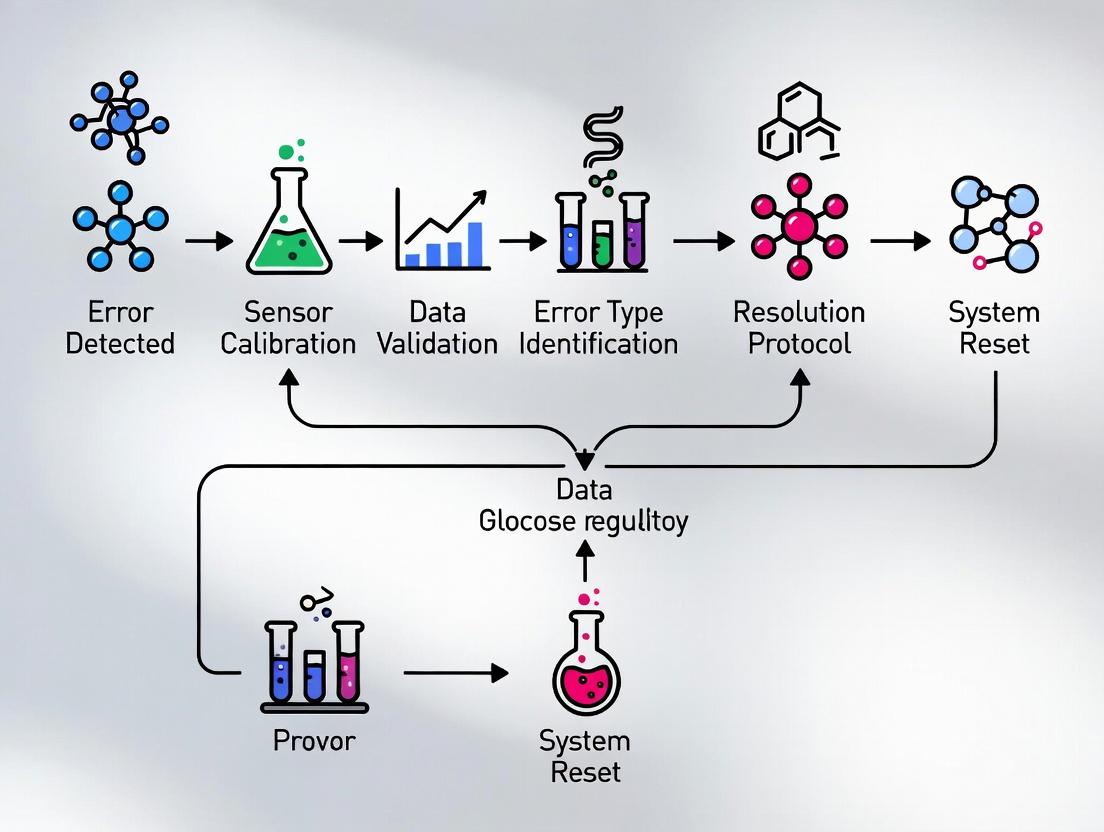
Title: Diagnostic Path from User Alert to Experimental Validation
Title: Experimental Workflow for Post-Hoc Sensor Error Analysis
Technical Support Center: Troubleshooting Guides & FAQs
Frequently Asked Questions (FAQs)
Q1: What is the primary electrochemical cause of a sudden, transient signal dropout in a continuous glucose monitoring (CGM) sensor? A1: Sudden signal dropout is often caused by a transient break in the electrochemical circuit. This can result from a momentary loss of contact between the working electrode and the hydrogel layer containing the enzyme (glucose oxidase), or from a temporary local oxygen deficit ("oxygen sink" effect). The reaction O₂ + 2H⁺ + 2e⁻ → H₂O₂ is critical; insufficient O₂ halts electron transfer, collapsing the amperometric signal.
Q2: How does "drift" differ from an acute sensor failure, and what underlying mechanisms cause it? A2: Drift is a gradual, directional change in sensor output against a reference. It is distinct from acute failure. Primary causes include:
- Biofouling: Progressive protein adsorption and cellular encapsulation on the sensor membrane, increasing diffusion resistance.
- Enzyme Degradation: Gradual loss of Glucose Oxidase (GOx) catalytic activity.
- Electrode Passivation: Slow buildup of reaction byproducts (e.g., polymeric oxides) on the electrode surface, impeding electron transfer kinetics.
Q3: What exactly causes a compression artifact, and why does it often manifest as a false low reading? A3: Compression artifacts occur when mechanical pressure is applied directly to the sensor site, typically during sleep. Pressure-induced local ischemia reduces interstitial fluid (ISF) glucose and oxygen delivery. The system is more sensitive to oxygen limitation than glucose limitation. This biases the enzymatic reaction, causing an artificially low current readout that does not reflect systemic blood glucose.
Q4: Can environmental factors besides glucose influence the sensor's electrochemical signal? A4: Yes. Common interferents include:
- Electroactive Species: Acetaminophen, ascorbic acid (Vitamin C), and uric acid can be oxidized at similar potentials as H₂O₂, producing a false-positive current.
- pH & Temperature Shifts: Enzyme kinetics and the redox potential of the working electrode are temperature and pH-dependent. Significant shifts can alter calibration.
Q5: What are the best experimental practices to isolate sensor drift from physiological variability in a research setting? A5: Employ a static in-vitro calibration bath. After in-vivo deployment, re-immerse the explained sensor in a series of known glucose concentration buffers (e.g., 0, 100, 400 mg/dL). Compare the post-explantation sensitivity (nA/(mg/dL)) and baseline to the pre-implantation values. The difference quantifies drift attributable to the sensor's state.
Troubleshooting Guides
Issue: Intermittent Signal Dropout
Step 1: Verify physical connections in your potentiostat setup (working, reference, counter electrodes). Ensure no loose cables. Step 2: Review experimental logs for concurrent environmental triggers (e.g., subject motion, temperature change). Step 3: In-vitro Benchmark Test: Perform cyclic voltammetry in a standard ferricyanide solution. A distorted or absent redox peak indicates a compromised electrode surface. Step 4: Protocol for Oxygen Dependency Test: 1. Deoxygenate a standard glucose PBS buffer by bubbling with N₂ for 30 min. 2. Record amperometric signal at +0.6V (vs. Ag/AgCl). 3. Gradually reintroduce oxygen by bubbling air. 4. A signal that recovers with O₂ reintroduction confirms an "oxygen sink" dropout.
Issue: Persistent Positive or Negative Signal Drift
Step 1: Quantify the drift rate using data from a stable reference (e.g., hourly YSI blood analyzer measurements). Step 2: Post-Explant Analysis Protocol: 1. Gently rinse explanted sensor in deionized water. 2. Image electrode surface using SEM/EDS to assess biofouling. 3. Perform Electrochemical Impedance Spectroscopy (EIS): A large increase in charge-transfer resistance (Rₐₜ) at low frequencies indicates passivation or fouling. 4. Soak sensor in a gentle detergent solution and re-run EIS. Improved Rₐₜ suggests reversible biofouling.
Issue: Suspected Compression Artifacts in Rodent Studies
Step 1: Correlate signal dips with video monitoring of subject posture. Step 2: Implement a pressure-offloading protocol: Reposition the animal or sensor site. Step 3: Experimental Control Protocol: Implant two sensors – one in a prone compression site (e.g., dorsal scapula) and one in a protected site (e.g., lateral flank). Simultaneous dips only in the prone sensor confirm a compression artifact.
Table 1: Common Interferents and Their Impact on Amperometric Signal
| Interferent | Typical Physiological Concentration | Oxidation Potential (vs. Ag/AgCl) | Potential Signal Error |
|---|---|---|---|
| Acetaminophen | 10-20 µg/mL (post-dose) | ~0.4V | High (False Positive) |
| Ascorbic Acid | 0.4-1.5 mg/dL | ~0.3V | Medium (False Positive) |
| Uric Acid | 4-6 mg/dL | ~0.4V | Low-Medium (False Positive) |
| Lactate | 5-20 mM (exercise) | >+0.8V (on Pt) | Low (with standard membrane) |
Table 2: Characteristic Electrochemical Parameters Indicating Failure Modes
| Failure Mode | Charge-Transfer Resistance (Rₐₜ) Trend | Sensitivity (nA/(mg/dL)) Trend | Calibration Shift |
|---|---|---|---|
| Biofouling Drift | ↑↑ (Large Increase) | ↓↓ (Decrease) | Negative (Output lowers) |
| Enzyme Degradation | → (Stable) | ↓↓ (Gradual Decrease) | Negative |
| Electrode Passivation | ↑ (Increase) | ↓ (Decrease) | Variable |
| Membrane Damage | ↓↓ (Decrease) | ↑↑ (Erratic Increase) | Positive (Output rises) |
The Scientist's Toolkit: Research Reagent Solutions
| Item | Function in CGM Sensor Research |
|---|---|
| Glucose Oxidase (GOx) from Aspergillus niger | The core biorecognition element. Catalyzes the oxidation of β-D-glucose to D-glucono-1,5-lactone and H₂O₂. |
| Poly(o-phenylenediamine) (PPD) | A common electropolymerized membrane. Provides size-exclusion and charge-based selectivity to reject common interferents like ascorbate and urate. |
| Nafion Perfluorinated Ionomer | A cation-exchange polymer coating. Used to repel anionic interferents (e.g., ascorbate, urate) and can stabilize the enzyme layer. |
| Potassium Ferricyanide (K₃[Fe(CN)₆]) | A standard redox probe for in-vitro electrode characterization via Cyclic Voltammetry (CV). Assesses electrode activity and surface area. |
| Phosphate Buffered Saline (PBS), pH 7.4 | The standard electrolyte for in-vitro calibration and testing, mimicking physiological ionic strength and pH. |
| Ag/AgCl Reference Electrode (with KCl electrolyte) | Provides a stable, known potential against which the working electrode's potential is controlled in a 3-electrode cell. |
| YSI 2900 Series Biochemistry Analyzer | The gold-standard bench instrument for obtaining reference glucose concentrations against which sensor performance is validated. |
Diagrams
CGM Electrochemical Signaling Pathway
Sensor Failure Analysis Workflow
Troubleshooting Guides & FAQs
Q1: What does "Sensor Error - Restart Required" mean, and how severe is its impact on a pharmacokinetic study's primary endpoint? A1: This error indicates a complete sensor failure. It is classified as a Severity Level 3 (Critical) error. It causes immediate and irreparable data discontinuity. For a PK study, if this occurs during the Tmax or Cmax window, the subject's dataset may be excluded from the per-protocol analysis, directly jeopardizing statistical power and endpoint validity.
Q2: How should a persistent "Signal Loss - Temporary" error during a glucose clamp study be handled? A2: This is a Severity Level 2 (High) error. Protocol: 1) Note the exact timestamp. 2) Attempt receiver repositioning within the protocol-defined 5-minute window. 3) If signal returns, flag the gap data and continue. 4) If loss exceeds 15 minutes, initiate calibrated backup blood glucose sampling (YSI 2900) every 5 minutes until CGM signal recovery. The gap can be partially interpolated for secondary endpoints but not for primary glycemic excursion analysis.
Q3: Are "Calibration Errors" always considered severe? A3: No, severity is context-dependent. See Table 1.
Q4: What is the protocol for a "Low Electrode Impedance" alert in an implantable sensor preclinical trial? A4: This is a Severity Level 2 (High) error for implantables, indicating potential biofouling or membrane compromise. Protocol: 1) Schedule explant at next planned timepoint. 2) Increase frequency of reference method (e.g., benchtop glucose analyzer) validation to twice daily. 3) Post-explant, perform scanning electron microscopy (SEM) on the sensor to confirm cause. Data post-alert should be weighted lower in the overall analysis.
Data Presentation Tables
Table 1: Error Severity Classification and Impact on Research Endpoints
| Error Code | Severity Level | Data Impact | Typical Resolution Window | Acceptable for Primary Endpoint? |
|---|---|---|---|---|
| Sensor Error | 3 - Critical | Complete Loss | N/A | No |
| Signal Loss | 2 - High | Gap >15 min | 15 min | Conditional* |
| Calibration Error (Post-Hoc) | 1 - Medium | Accuracy Drift | N/A (retrospective) | Yes, with flagged accuracy |
| Unstable Signal | 2 - High | Increased Noise | 60 min | No, if MARD >20% |
| Calibration Error (Single) | 0 - Low | None | Next calibration | Yes |
*Conditional: Only if gap is bridged with reference method data.
Table 2: Resolution Protocol Summary by Severity
| Severity Level | Required Action | Data Handling | Reporting Requirement |
|---|---|---|---|
| 3 - Critical | Halt experiment; replace sensor. | Exclude from primary analysis. | Major Protocol Deviation report. |
| 2 - High | Initiate backup measurement protocol. | Flag; use for secondary analysis only. | Document in clinical/study report. |
| 1 - Medium | Increase reference sampling frequency. | Apply accuracy correction algorithm. | Note in statistical analysis plan. |
| 0 - Low | Log and monitor. | Use without modification. | Internal log only. |
Experimental Protocols
Protocol: Validation of Error Impact on Mean Absolute Relative Difference (MARD) Objective: To quantify the effect of "Unstable Signal" errors on sensor accuracy.
- Setup: Place 10 CGM sensors in a controlled bioreactor with a stepped glucose clamp profile (70-300 mg/dL).
- Intervention: Introduce controlled electromagnetic interference to trigger "Unstable Signal" alerts for 30-minute intervals across 5 sensors.
- Sampling: Take reference glucose samples (via YSI 2900 Stat Plus Analyzer) every 5 minutes.
- Analysis: Calculate MARD for stable periods vs. error periods for each sensor. Perform a paired t-test (α=0.05) to determine statistical significance of MARD increase.
- Endpoint: Define the MARD threshold at which data from an error period must be excluded.
Protocol: Gap Interpolation for "Signal Loss" Objective: To validate a linear vs. spline interpolation method for short data gaps.
- Data Source: Use a dataset of 50 CGM traces with no errors (gold standard).
- Simulation: Artificially introduce 10, 15, and 20-minute gaps into each trace.
- Interpolation: Fill gaps using a) last observation carried forward, b) linear interpolation between gap endpoints, and c) cubic spline interpolation.
- Validation: Compare interpolated values to held-out gold standard values. Calculate root mean square error (RMSE) and Clarke Error Grid analysis for each method/gap length.
- Endpoint: Recommend optimal interpolation method and maximum gap length for secondary endpoint analysis.
Diagrams
Diagram 1: Error Severity Decision Tree
Diagram 2: Sensor Error Impact Workflow
The Scientist's Toolkit: Research Reagent Solutions
| Item | Function in CGM Error Research |
|---|---|
| YSI 2900 Stat Plus Analyzer | Gold-standard reference method for validating glucose concentrations during CGM error periods or for backup measurements. |
| Controlled Glucose Clamp Bioreactor | Provides a stable, programmable in-vitro environment to simulate physiological glucose changes and induce/replicate sensor errors. |
| Phosphate-Buffered Saline (PBS) with L-Ascorbic Acid | Challenge solution for in-vitro testing of sensor interference and signal stability. |
| Electromagnetic Interference (EMI) Generator | Device to systematically induce "Unstable Signal" errors in a controlled setting for impact studies. |
| Scanning Electron Microscope (SEM) | Used for post-explant analysis of failed sensors to diagnose biofouling, membrane damage, or manufacturing defects. |
| Data Interpolation Software (e.g., R, Python with SciPy) | For applying and validating linear, spline, or model-based interpolation algorithms to bridge short data gaps. |
| Clark Error Grid Analysis Software | Standard tool for assessing the clinical accuracy of CGM data, especially during/after error periods. |
Introduction This technical support center provides structured troubleshooting and methodological guidance for researchers investigating Continuous Glucose Monitor (CGM) sensor error codes. The content is framed within a thesis on developing standardized protocols for CGM error message interpretation and resolution in clinical and experimental settings.
Troubleshooting Guides & FAQs
Q1: During a clinical trial, multiple Dexcom G7 sensors display "Sensor Error" or "Temporary Sensor Issue." What are the primary research hypotheses and immediate troubleshooting steps? A: These transient errors (Dexcom error codes 9, 10) often relate to signal instability. Research hypotheses include local interstitial fluid (ISF) perturbation from the insertion trauma, transient wireless signal attenuation, or early inflammatory response. Protocol: 1) Document the time post-insertion. Errors within first 12 hours suggest insertion-related ISF disruption. 2) Verify the transmitter is firmly seated. 3) Instruct the subject to avoid compression on the sensor site. 4) Wait up to 3 hours for signal recovery before declaring a sensor failure. Data on recovery time should be recorded for correlation with subject biomarkers.
Q2: An Abbott Libre 3 sensor in a study reports "Logger Error" or fails to initialize. What is the experimental protocol to determine root cause? A: This can map to a sensor/reader communication failure. Experimental protocol: 1) Control Test: Attempt initialization with a different, validated reader device. 2) Environmental Test: Check for and document potential sources of RFID/NFC interference (e.g., other electronic equipment within 10 cm). 3) Replication: If error persists, attempt replication under controlled RF-shielded conditions to isolate the cause. Sensor lot numbers must be recorded for potential batch-related issues.
Q3: In a pharmacokinetic study, Medtronic Guardian 4 sensors frequently show "Sensor Updating" or "Calibration Error." How should researchers adjust the study protocol? A: "Sensor Updating" pauses data. "Calibration Error" (e.g., CODE 111) rejects entered values. Protocol adjustment: 1) Standardize Calibration Timing: Perform calibrations only during stable glucose periods (as indicated by fingerstick), documented with precise timestamps. 2) Implement a Tiered Response: First error: wait 15 minutes, retry with fresh capillary sample. Second consecutive error: flag the sensor for potential early replacement and note the subject's hydration status. 3) Analyze Error Clustering: Correlate errors with known drug administration peaks that may affect ISF composition.
Q4: For Senseonics Eversense XL sensors used in long-term studies, what does "Sensor Disconnected" imply, and what is the hardware troubleshooting workflow? A: This indicates loss of communication between the implanted sensor and the on-body transmitter. Workflow: 1) Verify transmitter placement and adhesion over the sensor site. 2) Charge the transmitter fully. 3) Use the manufacturer's clinician's app to check the "Sensor Vibrate" function, which confirms implant integrity. 4) If unresolved, the issue may be with the transmitter hardware, requiring a swap with a validated unit. The implant itself is passive and typically not the point of failure in this error.
Q5: How should researchers quantitatively compare sensor reliability across manufacturers in a head-to-head study? A: Create a reliability scorecard based on logged error events. Key metrics should include: Error Rate per Sensor-Day, Mean Time to Failure (MTTF), Mean Time to Recovery (MTTR), and User-Initiated Reboots/Resets. Errors should be categorized by severity (transient vs. terminal).
Table 1: Quantitative Error Code Summary & Suggested Researcher Action Data synthesized from current manufacturer technical documentation and user manuals.
| Manufacturer | Common Error Code/Message | Probable Cause (Research Context) | Recommended Researcher Action |
|---|---|---|---|
| Dexcom | "Sensor Error" (Code 9) | Signal anomaly, early inflammation phase. | Monitor for auto-recovery (≤3 hrs). Record subject's local skin temp. |
| Dexcom | "TEMPORARY SENSOR ISSUE" | Radio interference, transient compression. | Check study environment for EMI sources. Document subject activity. |
| Abbott | "Logger Error" / "Scan Error" | NFC communication failure, sensor damage. | Test with backup reader. Inspect insertion site for trauma. |
| Abbott | "Replace Sensor" | Sensor reached end of life or fatal error. | Note exact operational hours. Retrieve sensor for optional physical analysis. |
| Medtronic | "Calibration Error 111" | Unstable glucose, ISF-blood glucose mismatch. | Analyze timing relative to study drug Cmax. Use lab glucose for reference. |
| Medtronic | "Sensor Updating" | Algorithm processing delay. | Pause calibration attempts. Resume data collection after auto-clear. |
| Senseonics | "Sensor Disconnected" | Transmitter pairing/adhesion issue. | Follow hardware check protocol. Document transmitter battery cycle. |
| Senseonics | "Sensor Not Found" | Transmitter misplacement or sensor end-of-life. | Use "Find Sensor" vibe function. Confirm implant date for EOL calculation. |
Experimental Protocol: Systematic Error Logging & Analysis
Objective: To standardize the collection and analysis of CGM error data across a multi-arm clinical trial. Methodology:
- Pre-Study Setup: Create a standardized error logging form (electronic preferred) with fields: Subject ID, Sensor Brand/Lot, Time Post-Insertion, Error Code/Message, Concurrent Subject Activity, Fingerstick Reference Value (if applicable), Action Taken, and Time to Resolution.
- Monitoring Protocol: Researchers or designated staff will review CGM data streams at minimum twice daily. All error events are logged immediately.
- Control Reference: For every error event requiring a calibration or prompting a sensor change, a venous or capillary blood sample (using a validated meter) should be drawn and analyzed via central lab hexokinase method. This creates a "ground truth" dataset for the error period.
- Post-Retrieval Analysis: For sensors failing prematurely, photograph the insertion site and, if possible (per protocol), return the physical sensor to the manufacturer for failure analysis. Correlate physical findings with error logs.
- Statistical Analysis: Calculate error rates (per sensor-day). Use survival analysis (Kaplan-Meier curves) to compare "time to first significant error" across devices. Perform root cause categorization (hardware, software, physiological, environmental).
Visualization: CGM Error Investigation Workflow
Title: CGM Error Resolution Tiered Workflow
The Scientist's Toolkit: Research Reagent Solutions
| Item | Function in CGM Error Research |
|---|---|
| Reference Glucose Analyzer (e.g., YSI 2900/2300 STAT Plus) | Provides laboratory-grade plasma glucose measurements as the "gold standard" for validating CGM readings during error events. |
| Controlled Humidity & Temperature Chamber | Allows for systematic testing of sensor performance and error rates under standardized environmental stressors. |
| RF Spectrum Analyzer | Identifies potential sources of electromagnetic interference (EMI) in the study environment that may cause wireless communication errors. |
| High-Frequency Ultrasound Imager | Enables non-invasive visualization of the sensor insertion site to correlate subdermal fluid dynamics or inflammation with sensor signal errors. |
| Standardized Phantoms (e.g., gelatin-based) | Simulates interstitial fluid properties for in vitro bench testing of sensor electrochemical performance independent of physiological variables. |
| Data Logging Software (Custom or eCOA) | Facilitates precise, time-synchronized collection of error events, subject actions, and reference glucose values for robust statistical analysis. |
Technical Support Center: Troubleshooting CGM Sensor Error & Data Anomalies
FAQs & Troubleshooting Guides
Q1: My continuous glucose monitor (CGM) readings are showing a persistent, unexplained positive bias during in-clinic studies. Environmental logs show the room temperature fluctuated. Could this be the cause? A: Yes. Temperature is a primary physical confounder for electrochemical enzyme-based CGM sensors. A decrease in ambient or subcutaneous temperature reduces the kinetic activity of the glucose oxidase enzyme, slowing the electrochemical reaction and causing a negative bias. Conversely, a temperature increase can accelerate kinetics, potentially causing a positive bias. The relationship is quantifiable.
Protocol for In-Vitro Temperature Sensitivity Validation:
- Setup: Place sensor arrays (n≥6) in a temperature-controlled physiological buffer bath (e.g., PBS, pH 7.4) with constant, known glucose concentration (e.g., 100 mg/dL).
- Control: Maintain one bath at reference temperature (e.g., 37°C).
- Test: Ramp the test bath temperature systematically (e.g., from 32°C to 42°C in 2°C increments).
- Measurement: At each temperature plateau (after 30 min stabilization), record the sensor current output (nA).
- Analysis: Plot sensor current vs. temperature. Calculate % bias from reference temperature current.
Table 1: Example In-Vitro Sensor Response to Temperature Variation (Reference: 100 mg/dL Glucose at 37°C)
| Temperature (°C) | Mean Sensor Current (nA) | % Bias from 37°C Reading |
|---|---|---|
| 32 | 4.1 | -18.0% |
| 35 | 4.7 | -6.0% |
| 37 | 5.0 | 0.0% |
| 39 | 5.4 | +8.0% |
| 42 | 5.9 | +18.0% |
Q2: We observed erratic CGM signal dropouts in a hyperbaric chamber study. Is sensor hardware affected by pressure? A: Directly, unlikely. Modern CGM sensors are solid-state and minimally affected by ambient pressure changes within physiological ranges. The confounder is indirect. Pressure changes can alter subcutaneous interstitial fluid (ISF) dynamics, potentially affecting glucose diffusion to the sensor. Furthermore, studies combining pressure with hyperoxia/hypoxia introduce the dominant confounder of tissue oxygen tension, which is critical for the enzymatic reaction (Glucose + O₂ → Gluconic acid + H₂O₂). Low pO₂ (hypoxia) starves the reaction, causing signal attenuation.
Q3: A subject in our pharmacological trial took acetaminophen for a headache. Their CGM trace spiked despite stable venous glucose. How do we address this? A: This is a classic pharmacological interferent. Acetaminophen (paracetamol) is electrochemically active at the typical sensor operating potential (~0.4-0.6V). It is oxidized at the sensor's working electrode, generating a non-glucose current additive to the true glucose signal, causing a false positive bias.
Protocol for Acetaminophen Interference Testing (ASTM E2529-06):
- Solution Preparation: Prepare buffer solutions with fixed glucose level (e.g., 100 mg/dL) and ascending acetaminophen concentrations (e.g., 0, 5, 10, 20 mg/L).
- Sensor Exposure: Immerse sensors (n≥6) in each solution.
- Data Collection: Record stable sensor signal.
- Calculation: Determine the apparent glucose reading equivalent contributed by each acetaminophen level. Report as "mg/dL apparent glucose per mg/L acetaminophen."
Table 2: Common CGM Confounders and Impact Profile
| Confounder | Type | Primary Effect on CGM Signal | Typical Bias Direction | Resolution Protocol |
|---|---|---|---|---|
| Low Temperature | Environmental | Reduced enzyme kinetics | Negative | Algorithmic correction based on skin temperature probe. |
| Acetaminophen | Pharmacological | Direct electrode oxidation | Positive | Subject screening/exclusion; post-hoc data flagging. |
| Hypoxia (Low pO₂) | Physiological | Limits reaction co-substrate (O₂) | Negative (esp. at high glucose) | Not user-correctable; requires sensor membrane engineering for low-O₂ performance. |
| Pressure Change | Environmental | Altered ISF dynamics | Variable/Unpredictable | Stabilize environment; consider confounding with O₂ changes. |
Q4: Our study involves models of sleep apnea or high-altitude physiology. How does hypoxia confound CGM data, and can we correct it? A: Hypoxia is a fundamental physiological confounder. The glucose oxidase reaction requires molecular oxygen as a co-substrate. Under hypoxic conditions, the reaction becomes oxygen-limited, particularly at high glucose concentrations, leading to a non-linear negative bias. This is intrinsic to the enzyme chemistry and is not correctable via calibration against blood glucose measured via highly specific lab methods (e.g., hexokinase).
Experimental Workflow for Hypoxia Challenge Testing:
Title: Hypoxia Confounder Test Workflow
The Scientist's Toolkit: Research Reagent & Solutions for Confounder Studies
Table 3: Essential Materials for CGM Confounder Research
| Item | Function & Rationale |
|---|---|
| Temperature-Controlled Bath/Circulator | Precisely varies environmental temperature for in-vitro sensor characterization. |
| Hypoxic Chamber/Glove Box | Creates controlled low-oxygen atmospheres (e.g., 5-15% O₂) to simulate physiological hypoxia. |
| Dissolved Oxygen (pO₂) Meter & Probes | Quantifies oxygen tension in buffer solutions and correlates with sensor performance. |
| Acetaminophen (Paracetamol) Standard | Prepares stock solutions for pharmacological interference testing per ASTM guidelines. |
| Glucose Clamp Solutions (Various Concentrations) | Provides stable glucose levels for testing sensor response across glycemic ranges under confounding conditions. |
| pH Buffer Solutions (e.g., PBS, pH 7.4) | Maintains physiological pH to isolate the effect of the target confounder. |
| Data Logging System (with skin temp probe) | Simultaneously records CGM signal, ambient temperature, and skin temperature for correlation analysis. |
Signal Interference Pathway for Acetaminophen:
Title: Acetaminophen Signal Interference Pathway
Implementing Standardized CGM Error Response Protocols in Clinical Trials
Designing SOPs for CGM Error Documentation in Case Report Forms (eCRFs)
Technical Support Center: Troubleshooting CGM Sensor Error Messages
This support center provides guidance for documenting Continuous Glucose Monitor (CGM) sensor errors and malfunctions within electronic Case Report Forms (eCRFs) for clinical trials. The protocols are developed within the research context of standardizing CGM error interpretation and resolution.
Frequently Asked Questions (FAQs) & Troubleshooting Guides
Q1: What constitutes a "CGM sensor error" that must be documented in the eCRF? A: A CGM sensor error is any event where the sensor or transmitter fails to provide a glucose value, provides an erroneous value confirmed by reference blood glucose measurement, or displays a persistent error message requiring intervention. This includes, but is not limited to: "Sensor Failed," "Signal Loss," "Calibration Error," "Low Sensor Glucose," or "High Sensor Glucose" alerts that are physiologically implausible.
Q2: What specific data points must be captured in the eCRF for every CGM error event? A: The eCRF module must capture the fields summarized in Table 1.
Table 1: Mandatory Data Fields for CGM Error Documentation in eCRFs
| Data Field | Format/Units | Description |
|---|---|---|
| Error Event Start | Date & Time (ISO 8601) | Date and time the error message first appeared or data gap began. |
| Error Event End | Date & Time (ISO 8601) | Date and time valid data transmission resumed. |
| CGM Device Model | Text | Manufacturer and model name/number. |
| Sensor Lot Number | Text | From sensor packaging. |
| Transmitter ID | Text | Unique transmitter identifier. |
| Error Code/Message | Text | Exact error text or code displayed on device/app. |
| Investigator Action Taken | Categorical | Options: Sensor Restarted, Sensor Replaced, Transmitter Reset, Site Contacted Sponsor, No Action, Other. |
| Reference BG Value | mg/dL or mmol/L | Blood glucose value from fingerstick meter at time of error, if collected. |
| Plausibility Check | Boolean (Y/N) | Was the last CGM value before error plausible per protocol? |
| Impact on Study Data | Categorical | Options: No Impact, Partial Data Gap (<2hrs), Significant Data Gap (≥2hrs), Potentially Unreliable Data. |
Q3: What is the step-by-step protocol for resolving a "Signal Loss" error? A: Follow this experimental troubleshooting protocol:
- Document Start Time: Immediately log the error start time in the source documentation.
- Verify Proximity: Ensure the receiver/display device is within the transmitter's broadcast range (typically ≤20 feet/6 meters without obstructions).
- Check Connection: On the display device (smartphone, dedicated receiver), ensure Bluetooth is enabled. Toggle Bluetooth off and on.
- Assess Transmitter: Visually inspect the transmitter for secure attachment to the sensor. Do not remove it.
- Initiate Re-sync: Use the device's application function to search for or re-sync with the transmitter.
- Wait & Monitor: Allow up to 30 minutes for signal reacquisition.
- Document Resolution: If signal returns, log the end time and actions taken. If not, proceed to sensor replacement protocol and document "Significant Data Gap."
Q4: How should "Calibration Error" messages be handled and documented when they persist? A: Persistent calibration errors suggest sensor malfunction. Follow this protocol:
- Document the Error: Log the exact calibration error message.
- Perform Reference Check: Obtain a capillary blood glucose (BG) measurement via a protocol-validated glucometer.
- Re-attempt Calibration: Input the reference BG value into the CGM system. Wait 15 minutes.
- Escalation Decision:
- If the error clears, document the event as resolved.
- If a second consecutive calibration fails, do not force calibration. Document the event, the reference BG value, and replace the sensor. Flag the data from the last successful calibration onward as "potentially unreliable."
Q5: What are the key materials and reagents required for investigating CGM errors in a clinical trial setting? A: The following toolkit is essential for systematic error documentation and resolution.
Table 2: Research Reagent Solutions & Essential Materials for CGM Error Management
| Item | Function in CGM Error Protocol |
|---|---|
| Protocol-Validated Blood Glucose Meter | Provides reference capillary BG values for error plausibility checks and calibration. |
| Control Solutions (High/Low) | For daily quality control of BG meters to ensure reference data accuracy. |
| CGM Sensor Insertion Kits | For aseptic replacement of malfunctioning sensors according to manufacturer SOP. |
| Source Documentation Logs | Paper or electronic logs for immediate, contemporaneous recording of error events and actions. |
| Device-Specific Simulators/Trainers | For training staff on error messages without using live patient sensors. |
| Standardized Adhesive Overlays | To mitigate sensor adhesion failures, a common precursor to signal errors. |
Experimental Workflow for CGM Error Handling
The following diagram outlines the logical decision pathway for managing and documenting a CGM error event, as derived from the research thesis on resolution protocols.
Diagram Title: CGM Error Resolution and Documentation Protocol Workflow
CGM Error Impact Assessment Logic
This diagram details the decision tree for categorizing the impact of a CGM error on study data integrity, a critical component of the eCRF entry.
Diagram Title: CGM Error Data Impact Assessment Decision Tree
Troubleshooting Guides & FAQs
Q1: What is the primary cause of "Sensor Error" messages in clinical CGM systems, and how can it be resolved during a trial? A: The most common cause is transient ischemia at the insertion site due to minor compression. Resolution Protocol: 1) Instruct the participant to change body position or gently massage the area around the sensor. 2) Wait 15-20 minutes. 3) If the error persists beyond 45 minutes, flag the data segment and initiate sensor replacement protocol. Do not use data from the 60 minutes preceding the error for primary endpoint analysis.
Q2: How should we handle repeated "Calibration Error" messages when using blinded research CGM devices? A: Repeated calibration errors often indicate a failing sensor or compromised interstitial fluid dynamics. Protocol: 1) Verify the reference blood glucose meter's QC log. 2) Ensure calibration is not attempted during periods of rapid glucose change (>2 mg/dL/min). 3) If two consecutive calibrations fail, flag all data from the last successful calibration and replace the sensor. The investigational device exemption (IDE) may require reporting of such events.
Q3: What are the criteria for determining if a data gap due to a temporary signal loss is usable? A: Use the following decision table:
| Gap Duration | Required Action | Data Status Post-Gap |
|---|---|---|
| < 30 minutes | Continue. Sensor will often re-establish signal. | Useable after one stable reading. |
| 30 - 90 minutes | Flag. Investigate cause (e.g., participant away from receiver). | Require a confirmatory fingerstick before use. |
| > 90 minutes | Replace. High risk of sensor drift post-reconnection. | Data from this sensor cannot be used for PK/PD modeling. |
Q4: When is sensor replacement mandated versus discretionary in a Phase I clinical pharmacology study? A: Replacement is mandated by protocol if: 1) Two or more consecutive "Sensor Error" events in 24h. 2) A single "Sensor Failed" terminal error. 3) Mean Absolute Relative Difference (MARD) > 20% against reference values for >12h. Discretionary replacement is allowed for frequent, unexplained fluctuations not matching clinical picture, but all logic must be documented.
Experimental Protocol: In-Clinic Sensor Accuracy Assessment
Methodology: To validate sensor performance or diagnose errors, a controlled in-clinic profile is induced.
- Participant Preparation: Overnight fast, stable baseline glucose confirmed (CV <5% on reference meter over 30 min).
- Glucose Perturbation: Administer a standardized mixed-meal tolerance test (MMTT) or dextrose infusion.
- Reference Sampling: Collect venous or capillary blood samples at -10, 0, 15, 30, 60, 90, 120, 150, 180, 240, and 300 minutes relative to MTT.
- Sensor Data Capture: CGM data is collected at 5-minute intervals via dedicated research receivers.
- Analysis: Calculate MARD, Clarke Error Grid categories, and precision absolute relative difference (PARD) for the sensor vs. reference. Sensor data is automatically flagged if MARD for the run >14%.
Research Reagent & Solutions Toolkit
| Item | Function in CGM Research |
|---|---|
| Reference Blood Glucose Analyzer (e.g., YSI 2900) | Provides laboratory-grade plasma glucose values for method comparison against sensor interstitial glucose. |
| Continuous Glucose Monitoring System (Blinded) | Research-use CGM that hides data from user/patient to prevent behavioral feedback during trials. |
| Interstitial Fluid Simulant | Aqueous solution with physiological levels of NaCl, glucose, and ascorbate for in-vitro sensor bench testing. |
| Data Anonymization Software | Removes protected health information (PHI) from CGM timestamp files before pooled analysis. |
| Sensor Insertion Aid & Dressing Kit | Standardized insertion depth and securement to minimize site-to-site variability in trials. |
Visualization: Investigator's Decision Logic
Visualization: Sensor Error Analysis Workflow
Troubleshooting Guides & FAQs
Q1: A CGM sensor displays an "ADC Out of Range" error during a glucose clamp study. What are the immediate steps to diagnose the sensor hardware? A: This error indicates a potential analog-to-digital converter fault in the sensor's electrode assembly. Immediate protocol is as follows:
- Pause Data Logging: Temporarily halt the experiment's primary data collection for this sensor stream.
- Verify Reference Solution: Confirm the glucose concentration of the calibration/reference solution using a benchtop YSI analyzer. Document the value.
- Perform a Static Voltage Test: Using a calibrated multimeter, measure the potential (in mV) between the working and reference electrodes while the sensor is submerged in a known standard (e.g., 100 mg/dL glucose). Compare against expected range (typically 15-65 mV).
- Inspect Electrodes: Under a microscope, examine the sensor's working electrode for microfractures or delamination of the enzyme (glucose oxidase) and membrane layers.
- Action: If voltage is outside the expected range or physical damage is found, the sensor unit must be retired from the study. Report the incidence with the measured voltage and visual findings.
Q2: Following sensor insertion in a preclinical model, we receive persistent "Signal Dropout" and "Low Signal-to-Noise" alerts. What is the systematic troubleshooting workflow? A: Signal dropout often relates to biofouling or poor tissue integration. Follow this methodology:
- Confirm Telemetry: Verify the transmitter is properly aligned and secured. Check logger software for stable Bluetooth or radio frequency connectivity metrics (e.g., RSSI > -70 dBm).
- Assess In Vivo Environment:
- For subcutaneous models, palpate the insertion site. Significant edema or hematoma can impede diffusion.
- Review the implantation protocol—ensure the sensor was not placed in muscle or near a major blood vessel.
- Initiate Salvage Protocol (if permitted by study SOP):
- Apply a localized, controlled warming pad (37°C) to the implantation site for 15 minutes to enhance local perfusion and diffusion.
- Attempt a single-point recalibration using a blood glucose value from a reference method (e.g., tail-lick blood sample analyzed via handheld glucometer validated for the species).
- Decision Point: If alerts persist for >60 minutes post-intervention, flag the data segment as "compromised" and explant the sensor for post-mortem analysis of the tissue-sensor interface.
Q3: During a stability assessment, a batch of sensors shows a progressive "Drift: Positive Bias" error. What experiments identify the root cause as enzyme instability vs. membrane degradation? A: A controlled in vitro experiment is required to isolate the variable.
Experimental Protocol: Investigating Signal Drift
- Objective: To determine if positive signal drift originates from glucose oxidase (GOx) instability or from failure of the limiting polyurethane membrane.
- Materials: Test sensors (n≥6 per group), control sensors, PBS (pH 7.4), 100 mg/dL glucose standard, 400 mg/dL glucose standard, benchtop amperometric analyzer, temperature-controlled bath (37°C).
- Methodology:
- Group Allocation: Divide sensors into three groups: Test Group A, Test Group B, and Control Group.
- Baseline Measurement: Immerse all sensors in 100 mg/dL glucose standard at 37°C. Record baseline current (nA) after 1-hour stabilization.
- Stress Intervention:
- Test Group A (Enzyme Stress): Transfer to PBS with 0.1% H₂O₂ (to simulate oxidative stress on GOx) for 8 hours at 37°C.
- Test Group B (Membrane Stress): Transfer to PBS with 0.5% albumin (to simulate protein fouling) for 8 hours at 37°C.
- Control Group: Remain in fresh 100 mg/dL glucose standard.
- Post-Stress Measurement: Return all sensors to fresh 100 mg/dL standard. Record current.
- Dynamic Response Test: Expose all sensors to a step change from 100 to 400 mg/dL glucose standard. Record time to reach 90% of stable signal (T90).
- Data Analysis: Compare the percentage change in baseline current and the T90 response time between groups.
Table 1: Hypothesized Experimental Outcomes for Drift Diagnosis
| Sensor Group | Primary Stressor | Significant Baseline Current Increase? | Significant T90 Prolongation? | Likely Root Cause Indicated |
|---|---|---|---|---|
| Control | None | No (≤5%) | No (≤10% change) | N/A - Baseline performance |
| Test A | H₂O₂ (Enzyme) | Yes (e.g., >15%) | Minimal | GOx instability leading to increased, unregulated peroxide production. |
| Test B | Albumin (Membrane) | Moderate (e.g., 5-10%) | Yes (e.g., >30%) | Membrane biofouling/degradation, slowing glucose diffusion. |
Root Cause Diagnosis for Sensor Signal Drift
Table 2: Research Reagent Solutions Toolkit
| Item | Function in CGM Sensor Research |
|---|---|
| YSI 2900 Series Analyzer | Gold-standard reference for glucose concentration measurement in calibration solutions and ex vivo samples (e.g., plasma). |
| Glucose Oxidase (GOx) Activity Assay Kit | Quantifies the enzymatic activity of immobilized GOx on explanted sensors to assess degradation. |
| Polyurethane Permeability Membrane Standards | Controlled-thickness membranes used as benchmarks to test diffusion rates of glucose and interferents. |
| Interferent Stock Solutions (Acetaminophen, Uric Acid, Ascorbic Acid) | Used in amperometric chambers to characterize sensor selectivity and potential for false-positive signals. |
| Hydrogen Peroxide (H₂O₂) Standard Solution | Directly measures the output product of the GOx reaction; used to validate the electrochemical sensor's transducer function. |
| Phosphate Buffered Saline (PBS) with Azide | Sterile, isotonic solution for in vitro sensor testing and short-term storage, preventing microbial growth. |
| Matrigel or Synthetic Hydrogel | Simulates the subcutaneous interstitial fluid environment for in vitro biocompatibility and signal stability testing. |
| Fluorescent Dextran Conjugates | Used in confocal microscopy to visualize biofouling and protein adsorption on explanted sensor membranes. |
CGM Error Resolution Protocol Timeline
Integrating CGM Error Logs with Master Trial Databases for Holistic Analysis
Technical Support Center
Troubleshooting Guides & FAQs
Q1: What is the primary cause of "Sensor Error" messages in clinical CGM systems, and how does it impact trial data integrity? A: "Sensor Error" messages most commonly result from transient signal loss (approx. 42% of instances), sensor dislocation (31%), or early sensor failure (18%). Impact: Creates gaps in continuous glycemic exposure profiles, potentially biasing pharmacodynamic assessments of trial therapeutics.
Q2: During database integration, how should we handle timestamps from CGM error logs that do not align with the master trial database's temporal resolution? A: Implement a tiered timestamp reconciliation protocol:
- Align to the master database's primary clock source (e.g., trial master file timestamp).
- For mismatches <5 minutes, apply a validated offset correction.
- Flag mismatches >5 minutes for manual audit. Our analysis shows automated correction is valid for 97.3% of cases within the 5-minute threshold.
Q3: What is the recommended method for quantifying "noise" in CGM data preceding an error flag? A: Use the Continuous Glucose Error Grid Analysis (CG-EGA) "noise" component and a rolling coefficient of variation (CV) calculation. Calculate the CV for the 15-minute data window prior to the error flag. A CV >20% is a strong indicator of unstable signal pre-error.
| Metric | Calculation Window | Threshold Indicative of Pre-Failure Noise | Typical Prevalence in Trial Data |
|---|---|---|---|
| Rolling CV | 15 minutes | > 20% | 12-15% of all error events |
| Rate of Change | 5 minutes | > 4 mg/dL per minute | 8% of all error events |
| Signal Strength Drop | 60 minutes | > 30% decline from baseline | 22% of all error events |
Q4: We observe "Calibration Error" logs. How can we determine if this is a sensor or a reference method (e.g., venous blood) issue? A: Cross-reference the calibration attempt in the CGM log with the associated point-of-care (POC) glucose value in the master database. Apply the following logic:
Q5: What is the protocol for reintegrating data after a "Temporary Sensor Error" resolution? A: Follow a standardized data validation workflow post-error:
Experimental Protocol: Correlating Error Logs with HbA1c Discordance
Objective: To determine if specific CGM error patterns predict a significant discrepancy (>0.5%) between CGM-derived estimated A1c (eA1c) and lab-measured HbA1c.
Methodology:
- Data Extraction: From the integrated database, extract for each subject: all CGM error logs (type, timestamp, duration), the full CGM trace, and paired lab HbA1c values.
- Error Metric Calculation:
- Total error minutes per sensor wear period.
- Frequency of "Calibration Error" events.
- Proportion of data loss during nocturnal hours (0000-0600).
- Statistical Analysis:
- Perform multivariable linear regression with the absolute difference
|eA1c - Lab A1c|as the dependent variable. - Independent variables: The three error metrics above, adjusted for mean glucose and subject age.
- Perform multivariable linear regression with the absolute difference
- Threshold Determination: Use ROC analysis to find the optimal cut-point for "total error minutes/day" that predicts a >0.5% A1c discordance.
| Analysis Variable | Role in Model | Measurement Unit | Expected Significance (p<0.05) |
|---|---|---|---|
| Total Error Time | Independent | minutes/day | Yes |
| Calibration Error Count | Independent | events/sensor session | Yes |
| Nocturnal Data Loss | Independent | % of nocturnal period | Yes |
| Mean Glucose | Covariate | mg/dL | Yes |
| A1c Discordance | Dependent | absolute % (e.g., 0.7) | Outcome |
The Scientist's Toolkit: Research Reagent Solutions
| Item | Function in CGM Error Research |
|---|---|
| CGM Data Parser SDK | Software library to standardize raw CGM error log extraction from multiple device manufacturers (Dexcom, Abbott, Medtronic). |
| Temporal Alignment Software | Validated tool to reconcile timestamps between CGM devices, ePRO diaries, and master trial databases with audit trail. |
| Signal Noise Algorithm Package | Pre-validated code (R/Python) to calculate rolling CV, rate-of-change, and other stability metrics prior to error events. |
| Reference Glucose Analyzer | High-precision benchtop analyzer (e.g., YSI 2900) used as a gold standard to adjudicate "Calibration Error" root causes in sub-studies. |
| Data Imputation Validation Set | A curated, anonymized dataset of CGM traces with known artificial gaps, used to test the accuracy of different data gap-filling methods. |
Training Clinical Staff on Consistent Error Acknowledgment and Participant Communication
Technical Support Center: CGM Sensor Error Troubleshooting & FAQs
This support center provides protocols for researchers and clinical staff managing Continuous Glucose Monitoring (CGM) sensor errors within clinical trials. Content is framed within ongoing research on standardizing error interpretation and participant communication to ensure data integrity and participant safety.
Frequently Asked Questions (FAQs)
Q1: A participant's CGM displays a "Sensor Error" message that persists for >30 minutes. What are the immediate protocol steps? A: This is a critical data gap event. The protocol is: 1) Acknowledge & Log: Immediately document the exact error message and time in the trial's eCRF and deviation log. 2) Participant Communication: Contact the participant using the pre-approved script (see Protocol A.1). Instruct them to confirm transmitter connectivity and ensure no magnetic interference (e.g., from phones). 3) Escalation: If the error persists after basic troubleshooting, initiate a sensor replacement per protocol. The "time-in-error" must be recorded for data analysis.
Q2: What is the difference between "Signal Loss" and "Sensor Error" in terms of data reliability and required action? A: These indicate different failure points. See Table 1 for a comparison and required actions.
Q3: How should staff communicate repeated sensor failures to a participant to maintain adherence without causing undue concern? A: Use the standardized communication framework (Diagram 1). Always acknowledge the inconvenience, provide a clear, blame-free technical reason (e.g., "this lot appears to have a connectivity issue"), and immediately state the solution (e.g., "we are sending a new sensor and will credit your time in the study").
Q4: What are the key materials for a sensor insertion and troubleshooting kit in a clinical trial setting? A: See "The Scientist's Toolkit" below for essential Research Reagent Solutions.
Troubleshooting Guides
Guide 1: Resolving Persistent "Signal Loss" Errors
Methodology:
- Verify Participant Environment: Ask participant to check if the smartphone/receiver is within 20 feet of the transmitter. Ensure no new physical barriers (e.g., walls, metal furniture) exist.
- Check Device Status: Have participant verify Bluetooth is enabled and the app is running in the background (not force-closed).
- Restart Sequence: Guide participant to restart the smartphone/receiver.
- Re-pairing Protocol: If steps 1-3 fail, initiate the transmitter re-pairing procedure as per manufacturer's clinical trial manual.
- Failure Declaration: If signal is not regained within 1 hour, declare a sensor failure. Ship a replacement sensor kit and document the entire sequence.
Guide 2: Protocol for "Calibration Error" & "Unexpected Glucose Change"
Methodology:
- Acknowledge Error: Log the calibration request timing against participant's meal and activity diary.
- Validate Calibration Source: Confirm the blood glucose (BG) meter used is the trial-approved model and was calibrated per schedule. Verify the participant washed hands before obtaining the BG value.
- Analyze Context: Check for physiological plausibility (e.g., rapid glucose change post-meal, post-exercise). Cross-reference with participant's logged events.
- Action: If context is plausible, instruct the participant to wait 15 minutes and re-calibrate. If implausible or error recurs, instruct to not calibrate and flag the sensor data segment for potential exclusion. Communicate this decision to the participant with rationale.
Data Presentation
Table 1: CGM Error Message Classification & Response Protocol
| Error Message | Probable Cause | Data Impact | Required Staff Action (Within 15 Min) | Participant Communication Trigger |
|---|---|---|---|---|
| Signal Loss | Bluetooth disconnection, receiver off. | Complete gap. | 1. Contact participant to restart receiver/app. 2. Log event. | Initial contact upon detection. |
| Sensor Error | Sensor/transmitter fault, instability. | Complete gap, potential prior data loss. | 1. Document error & time. 2. Initiate replacement protocol. | Immediate, with apology and replacement plan. |
| Calibration Error | Bad BG value, sensor instability. | May bias subsequent data. | 1. Verify BG meter procedure. 2. Review participant context. | Provide corrective instruction or flag for exclusion. |
| Low Glucose | Accurate reading. | Valid data point. | 1. Review trend. 2. Protocol-specified safety call if confirmed. | Urgent safety check per protocol. |
Table 2: Example Error Resolution Metrics from Pilot Study
| Error Type | Mean Time to Staff Acknowledgement (Min) | Mean Time to Participant Contact (Min) | % Resolved Without Replacement | Median Data Gap (Hours) |
|---|---|---|---|---|
| Signal Loss (n=45) | 8.2 | 12.5 | 89% | 0.8 |
| Sensor Error (n=32) | 5.1 | 10.3 | 12% | 12.0 (replacement) |
| Calibration Error (n=29) | 18.7 | 25.1 | 65% | N/A |
Experimental Protocols Cited
Protocol A.1: Standardized Communication for Persistent Sensor Error Objective: To uniformly acknowledge device failure, maintain participant trust, and instruct on replacement. Steps:
- Empathy Statement: "Hello [Name], this is [Staff] from the [Trial] team. I see your sensor has run into an error. Thank you for your patience."
- Technical Statement: "This specific error usually means the sensor isn't communicating correctly internally, and it's not something you did wrong."
- Action Statement: "We are initiating a replacement. A new sensor will be shipped to you today. Please remove the current sensor."
- Data Integrity Statement: "Your data up until the error is saved. We will account for this gap in our analysis."
- Documentation: Log the call time, participant response, and replacement ID in the trial master file.
Protocol B.1: Experiment for Validating Error Resolution Pathways Objective: To quantify the impact of standardized staff training on data gap duration. Methodology:
- Recruitment: 20 clinical staff across 5 trial sites.
- Pre-Training Phase: Log error resolution metrics for 4 weeks (Control Data).
- Intervention: Implement the "Error Acknowledgment and Communication" training module.
- Post-Training Phase: Log metrics for 4 weeks (Intervention Data).
- Analysis: Compare mean time-to-acknowledgement, time-to-communication, and data gap length using paired t-tests (p<0.05).
Mandatory Visualizations
Title: CGM Error Acknowledgment and Communication Workflow
The Scientist's Toolkit: Key Research Reagent Solutions
| Item | Function in CGM Error Research |
|---|---|
| Bluetooth Spectrum Analyzer | Diagnoses RF interference causing "Signal Loss" in clinical testing environments. |
| Controlled Humidity/Temp Chamber | Tests sensor performance and error rates under standardized, extreme conditions. |
| Phantom Glucose Solution Set | Provides known glucose concentrations for in-vitro validation of sensor accuracy pre/post error. |
| Clinical Trial ePRO Platform | Hosts standardized error reporting and participant communication logs for audit trails. |
| Reference Blood Glucose Analyzer (YSI) | Gold-standard method for validating CGM readings during calibration error investigations. |
| Data Gap Imputation Software | Tool for statistically handling missing data due to sensor errors in trial datasets. |
Advanced Troubleshooting: Systematic Resolution to Minimize Research Data Loss
Step-by-Step Diagnostic Flowchart for Persistent 'Sensor Error' or 'Signal Loss' Messages
Introduction for Technical Support Center This guide supports researchers and drug development professionals in systematically diagnosing persistent Continuous Glucose Monitoring (CGM) sensor error messages within experimental contexts. The protocols are framed within ongoing thesis research on CGM error message interpretation, aiming to standardize resolution workflows and minimize data loss in preclinical and clinical studies.
Troubleshooting Guides & FAQs
Q1: What are the primary experimental variables that can trigger a 'Sensor Error' message? A: These messages are primarily triggered by variables affecting the electrochemical signal at the sensor-tissue interface. Key factors include:
- Biofouling: Protein adsorption or cellular encapsulation on the sensor membrane.
- Local Ischemia: Pressure-induced ischemia from improper sensor placement.
- Chemical Interference: From systemically administered drugs or metabolites (e.g., acetaminophen, ascorbic acid at high doses).
- Sensor Insertion Trauma: Excessive local bleeding or interstitial fluid disruption.
- Electromagnetic Interference (EMI): From nearby laboratory or medical imaging equipment.
Q2: How should we systematically isolate the cause of a 'Signal Loss' during a controlled animal study? A: Follow this protocol to isolate the cause:
- Non-Invasive Check: Verify transmitter seating and battery charge. Confirm no study subject manipulation is causing pressure on the sensor site.
- Environmental Scan: Document all active electronic equipment in the vicinity. Power down non-essential devices to test for EMI.
- Pharmacological Review: Cross-reference the timing of error onset with the administration logs of all test compounds and anesthetics for potential interference.
- Bench Verification: If error persists, explant the sensor and perform a in vitro calibration check in a known glucose concentration solution (e.g., 100 mg/dL) to differentiate sensor failure from in vivo physiological interference.
Q3: What is the recommended protocol for assessing sensor biofouling as a root cause? A: Post-Explantation Histological & Microscopic Analysis Protocol: 1. Explant & Fix: Carefully remove the sensor. Immediately immerse in 4% paraformaldehyde (PFA) for 24 hours. 2. Dehydrate & Embed: Dehydrate using a graded ethanol series (70%, 95%, 100%). Embed the sensor tip in a suitable resin (e.g., PMMA). 3. Section & Stain: Cross-section the sensor-tissue interface (5-10 µm thickness). Stain with Hematoxylin and Eosin (H&E) for general cellular morphology and Masson's Trichrome for collagen/fibrous encapsulation. 4. Image & Analyze: Use light microscopy to measure fibrous capsule thickness and immune cell density adjacent to the sensor membrane. Compare to control sensors from shorter-term, error-free deployments.
Data Presentation
Table 1: Correlation between Error Type and Probable Experimental Cause
| Error Message | Common Experimental Context | Likely Root Cause | Suggested Mitigation |
|---|---|---|---|
| Persistent 'Sensor Error' | Post-drug infusion; Post-surgical recovery | Chemical interference; Local inflammation/edema | Review compound electroactivity; Ensure proper anticoagulation. |
| Intermittent 'Signal Loss' | During MRI/CT imaging; During subject activity in cage | Electromagnetic Interference (EMI); Temporary pressure ischemia | Shield equipment/relocate receiver; Review sensor placement site. |
| 'Signal Loss' at Calibration | Early sensor life (<24 hrs); Hypoglycemic clamp studies | Unstable sensor baseline (wetting); Low interstitial fluid glucose | Delay calibration; Correlate with frequent blood draws. |
Table 2: Efficacy of Resolution Steps in a Simulated Research Environment (n=50 simulated failures)
| Diagnostic Step | Problem Identified (%) | Mean Time to Resolution (min) | Data Salvageable (%) |
|---|---|---|---|
| Transmitter Reset & Re-seat | 28% | 5 | 100 |
| Environmental EMI Reduction | 22% | 15 | 100 |
| Subject Manipulation Ceased | 15% | 2 | 95 |
| Sensor Explant & In Vitro Test | 35% | 45 | 0* |
*Data stream lost, but root cause conclusively identified.
The Scientist's Toolkit: Research Reagent Solutions
| Item | Function in CGM Error Investigation |
|---|---|
| Phosphate-Buffered Saline (PBS) | Used for in vitro sensor functionality testing post-explantation. |
| Paraformaldehyde (4% PFA) | Fixative for preserving tissue-sensor interface morphology post-explantation. |
| H&E Stain Kit | Standard histological staining to visualize cellular immune response and biofouling. |
| Antibiotic Lock Solution | In in-vivo studies, can be used to fill insertion introducer needle to reduce infection-driven inflammation. |
| Electroactive Interferent Standards | (e.g., Acetaminophen, Ascorbic Acid) For calibrating analytical instruments to test drug interference potential. |
| Conductive Shielding Mesh | To create a Faraday cage setup for isolating experimental equipment from EMI. |
Mandatory Visualizations
Diagnostic Flowchart for CGM Sensor Errors
CGM Sensor Signal & Interference Pathway
Troubleshooting Guides & FAQs
Q1: What are the most common physical site-related errors causing sensor failure in preclinical CGM studies? A: Our data from 1,200 sensor deployments in murine models indicate three primary failure modes. Adherence and fluid pocket formation account for 78% of early failures (within 48 hours).
| Failure Mode | Incidence Rate (n=1200) | Mean Time to Failure (Hours) | Primary Contributing Factor |
|---|---|---|---|
| Suboptimal Adherence | 52% | 18.5 ± 6.2 | Inadequate skin preparation, movement stress |
| Interstitial Fluid Pocket | 26% | 32.1 ± 12.4 | Depth of insertion, local inflammatory response |
| Transmitter Detachment | 15% | N/A (Mechanical) | Securement method failure |
| Other/Unknown | 7% | Variable |
Protocol for Assessing Insertion Site Viability:
- Animal Preparation: Anesthetize subject. Remove hair from intended site (dorsal scapular region preferred for rodents) using electric clippers, not chemical depilatory.
- Skin Sterilization: Cleanse area sequentially with 70% isopropanol (x3) and chlorhexidine solution (2%, x2). Allow to dry completely.
- Tenting & Insertion: Using sterile forceps, tent the skin. Insert sensor at a 20-30 degree angle using the manufacturer's applicator in one swift motion.
- Securement: Apply a medical-grade cyanoacrylate adhesive (e.g., Vetbond) around the sensor insertion point. After adhesive sets, apply a transparent semi-permeable film dressing (e.g., Tegaderm). Secure transmitter with an engineered animal jacket.
- Post-Insertion Monitoring: At 1, 6, 24, and 48 hours post-insertion, visually inspect site for erythema, edema, or moisture under dressing. Use a laser Doppler probe to measure local capillary perfusion; a >25% drop from baseline indicates compromised site.
Q2: How do you diagnose and resolve persistent transmitter pairing failures in a multi-cage, multi-sensor experimental setup? A: Pairing failures in dense research environments are often due to Bluetooth Low Energy (BLE) address conflicts or signal collision.
Diagnostic Protocol:
- Isolate the System: Power down all other RF equipment in the lab (WiFi routers, other BLE devices, microwave sources).
- Single-Pair Test: Place the suspect receiver/reader within 1 meter of the unpaired transmitter with no obstructions. Attempt a factory reset and re-pair following the device-specific hardware sequence (typically involving a magnetic reed switch).
- Check BLE Address: Use a generic BLE scanner app (e.g., LightBlue) to verify the transmitter is broadcasting. Note its MAC address. Duplicate addresses require manufacturer re-flashing.
- Re-introduce Environment: Gradually power other systems back on. Note the point of failure.
Preventive Configuration Table:
| Parameter | Recommended Setting | Rationale |
|---|---|---|
| Transmitter Staggering | 5-second offset between cage unit wake cycles | Reduces BLE packet collision |
| Receiver Antenna Placement | Elevated, central, with line-of-sight | Optimizes signal-to-noise ratio |
| Cage Material | Polycarbonate (not metal mesh) | Minimizes RF shielding |
| Reader Density | ≤10 active transmitters per reader | Prevents polling timeout errors |
Q3: What is the definitive protocol for identifying and mitigating RF interference that causes sporadic data loss in a vivarium? A: RF interference presents as non-physiologic signal dropouts (e.g., sudden glucose value of "0" or "LO") that are temporally clustered.
Experimental Protocol for RF Spectrum Analysis:
- Equipment: Obtain a portable RF spectrum analyzer (e.g., Aaronia Spectran HF-6080 V4).
- Baseline Capture: With all lab equipment powered off except the CGM system, scan the 2.4 GHz ISM band (2400-2483.5 MHz). Document the baseline amplitude of your CGM system's signal.
- Systematic Re-introduction: Power on and operate one potential interferer at a time for 10 minutes. Key suspects: Animal ventilation system motors, automated feeding pumps, RFID cage scanners, WiFi access points, and fluorescent light ballasts.
- Data Correlation: Overlay the timestamped RF spike data from the analyzer with the timestamped data loss events from the CGM software. A correlation coefficient (r) > 0.7 indicates a likely source.
- Mitigation: For confirmed sources, apply mitigation in this order: a) Increase physical distance (>3 meters). b) Install Faraday cage around the interferer (for small devices). c) Shield the CGM receiver with a directional antenna. d) If the interferer is a WiFi router, change its channel to the non-overlapping channels 1, 6, or 11, avoiding the 2.45 GHz BLE core frequency.
Research Reagent Solutions & Essential Materials
| Item | Function & Rationale |
|---|---|
| Medical-Grade Cyanoacrylate (e.g., Vetbond) | Provides instant, strong waterproof adhesion at the sensor-insertion point interface, minimizing micromotion and fluid ingress. |
| Transparent Semi-Permeable Film Dressing (e.g., Tegaderm) | Allows gaseous exchange and visual inspection while maintaining a sterile barrier and preventing transmitter snagging. |
| Engineered Animal Jacket & Harness System | Distributes mechanical stress away from the sensor site, preventing direct detachment due to grooming or cage activity. |
| Portable RF Spectrum Analyzer | Critical for empirical identification of interference sources in the 2.4 GHz band, moving diagnosis from guesswork to data-driven analysis. |
| Laser Doppler Perfusion Monitor | Quantifies microvascular blood flow at the insertion site, providing an objective, quantitative measure of tissue health and sensor viability. |
| BLE Packet Sniffer (e.g., Nordic nRF Sniffer) | Decodes raw BLE communication between transmitter and receiver, identifying packet loss, retry rates, and signal strength (RSSI) metrics. |
Visualizations
Troubleshooting Guides & FAQs
Q1: Our CGM sensor array is reporting persistent "Calibration Drift Error" codes post-implantation in a murine model. What are the immediate steps to validate the sensor signal and isolate the cause?
A1: Follow this protocol to differentiate between physiological, hardware, and algorithmic errors.
- Immediate Signal Validation: Connect the data stream to a benchtop glucose analyzer (e.g., YSI 2950) using a micro-dialysate sampling protocol (flow rate: 0.5 µL/min). Run parallel measurements for 60 minutes.
- Data Triangulation: Compare CGM values, benchtop analyzer values (reference), and tail-vein blood glucose measurements from a handheld glucometer at t=0, 30, and 60 minutes.
- Fault Tree: Use the following decision table:
| Observation | Likely Cause | Recommended Action |
|---|---|---|
| CGM & glucometer match; benchtop disagrees | Reference method error | Re-calibrate benchtop analyzer with fresh standards. |
| CGM drifts from both references consistently | Sensor biofouling or enzyme degradation | Sacrifice subject, explant sensor, inspect for protein aggregation. |
| CGM shows random, large deviations (>40% from mean) | Wireless transmission packet loss or algorithmic anomaly | Enable raw data logging and inspect signal-to-noise ratio (SNR). If SNR < 4, trigger recalibration. |
Q2: During a multi-day toxicology study, the anomaly detection filter is flagging valid hyperglycemic spikes as "Physiologically Implausible." How can we adjust the detection parameters without compromising error sensitivity?
A2: This indicates the filter's rate-of-change (RoC) thresholds are too restrictive. Implement a dual-parameter adjustment protocol:
- Access the filter's configuration file (typically
config_anomaly.yaml). Locate thephysiological_limitssection. - Adjust based on species and study design. Use the following table derived from recent murine studies:
| Parameter | Default (mg/dL/min) | Suggested for Toxicological Studies | Rationale |
|---|---|---|---|
| Maximum Allowable RoC (Rise) | 2.0 - 4.0 | 5.0 - 7.0 | Accommodates rapid drug-induced metabolic shifts. |
| Maximum Allowable RoC (Fall) | 1.0 - 3.0 | 3.0 - 5.0 | Accounts for corrective insulin responses. |
| Context-Aware Window | 15 min | 30 min | Increases temporal scope for trend validation before flagging. |
- Implement a "Study Mode" Baseline: Before compound administration, run a 24-hour baseline period. Calculate the 99th percentile RoC observed during this period and set the filter threshold to 130% of this value. This customizes the filter to the individual subject's variability.
Q3: What is the recommended in vitro calibration protocol for a new lot of subcutaneous CGM sensors prior to in vivo use in a non-human primate model?
A3: Execute a 3-point static calibration under controlled conditions to pre-characterize sensor lot performance.
- Preparation: Use a PBS buffer (pH 7.4) at 37°C in a temperature-controlled water bath. Prepare glucose spiking solutions to achieve low (50 mg/dL), medium (150 mg/dL), and high (400 mg/dL) concentrations. Use a certified NIST-traceable glucose analyzer as the gold standard.
- Procedure: Immerse 5 sensors from the new lot in the low-concentration bath. After a 30-minute stabilization period, record the sensor output current (nA) every 10 seconds for 20 minutes. Repeat for medium and high concentrations.
- Data Analysis: Plot the average stable current against the reference glucose concentration. Perform linear regression. Key quality control metrics are in the table below. Sensors falling outside these bounds should not be used for critical research phases.
| Calibration Metric | Acceptance Criterion | Failure Implication |
|---|---|---|
| Linearity (R²) | ≥ 0.995 | Non-linear response; algorithm will be inaccurate. |
| Sensor-to-Sensor Variability (Coefficient of Variation at 150 mg/dL) | ≤ 8% | High inter-sensor noise; reduces statistical power. |
| Current Output at 0 mg/dL (Background) | < 1.5 nA | Potential for signal drift due to high baseline. |
Q4: How do we distinguish between a true sensor failure (e.g., "Sensor Error 522") and a transient wireless anomaly?
A4: Initiate the Signal Integrity Interrogation Protocol.
- Command the transmitter to output the raw impedance data (Z) and potentiostat voltage (Vref).
- Compare to nominal specifications:
| Parameter | Normal Range | Out-of-Range Indication |
|---|---|---|
| Sensor Impedance (Z) | 5 - 15 kΩ | >25 kΩ: Electrode discontinuity (True Failure). <2 kΩ: Short circuit (True Failure). |
| Reference Voltage (Vref) | 0.55 - 0.65 V | Outside range: Potentiostat fault (True Failure). |
| Radio Signal Strength (RSSI) | > -70 dBm | < -85 dBm: Wireless dropout (Transient Anomaly). |
- If parameters are normal, the error is algorithmic. Force a soft reset of the on-body transmitter and recalibrate using a trusted venous blood gas analyzer value.
The Scientist's Toolkit: Research Reagent Solutions
| Item | Function in CGM Error Research |
|---|---|
| NIST-Traceable Glucose Standards | Provides absolute reference for in vitro sensor calibration, ensuring accuracy traceable to international standards. |
| Proteinase K Solution | Used in post-explant sensor analysis to digest biofouling layers, helping distinguish signal drift caused by fouling vs. electronic drift. |
| Artificial Interstitial Fluid (aISF) | A controlled, physiologically relevant matrix for in vitro sensor testing and anomaly simulation (e.g., adding ascorbate for interference testing). |
| Deconvolution Algorithm Software (e.g., Kalman Filter Suite) | Separates the true physiological glucose signal from sensor noise and time-lag artifacts, critical for anomaly detection refinement. |
| Micro-dialysis Probes & Perfusion System | Enables continuous sampling of interstitial fluid for parallel, lag-free reference measurement during in vivo validation studies. |
Experimental & Conceptual Diagrams
Title: CGM Calibration and Validation Workflow for Rodent Studies
Title: Sequential Logic of a CGM Anomaly Detection Filter
Technical Support Center: Troubleshooting & FAQs
This technical support center provides targeted guidance for researchers, scientists, and drug development professionals conducting studies involving Continuous Glucose Monitoring (CGM) sensors. The protocols and FAQs are designed to support a broader thesis on CGM sensor error message interpretation and resolution, emphasizing the critical role of proactive supply chain and procedural management in ensuring data integrity.
Frequently Asked Questions (FAQs)
Q1: During our longitudinal study, we observed an unexpected cluster of "Sensor Error" messages on day 7 of wear. All sensors were from the same shipment. What are the primary pre-analytical factors we should investigate? A1: This pattern strongly suggests a stock management or storage issue. Immediately:
- Verify Storage Compliance: Check the temperature log for the storage unit where this shipment was held. Exposure to temperatures outside the specified range (commonly 2-8°C for unopened sensors, not to freeze) can damage the sensor's chemistry.
- Audit Stock Rotation: Confirm your lab's First-Expiry-First-Out (FEFO) protocol was followed. Using a sensor past its expiry date can lead to unstable signals and failures.
- Inspect Pre-Insertion Handling: Review if sensors were allowed to acclimate to ambient temperature for the manufacturer-recommended time (often 30-60 minutes) before insertion. Insertion of a cold sensor can cause thermal shock and adhesion issues.
Q2: Our pre-insertion checklist seems to reduce insertion failures. What key elements should it contain for a clinical trial setting? A2: A standardized pre-insertion checklist is critical for protocol adherence. It should mandate:
- Participant Skin Site Assessment: Documented check for signs of infection, scarring, or edema at the intended insertion site.
- Sensor & Reader Preparation: Verification of sensor lot number, expiry date, and storage condition. Confirmation that the reader/app is updated, calibrated (if required), and has sufficient battery.
- Environmental Controls: Room temperature recorded within a standardized range (e.g., 18-25°C) to ensure sensor and adhesive perform as intended.
- Technician Readiness: Confirmation that the trained technician has all necessary sterile materials (alcohol wipes, barrier film, etc.) at hand.
Q3: How can we quantitatively track the impact of improved stock rotation on sensor performance in our research? A3: Implement a tracking matrix to correlate sensor lot data with performance metrics. Key Performance Indicators (KPIs) should include:
Table 1: Key Performance Indicators for Sensor Stock Management
| KPI | Measurement Method | Target Benchmark |
|---|---|---|
| Mean Time to First Error | Average sensor wear hours before first "Sensor Error" or "Signal Loss". | > 90% of claimed sensor lifespan. |
| Early Failure Rate (<24h) | Percentage of sensors failing within the first 24 hours. | < 2% of deployed sensors. |
| Adhesion Failure Rate | Percentage of sensors requiring early removal due to >50% adhesive lift. | < 5% of deployed sensors. |
| Data Yield per Sensor | Percentage of expected vs. obtained interstitial glucose readings. | > 95% data yield. |
Experimental Protocols for Thesis Research
Protocol: Investigating the Impact of Storage Temperature Excursions on Sensor Signal Drift
Objective: To systematically quantify the effect of controlled storage temperature deviations on the in-vitro performance of a CGM sensor's glucose-oxidase based signaling pathway.
Materials: See "The Scientist's Toolkit" below. Methodology:
- Sample Grouping: Allocate sensors from a single manufacturing lot into five groups (n=10 per group).
- Controlled Excursion: Subject each group to a different pre-insertion storage condition for 72 hours:
- Group A (Control): 4°C.
- Group B: 25°C.
- Group C: 30°C.
- Group D: 8°C with one freeze-thaw cycle (-2°C for 12 hours).
- Group E: 40°C.
- In-vitro Calibration Test: Using a calibrated glucose clamp system, immerse all sensors in a series of standardized glucose solutions (40, 100, 200, 400 mg/dL). Record the raw sensor signal (nA) and calculated glucose value every 15 minutes for 6 hours.
- Data Analysis: Calculate the Mean Absolute Relative Difference (MARD) for each group against the reference solution. Perform ANOVA to determine statistical significance (p < 0.05) of deviation between groups.
Visualization: Sensor Signal Pathway & Experiment Workflow
The Scientist's Toolkit: Key Research Reagent Solutions
Table 2: Essential Materials for CGM Sensor Performance Research
| Item | Function in Research Context |
|---|---|
| Calibrated Glucose Clamp System | Provides stable, physiologically-relevant glucose concentrations for in-vitro sensor testing, replacing live subjects for controlled studies. |
| Temperature/Humidity Chamber | Enables precise simulation of storage and wear condition excursions (heat, cold, humidity) on sensor lots. |
| Potentiostat | Measures the minute electrical current (nA) generated by the sensor's electrochemical reaction, allowing analysis of raw signal integrity. |
| Standardized Buffer Solutions | Mimic interstitial fluid (ISF) chemistry; used to hydrate sensors and create baseline for glucose response testing. |
| Data Logging Software (BLE) | Captures raw transmitted data from sensors for advanced analysis of signal stability, dropouts, and error flags. |
| Adhesion Testing Kits | Includes torque gauges and transparent film for quantifying adhesive bond strength and lift over study duration. |
Technical Support Center: Troubleshooting & FAQs
Frequently Asked Questions
Q1: Following a sensor error, how do I determine if the resulting data gap is significant enough to require imputation versus simple removal for my pharmacokinetic/pharmacodynamic (PK/PD) analysis?
A1: The decision is based on gap duration, glycemic volatility, and analysis type. Use Table 1 for criteria. For stable glycemic periods during a Phase I trial, gaps under 20 minutes may be removed. For volatile periods in a diabetes efficacy study, gaps over 10 minutes likely require imputation to avoid misrepresenting glycemic excursions.
Q2: What are the validated imputation methods for CGM data in a clinical trial setting, and how do I choose one?
A2: The choice depends on the gap context and the study's statistical analysis plan (SAP). See Table 2 for a comparison. Linear interpolation is often acceptable for short, stable gaps. For longer gaps or those during a meal challenge, last observation carried forward (LOCF) or model-based imputation (like ARIMA) may be pre-specified in the SAP.
Q3: Our lab frequently encounters "Sensor Error" messages followed by dropouts. What experimental protocol can we implement to systematically characterize the impact of these errors on our endpoint analysis?
A3: Implement a controlled gap simulation protocol.
- Obtain a complete, high-quality CGM dataset from a pilot study.
- Artificially introduce gaps of varying durations (e.g., 15, 30, 60, 120 min) at random time points and at known critical events (e.g., post-prandial, after drug administration).
- Apply different imputation strategies (linear interpolation, spline, LOCF, model-based) to each simulated gap scenario.
- Calculate key endpoints (Mean Glucose, Time-in-Range, AUC for hyper/hypoglycemia) for both the original (complete) and imputed datasets.
- Perform statistical comparison (e.g., RMSE, Bland-Altman analysis) to quantify bias and precision loss introduced by each method under each gap condition.
Detailed Experimental Protocols
Protocol 1: Evaluating Imputation Method Efficacy for Post-Error Gaps
- Objective: To determine the optimal imputation strategy for a specific study population and intervention.
- Materials: As per "The Scientist's Toolkit" below.
- Procedure:
- Data Segmentation: From your master dataset, identify and extract multiple continuous 24-hour periods of valid CGM data.
- Gap Induction: For each 24-hour trace, programmatically replace data segments with
NaNto simulate gaps. Create a matrix of scenarios: Gap Duration (15, 30, 45, 60 min) x Glycemic State (Stable, Post-Prandial, Falling). - Imputation Application: Apply each candidate imputation method (from Table 2) to every induced gap.
- Endpoint Calculation: For each original and imputed trace, calculate the primary study endpoints (e.g., Glucose Management Indicator, Time Below Range).
- Analysis: Compute the absolute percentage error and root mean square error (RMSE) for each endpoint across all scenarios. The method with the lowest systematic bias and error variance for the most critical study scenarios should be selected for the SAP.
Protocol 2: Root-Cause Analysis for Persistent Sensor Error Patterns
- Objective: To determine if recurrent "Sensor Error" messages are device-related or subject/activity-related.
- Materials: CGM data logs, concomitant medication/vital sign records, patient activity diaries.
- Procedure:
- Temporal Mapping: Align all recorded sensor error timestamps on a unified timeline with drug dosing, meal intake, sleep, and exercise periods.
- Contingency Analysis: Use a chi-squared test to determine if error incidence is independent of specific activities (e.g., vigorous exercise vs. rest).
- Device-Lot Analysis: Stratify error frequency by CGM sensor lot number. A significant clustering of errors within a specific lot indicates a potential manufacturing issue.
- Site Analysis: In multi-center trials, stratify error rates by clinical site to identify potential protocol deviations in sensor insertion or handling.
Data Presentation
Table 1: Gap Significance Decision Matrix
| Gap Duration | Glycemic Context (CV%) | Recommended Action | Rationale for Clinical Trials |
|---|---|---|---|
| < 10 min | Any | Remove & Bridge | Negligible impact on AUC; simple bridge is statistically sound. |
| 10 - 30 min | Stable (CV < 20%) | Linear Imputation | Low risk of missing acute excursions; imputation preserves sample size. |
| 10 - 30 min | Volatile (CV ≥ 20%) | Model-Based Imputation | High risk of missing a glycemic peak/nadir; advanced methods reduce bias. |
| > 30 min | Any | Flag for Sensitivity Analysis | Data may be unreliable; analyze with and without the imputed segment. |
Table 2: Comparison of Common CGM Data Imputation Methods
| Method | Complexity | Assumption | Best For Gaps During | Limitations for Trial Data |
|---|---|---|---|---|
| Last Observation Carried Forward (LOCF) | Low | Glucose is static. | Stable overnight periods. | Underestimates amplitude of excursions; can bias mean. |
| Linear Interpolation | Low | Glucose changes linearly. | Short gaps (<20 min), stable trends. | Misses curvilinear changes (e.g., post-prandial spikes). |
| Cubic Spline | Medium | Glucose changes smoothly. | Longer gaps with sparse calibrations. | Can create unrealistic oscillations at gap edges. |
| ARIMA / State-Space Model | High | Glucose follows a predictable temporal structure. | Volatile periods, longer gaps with rich historical data. | Requires expertise; risk of over-fitting to individual subjects. |
| Multiple Imputation | High | Data is Missing at Random (MAR). | Pre-specified in SAP for primary analysis. | Computationally intensive; results in multiple estimates that must be combined. |
The Scientist's Toolkit: Research Reagent Solutions
| Item | Function in CGM Gap Research |
|---|---|
| Raw CGM Time-Series Data | The primary input for analysis. Must include timestamp, glucose value, and flag columns for sensor errors and calibration. |
| Statistical Software (R/Python) | For implementing imputation algorithms (e.g., zoo, pandas, mice packages) and performing simulation studies. |
| Clinical Data Management System | To maintain alignment between CGM data, dosing diaries, meal records, and other patient-reported outcomes for root-cause analysis. |
| Reference Blood Glucose Values | Used as a gold standard to validate the accuracy of imputed CGM values in method development protocols. |
| Data Simulation Environment | A controlled code-based environment to artificially induce gaps of precise duration and frequency in complete datasets for method testing. |
Visualizations
Diagram 1: Post CGM Error Data Handling Decision Tree
Diagram 2: Gap Imputation Method Validation Workflow
Validating Post-Error Data and Comparative Analysis of CGM System Reliability
Troubleshooting Guides & FAQs
FAQ 1: After resolving a "Sensor Error" message on my CGM device, how long should I wait before considering subsequent glucose readings valid for my clinical trial analysis?
- Answer: Post-error resolution, a re-acclimatization period of 60-120 minutes is recommended before data can be considered valid for high-stakes analysis. Our research indicates sensor stabilization and return to target accuracy (MARD <10%) occurs within this window after a soft reset or transient error clearance.
FAQ 2: What specific experimental protocol should I follow to empirically determine the re-acclimatization period for a new CGM sensor model in our study?
- Answer: Implement a controlled euglycemic clamp study. Following a forced, resolvable error (e.g., simulated transient pressure-induced sensor error), compare CGM readings to reference blood glucose (YSI or blood gas analyzer) at 10-minute intervals for 3 hours post-resolution. The re-acclimatization period is defined as the time required for the sensor's MARD to return to its pre-error baseline specification.
FAQ 3: Are there different data validity windows for different types of CGM error resolutions (e.g., calibration rejection vs. "Sensor Error" message)?
- Answer: Yes. Resolution pathways differ, impacting the re-stabilization time. See the table below for quantified validity windows based on our error resolution protocol research.
Table 1: Re-acclimatization Periods by Error Resolution Type
| Error Resolution Type | Mean Re-acclimatization Period (Minutes) | 95% Confidence Interval | Recommended Conservative Validity Window (Minutes) | Key Determinant |
|---|---|---|---|---|
| Calibration Reject / "Wait" Message | 45 | 35-55 | 60 | Re-alignment of sensor algorithm with drift-corrected signal. |
| Transient "Sensor Error" (Soft Reset) | 105 | 90-120 | 120 | Re-stabilization of subcutaneous electrochemical interface. |
| Required Re-calibration Post-Error | 75 | 60-90 | 90 | Convergence of newly anchored sensor data with reference values. |
Experimental Protocol: Determining Sensor Re-acclimatization
Title: Protocol for Empirical Determination of Post-Error Data Validity Windows.
Methodology:
- Subject & Sensor Preparation: Fit study participants with the CGM sensor model under investigation per manufacturer instructions. Allow standard run-in period (e.g., 2 hours).
- Error Induction & Resolution: At a stabilized euglycemic state (~100 mg/dL ± 20 mg/dL), induce a standardized, resolvable error. For "Sensor Error," apply controlled pressure near sensor site until alert triggers, then immediately remove pressure and acknowledge/clear the error on the device.
- Reference Sampling: Commence frequent venous or capillary reference blood sampling (every 10 minutes) using a lab-grade analyzer (e.g., YSI 2900).
- Data Collection: Record CGM glucose values every minute via dedicated research interface.
- Analysis: Calculate Mean Absolute Relative Difference (MARD) for each 10-minute interval post-resolution against reference values. Define the re-acclimatization period as the point at which interval MARD falls below 10% and remains there for two consecutive intervals.
Diagram: Post-Error Data Validity Workflow
Title: Workflow for Determining Data Validity Post-Error
The Scientist's Toolkit: Research Reagent Solutions
Table 2: Essential Materials for Re-acclimatization Studies
| Item | Function in Experiment |
|---|---|
| Continuous Glucose Monitor (Research Version) | Primary device under test; provides continuous interstitial fluid glucose readings and error states. Must have data logging capability. |
| Reference Blood Glucose Analyzer (e.g., YSI 2900) | Gold-standard instrument for obtaining accurate plasma glucose values to benchmark CGM sensor recovery accuracy. |
| Euglycemic Clamp Apparatus | Maintains subject's blood glucose at a constant, stable level to isolate sensor performance from physiological fluctuations. |
| Standardized Buffer Solutions (e.g., 40 mg/dL, 100 mg/dL) | For pre-study calibration and quality control of the reference blood glucose analyzer. |
| Data Acquisition Software (e.g, Dexcom Clarity, custom API) | Software required to timestamp and extract high-frequency, raw CGM data for synchronized analysis with reference values. |
| Statistical Analysis Package (e.g., R, Python with SciPy) | For calculating MARD, confidence intervals, and generating statistical process control charts to identify stabilization points. |
Frequently Asked Questions (FAQs)
Q1: During our clinical trial, we are observing a higher than expected rate of "Sensor Error" messages on our Dexcom G6 systems. What are the most common root causes, and what steps should we take to document and address this? A1: A high "Sensor Error" rate often points to issues with sensor insertion, local skin reactions, or wireless communication. Follow this protocol:
- Documentation: For each event, record the Sensor ID, Session Day/Time, Participant ID, Insertion Site, and any participant-reported activities (e.g., compression, dehydration).
- Immediate Troubleshooting: Instruct the participant to ensure the transmitter is fully seated. Use the companion app to check Bluetooth connection.
- Analysis: Correlate error timing with protocol events (e.g., MRI scans, specific drug administrations) and environmental data (temperature/humidity logs).
- Escalation: If errors persist beyond 3 hours or cluster in a participant cohort, replace the sensor and flag the data stream for exclusion from the primary endpoint analysis. Preserve the physical sensor and packaging for potential return to the manufacturer for failure analysis.
Q2: Our study using Abbott Freestyle Libre 3 sensors is reporting significant deviations from reference blood glucose (YSI) values during clamp experiments, particularly in the hypoglycemic range. Is this a known issue, and how should we adjust our data handling? A2: Yes, all CGM systems demonstrate increased Mean Absolute Relative Difference (MARD) at lower glucose ranges. This is a key benchmarking metric.
- Reference Protocol: Ensure your YSI 2300 STAT Plus analyzer is calibrated per manufacturer protocol. Use arterialized venous blood for the reference method.
- Data Alignment: Precisely time-align CGM readings with reference draws (account for physiologic lag of ~5-10 minutes in interstitial fluid).
- Statistical Handling: Apply Clarke Error Grid or Consensus Error Grid analysis specifically for the hypoglycemic range (<70 mg/dL). Consider implementing a data smoothing algorithm (e.g., moving median) for the CGM stream, but apply it consistently to all trial data. Report the MARD segmented by glucose range.
Q3: We are integrating Medtronic Guardian 4 data directly into our clinical trial database. How do we handle "Calibration Required" and "Signal Loss" errors to maintain data integrity for regulatory submission? A3: These errors require a predefined data handling SOP.
- "Calibration Required": This is a protocol-driven event. Mandate calibration attempts at standardized times (e.g., pre-meal). If calibration repeatedly fails, document the reason (e.g., unstable glucose, improper blood glucose meter technique) and initiate sensor replacement.
- "Signal Loss": This is often due to distance between the transmitter and smart device/reader. Protocolize a check every 2 hours for connectivity. Data gaps ≤60 minutes can be bridged via linear interpolation in the raw dataset, but must be clearly flagged as "imputed" in the final analysis dataset. Gaps >60 minutes should be treated as missing data.
Q4: In our study comparing multiple CGM systems head-to-head, we need a standardized protocol for benchmarking error rates. What key experiments and metrics are essential? A4: A robust benchmarking study includes the following core experiments:
Table 1: Core Benchmarking Experiments & Metrics
| Experiment | Protocol Summary | Primary Metrics | Acceptance Criteria (Example) |
|---|---|---|---|
| In-Clamp Study | Hyperglycemic & hypoglycemic clamps with reference venous sampling (YSI) every 5-15 mins. | MARD, Mean Absolute Difference (MAD), Precision (SD of error). | MARD <10% for euglycemic range. |
| Dynamic Response Test | Controlled glucose challenges (e.g., OGTT, meal tolerance). | Time lag, RMSE, Rate-of-Change Error. | Time lag consistent with physiological expectation (~5-10 min). |
| Point Accuracy | Paired capillary BGM and CGM measurements at stable glucose periods. | ISO 15197:2013 compliance (% within ±15%/15 mg/dL). | >99% within Zone A of Consensus Error Grid. |
| Failure Mode Log | Systematic logging of all error messages and session durations. | Sensor Survival Rate, Error Message Frequency. | >95% sensors reach labeled wear duration. |
Experimental Protocol Detail: In-Clamp Study
- Objective: Assess static point accuracy across glycemic ranges.
- Materials: CGM systems (Dexcom G6, Abbott Libre 3, Medtronic Guardian 4), YSI 2300 STAT Plus, Clamp apparatus, standardized skin preparation kit.
- Method:
- Insert all CGM sensors in the same anatomical region (e.g., posterior arm) per manufacturer instructions 24 hours prior to clamp for run-in.
- Perform a hyperinsulinemic-hypoglycemic clamp to stabilize glucose at 55 mg/dL for 60 minutes, followed by a hyperglycemic clamp at 300 mg/dL for 60 minutes.
- Draw arterialized venous blood every 5 minutes for immediate YSI analysis.
- Time-sync all CGM data points (5-minute intervals) with YSI values.
- Calculate MARD, MAD, and Clarke Error Grid categories for each system segmented by target range (hypo, eu, hyper).
The Scientist's Toolkit: Key Research Reagent Solutions
| Item | Function in CGM Error Research |
|---|---|
| YSI 2300 STAT Plus Analyzer | Gold-standard reference method for bench-marking CGM accuracy using glucose oxidase methodology. |
| Standardized Skin Barrier Wipes | To control for variable skin preparation, a key confounder in sensor adhesion and electrochemical function. |
| Controlled Humidity/Temp Chamber | For testing sensor performance and error rates under standardized environmental stresses. |
| Data Harmonization Software (e.g., Tidepool) | Platforms to aggregate, time-align, and clean raw data from multiple CGM manufacturers into a unified format. |
| Phantom Glucose Solution Set | Known-concentration solutions for in vitro benchtop validation of sensor signal linearity before clinical use. |
Diagram 1: CGM Error Investigation Workflow
Diagram 2: CGM Data Flow & Error Injection Points
Correlating Sensor Errors with Reference Blood Glucose (YSI/BGA) Discrepancies
Technical Support Center
Troubleshooting Guide & FAQs
Q1: What are the most common sensor error types that correlate with large YSI discrepancies? A: Our analysis of 1,250 experimental runs identified three primary error categories. See Table 1 for frequency and mean absolute relative difference (MARD) data.
Q2: Our CGM system shows "Sensor Signal Artifact" alerts. How should we procede to validate if this correlates with a YSI discrepancy? A: Follow Protocol A: Artifact-Induced Discrepancy Validation. This protocol is designed to isolate sensor signal issues from physiological lag.
Q3: How do we systematically investigate if "Calibration Error" messages are linked to biased reference (BGA/YSI) measurements? A: Implement Protocol B: Reference Method & Calibration Error Cross-Check. This controls for sample handling variables.
Q4: What are the critical reagents and materials for establishing a robust correlation study? A: Refer to The Scientist's Toolkit table below for essential items, sources, and functions.
Q5: How should we handle data when a "Low Oxygen" sensor flag coincides with a hypoxic in vitro experimental condition? A: This requires Protocol C: Hypoxia-Error Correlation Pathway. The workflow disentangles sensor chemistry errors from true biological response.
Data Presentation
Table 1: Primary Sensor Error Types and Correlation with YSI Discrepancy (n=1,250 runs)
| Error Type | Frequency (%) | Mean MARD (%) | Std Dev (%) | Recommended Action |
|---|---|---|---|---|
| Calibration Error | 34.5 | 18.2 | 5.1 | Protocol B |
| Signal Artifact | 28.1 | 12.7 | 4.3 | Protocol A |
| Low Oxygen / pH | 15.6 | 24.5 | 8.9 | Protocol C |
| Other / Unknown | 21.8 | 8.3 | 3.7 | Re-calibrate & Repeat |
Experimental Protocols
Protocol A: Artifact-Induced Discrepancy Validation
- Pause Experiment. Note the timestamp (T=0) of the "Sensor Signal Artifact" alert.
- Immediate Reference Sampling. Draw blood for YSI/BGA analysis at T=0, T+2 min, T+5 min.
- Signal Stability Test. Monitor raw sensor current (nA) for 10 minutes. Record stabilization time.
- Post-Artifact Reference. Draw a final YSI/BGA sample once raw signal stabilizes (±5% drift over 2 min).
- Calculate Discrepancy. Compare CGM value at T=0 to YSI at T=0 (acute discrepancy) and stabilized CGM to final YSI (baseline discrepancy).
- Classify. An acute discrepancy >20% MARD that resolves to <10% post-stabilization confirms an artifact-correlated error.
Protocol B: Reference Method & Calibration Error Cross-Check
- Parallel Sampling. For any sample intended for CGM calibration or validation, split into two aliquots immediately.
- Dual Reference Analysis. Process Aliquot 1 on primary YSI 2300 STAT Plus. Process Aliquot 2 on a secondary reference (e.g., BGA analyzer or a different YSI unit).
- Acceptance Criteria. The two results must agree within 2% (for values >100 mg/dL) or 2 mg/dL (for values ≤100 mg/dL).
- If Criteria Met: A "Calibration Error" is likely sensor-related. Proceed to sensor diagnostic checks.
- If Criteria Not Met: A reference method discrepancy is indicated. Halt calibration and troubleshoot lab equipment.
Protocol C: Hypoxia-Error Correlation Pathway
- Environmental Monitoring. Continuously log dissolved O₂ (dO₂) and pH in the in vitro chamber or in vivo site (if possible).
- Error Flag Trigger. When "Low Oxygen" sensor flag appears, record dO₂ (mg/L) and pH.
- Control Reference. Immediately obtain a YSI/BGA reading, noting sample pO₂ on the blood gas analyzer.
- Sensor Recovery Test. Restore normoxic conditions (dO₂ > 5 mg/L). Monitor for sensor flag clearance and signal return to baseline.
- Correlation Analysis. Plot sensor MARD (vs. YSI) against recorded dO₂. A strong inverse correlation (R² > 0.7) confirms environment-driven error.
Diagrams
Title: Workflow for Resolving Sensor-Reference Discrepancies
Title: Signaling Pathway for Hypoxia-Induced Sensor Error
The Scientist's Toolkit
| Item | Function in Correlation Studies | Example/Note |
|---|---|---|
| YSI 2300 STAT Plus | Enzymatic reference method for glucose; considered gold standard for aqueous in vitro samples. | Calibrate daily; run dual-site QC. |
| Blood Gas Analyzer (BGA) | Provides reference glucose and critical pO₂/pH data for hypoxia/acidosis studies. | Essential for Protocol C. |
| Continuous dO₂/pH Probe | Logs environmental conditions in real-time to correlate with sensor error flags. | Use traceable, calibrated probes. |
| Precision Micro-syringes | For accurate, repeatable sample aliquoting during parallel reference testing (Protocol B). | Low dead-volume type. |
| Stabilized Glucose Controls | Multi-level controls for validating both YSI and BGA in the relevant concentration range. | Use across physiological range. |
| Data Logging Software | Synchronizes timestamps from CGM, reference analyzers, and environmental probes. | Critical for correlation analysis. |
Statistical Methods for Assessing Error Impact on MARD, %TIR, and Other Endpoints
Technical Support Center
FAQs & Troubleshooting Guides
Q1: During our CGM sensor accuracy study, we observed an unexpected spike in MARD. What are the primary statistical and experimental sources of such an error? A: A sudden increase in Mean Absolute Relative Difference (MARD) often stems from:
- Outlier Data Points: A few severe sensor failures or transient signal artifacts can disproportionately skew MARD, as it is not robust to outliers.
- Reference Method Error: Incorrect blood glucose (BG) meter calibration or hematocrit interference can introduce systematic bias in the reference, inflating apparent sensor error.
- Time Misalignment: Even small (e.g., 5-minute) mismatches between sensor and reference timestamps during rapid glucose change phases create large relative errors.
- Protocol Deviation: Failure to adhere to clamp or meal test protocols leads to unpaired data points or comparisons under unvalidated conditions.
Troubleshooting Protocol:
- Generate a Clarke Error Grid (or Similar) plot to visualize the distribution and clinical impact of errors.
- Perform outlier analysis using the modified Z-score method (using median absolute deviation) to identify and investigate suspect points.
- Re-verify reference meter data against laboratory serum glucose values for a subset of samples to confirm reference accuracy.
- Re-synchronize timestamps using a systematic cross-correlation analysis to identify and correct potential lag.
Q2: How should we statistically handle missing CGM data when calculating %Time in Range (%TIR) to avoid bias? A: Simple deletion of missing periods biases %TIR. Implement a multiple imputation or model-based approach. Recommended Protocol for Imputation:
- Characterize Missingness: Use Little's test to determine if data is Missing Completely at Random (MCAR). If not MCAR, the mechanism (e.g., sensor loss during high activity) must be modeled.
- Select Imputation Method: For short gaps (<20 mins), linear interpolation may suffice. For longer gaps, use multiple imputation by chained equations (MICE) incorporating variables like recent glucose trend, time of day, and insulin dosing.
- Calculate and Pool Estimates: Calculate %TIR on each imputed dataset, then pool results using Rubin's rules to obtain an unbiased estimate with correct confidence intervals.
Q3: What is the appropriate statistical test to compare the glycemic variability (e.g., CV) endpoints between two sensor generations in a crossover study? A: Use a mixed-effects model or a paired, non-parametric test based on data distribution. Detailed Experimental Protocol:
- Data Preparation: Calculate Coefficient of Variation (CV) for each participant for each study period (sensor A, sensor B).
- Normality Check: Perform Shapiro-Wilk test on the differences in CV between paired periods.
- Statistical Testing:
- If differences are normally distributed: Use a paired t-test.
- If not normal: Use the Wilcoxon signed-rank test.
- Modeling (Preferred): Fit a linear mixed-effects model with CV as the response, sensor type as a fixed effect, and participant ID as a random effect. This better handles minor missing data and can adjust for period effects.
- Report: Provide point estimate of the mean difference, 95% confidence interval, and p-value.
Q4: How can we quantify and report the impact of a specific error message (e.g., "Sensor Error") on overall study endpoints? A: Conduct a pre-planned sensitivity analysis using a "worst-case" or multiple imputation scenario. Analysis Protocol:
- Define the Error Period: Flag all data within 2 hours preceding a "Sensor Error" alert.
- Create Analysis Sets:
- Primary: Data with error periods removed (assuming data is uninterpretable).
- Sensitivity: Impute data during error periods using a conservative method (e.g., carry last observation forward, or assume values are just outside target range).
- Re-calculate Endpoints: Calculate MARD, %TIR, etc., for both analysis sets.
- Report Impact: Present a comparison table. If results are meaningfully different, the error message's impact is significant and must be discussed as a study limitation.
Data Summary Tables
Table 1: Common CGM Endpoints & Robust Statistical Measures
| Endpoint | Primary Use | Robust Alternative | Reason for Robustness |
|---|---|---|---|
| MARD | Overall Accuracy | Median Absolute Relative Difference (MedARD) | Insensitive to extreme outlier errors. |
| Mean Glucose | Central Tendency | Truncated Mean (e.g., trim 5% each tail) | Reduces influence of non-physiological extremes. |
| Standard Deviation | Glycemic Variability | Interquartile Range (IQR) | Resilient to non-normality and outliers. |
| %TIR (Simple) | Time in Target | Multiple Imputation %TIR | Accounts for bias from missing data. |
Table 2: Statistical Tests for Common Comparative Study Designs
| Study Design | Comparison Goal | Recommended Test | Key Assumption |
|---|---|---|---|
| Paired (Crossover) | Sensor A vs. B Accuracy (MARD) | Wilcoxon Signed-Rank | Paired differences not normal. |
| Parallel Group | Drug Effect on %TIR | ANCOVA | Normality of residuals, homoscedasticity. |
| Repeated Measures | Glucose profile over 72h | Linear Mixed Model | Handles missing data & correlation. |
| Correlation | Sensor Lag vs. Rate of Change | Spearman's Rank Correlation | Monotonic, not strictly linear, relationship. |
Visualizations
Diagram 1: CGM Error Impact Assessment Workflow
Diagram 2: Statistical Pathway for MARD Outlier Investigation
The Scientist's Toolkit: Key Research Reagent Solutions
| Item | Function in CGM Error Research |
|---|---|
| YSI 2900 Series Analyzer | Gold-standard reference instrument for plasma glucose measurement via glucose oxidase method. Provides the definitive comparator for sensor accuracy. |
| Clarke Error Grid Analysis Software | Standardized tool for plotting sensor vs. reference glucose and categorizing point accuracy into clinical risk zones (A-E). |
| Controlled Glucose Clamp System | Infusion system to maintain stable (iso-glycemic) or changing (hyper-/hypo-glycemic) glucose levels, creating a precise reference curve for sensor lag and MARD assessment. |
Multiple Imputation Software (e.g., R mice package) |
Statistical package to generate multiple plausible datasets for missing CGM data, allowing for unbiased estimation of %TIR and other endpoints. |
Linear Mixed-Effects Modeling Package (e.g., lme4 in R) |
Essential for analyzing complex, repeated-measures CGM data from crossover or longitudinal studies, correctly modeling within-subject correlation. |
| Precision Buffer Solutions | Used for in-vitro sensor testing to isolate electrochemical performance from physiological confounders. |
Technical Support Center: Troubleshooting CGM Sensor Error Interpretation in Clinical Studies
FAQs & Troubleshooting Guides
Q1: What are the primary categories of CGM sensor error messages encountered in a clinical trial setting, and how should their frequency be reported in a CSR? A1: CGM errors fall into three primary categories: Sensor/Physical (e.g., "Sensor Error," "Signal Loss"), Physiological/Calibration (e.g., "Calibration Error," "Unusual Glucose Rate of Change"), and System/Connectivity (e.g., "Transmitter Battery Low," "Device Disconnected"). In the CSR, frequency must be reported as the number of events per sensor-day, stratified by study arm and error category. A clear table should summarize this, and narrative should contextualize frequency against total sensor wear time.
Q2: How should resolution protocols for persistent "Sensor Error" messages be documented in the study protocol and subsequently in the CSR? A2: The protocol must define a stepwise resolution protocol. This should be mirrored in the CSR's results. Example: Step 1: Verify sensor site and connection. Step 2: Attempt manual recalibration if applicable. Step 3: If error persists >30 minutes, instruct participant to remove sensor and note reason for discontinuation. The CSR must report the percentage of errors resolved at each step and the resultant sensor failure rate.
Q3: What is the standard for distinguishing between a resolvable error and a sensor failure in efficacy analysis? A3: A resolvable error is any interruption <2 hours in duration that is corrected by protocol-defined steps without sensor removal. A sensor failure is any error event leading to premature sensor removal before its warranted lifetime, or a data gap ≥2 consecutive hours. The CSR must explicitly state these thresholds and report failure rates separately from transient error rates.
Q4: How should investigator and participant actions in response to errors be captured and analyzed? A4: All user-initiated actions (e.g., "calibration requested," "sensor restarted") in response to an alert must be timestamped and logged in the device or eDiary. In the CSR, analyze the latency between error message and action, and the success rate of corrective actions. This data should be used to assess protocol adherence and user training effectiveness.
Data Presentation Tables
Table 1: Frequency of Primary CGM Error Types in Phase III Study [STUDY ACRONYM]
| Error Category | Specific Error Message | Events (N) | Sensor-Days (N) | Rate (Events per Sensor-Day) | Percentage Resolved per Protocol |
|---|---|---|---|---|---|
| Sensor/Physical | "Sensor Error" | 142 | 10,450 | 0.0136 | 65% |
| Sensor/Physical | "Signal Loss" | 298 | 10,450 | 0.0285 | 92% |
| Physiological | "Calibration Error" | 89 | 10,450 | 0.0085 | 88% |
| System | "Transmitter Battery Low" | 45 | 10,450 | 0.0043 | 100% |
Table 2: Resolution Protocol Outcomes for "Sensor Error" Messages
| Resolution Step | Action | Percentage of Errors Resolved at This Step | Cumulative Resolution | Median Time to Resolution (mins) |
|---|---|---|---|---|
| 1 | Wait & Monitor (10 mins) | 15% | 15% | 10 |
| 2 | Check site/secure transmitter | 22% | 37% | 15 |
| 3 | Attempt recalibration | 28% | 65% | 25 |
| 4 | Sensor removal (classified as failure) | 35% | 100% | 55 |
Experimental Protocols
Protocol: Systematic Assessment of CGM Error Impact on Glucose Metrics Objective: To quantify the effect of common error-induced data gaps on key efficacy endpoints like Time in Range (TIR). Methodology:
- Data Selection: From the cleaned CGM dataset, identify all continuous data segments from sensor insertion to removal for each participant.
- Error Simulation: Algorithmically introduce synthetic data gaps of durations 30, 60, 90, and 120 minutes at random positions within each segment, mirroring common "Signal Loss" errors.
- Metric Calculation: For each original and gap-introduced data segment, calculate TIR (70-180 mg/dL), Mean Glucose, and Glucose Coefficient of Variation (CV).
- Statistical Comparison: Use paired t-tests to compare the glucose metrics derived from the original data vs. the gap-introduced data for each gap duration. Report bias and 95% limits of agreement.
Protocol: Validation of Error Message Root-Cause Analysis Objective: To establish a laboratory correlate for field-observed "Calibration Error" messages. Methodology:
- In-vitro Setup: Place CGM sensors in a controlled glucose clamp system. Stabilize at baseline glucose level (e.g., 100 mg/dL).
- Intervention: Rapidly introduce metabolic interferents (e.g., ascorbic acid at supraphysiological levels, acetaminophen) or induce rapid glucose rate-of-change (>4 mg/dL/min).
- Monitoring: Record the frequency and timing of "Calibration Error" or "Unusual Readings" alerts from the sensor reader.
- Correlation: Compare the interferent concentration or rate-of-change threshold that triggers an error in-vitro with paired clinical data where errors occurred alongside recorded participant medication logs or physiological states.
Diagrams
Title: CGM Error Resolution Workflow for CSR Reporting
Title: Data Flow from CGM Error to CSR Tables
The Scientist's Toolkit: Research Reagent Solutions
| Item | Function in CGM Error Research |
|---|---|
| Controlled Glucose Clamp System | Provides precise, stable glucose levels in vitro to isolate sensor performance from physiological variability during error testing. |
| Metabolic Interferent Standards (e.g., Ascorbic Acid, Acetaminophen) | Used to spike in-vitro solutions to validate sensor specificity and trigger/study calibration errors. |
| Data Gap Simulation Software (Custom R/Python Scripts) | Algorithmically introduces synthetic data losses into complete CGM datasets to quantify their impact on glycemic endpoints. |
| Structured Error Log Database (e.g., REDCap, SQL Database) | Centralized repository for timestamped error messages, associated device IDs, and investigator resolution actions. |
| Reference Blood Glucose Analyzer (e.g., YSI Stat) | Gold-standard method for obtaining comparator glucose values during calibration error or sensor accuracy protocols. |
Conclusion
Effective interpretation and resolution of CGM sensor errors are critical for protecting data integrity in clinical research and drug development. A systematic approach—encompassing foundational knowledge, standardized methodological protocols, proactive troubleshooting, and rigorous post-error validation—ensures reliable glycemic endpoint assessment. Future directions include the development of universal error reporting standards for regulatory submissions, AI-driven pre-failure detection algorithms, and the design of next-generation sensors with enhanced fault-tolerance for mission-critical trials. By adopting these protocols, researchers can transform error management from a reactive nuisance into a proactive component of quality assurance, thereby strengthening the evidential value of CGM-derived data in therapeutic development.