CGM Sensor Accuracy Comparison 2025: A Detailed Analysis for Biomedical Research and Drug Development
This article provides a comprehensive, evidence-based analysis of continuous glucose monitoring (CGM) sensor accuracy across leading brands and models, including Dexcom G7, Abbott FreeStyle Libre 3, and Medtronic Simplera.
CGM Sensor Accuracy Comparison 2025: A Detailed Analysis for Biomedical Research and Drug Development
Abstract
This article provides a comprehensive, evidence-based analysis of continuous glucose monitoring (CGM) sensor accuracy across leading brands and models, including Dexcom G7, Abbott FreeStyle Libre 3, and Medtronic Simplera. Tailored for researchers, scientists, and drug development professionals, it synthesizes foundational accuracy metrics, evaluates methodological approaches for performance assessment, outlines troubleshooting and optimization strategies, and presents head-to-head comparative validation data. The scope encompasses key performance indicators like MARD, the impact of study design on reported accuracy, and the implications of sensor performance for clinical trials and therapeutic development.
Understanding CGM Accuracy: Core Metrics, Standards, and the Competitive Landscape
The evaluation of continuous glucose monitoring (CGM) systems extends beyond simple numerical comparisons to encompass a multi-faceted approach that considers analytical precision, clinical consequences, and regulatory compliance. For researchers and pharmaceutical professionals conducting comparative studies of CGM brands and models, understanding the interplay between Mean Absolute Relative Difference (MARD), consensus error grids, and ISO standards is fundamental to generating valid, clinically relevant data. This framework for sensor accuracy assessment has evolved significantly from early blood glucose monitors to today's advanced continuous systems, with each metric contributing unique insights into device performance. This guide examines the experimental methodologies, comparative data, and appropriate applications of these key metrics to equip researchers with robust tools for objective sensor evaluation.
Understanding the Key Accuracy Metrics
Mean Absolute Relative Difference (MARD)
MARD represents the primary statistical measure for quantifying the numerical accuracy of CGM systems. Calculated as the average of the absolute percentage differences between sensor glucose readings and reference values, a lower MARD indicates higher analytical accuracy [1]. Despite its widespread use, researchers must recognize that MARD represents the performance of the complete system (sensor + algorithm) rather than the sensor element alone [2].
The computation involves temporally matching CGM readings to reference measurements (typically YSI analyzer or capillary blood glucose), calculating the absolute relative difference for each pair, and averaging these values across all data points [2]. While a MARD below 10% is generally considered indicative of good performance, this value is influenced by numerous factors including glucose range, rate of glycemic change, and study design, making direct comparisons between studies problematic [2].
Key Limitations of MARD:
- Does not differentiate between overestimation and underestimation errors
- Fails to distinguish systematic bias from random error
- Provides no information on clinical risk of inaccurate readings
- Heavily influenced by the distribution of glucose values in the dataset
- Offers limited insight during dynamic glucose transitions [2]
Error Grid Analysis: From Clarke to Surveillance
Error grids provide a crucial clinical context to accuracy assessment by evaluating the potential risk of adverse treatment decisions based on sensor inaccuracies. Three primary error grids have been developed with increasing sophistication.
Clarke Error Grid (CEG): Developed in 1987 through consensus of five clinicians, the CEG divides sensor-reference data pairs into five risk zones (A-E) based on assumptions about patient self-management practices [3]. Zone A represents clinically accurate measurements (within ±20% of reference values ≥70 mg/dL), while Zones C-E signify increasingly dangerous errors. The CEG has been criticized for discontinuous risk categories and limited clinical input [3].
Parkes Error Grid (PEG): Also known as the Consensus Error Grid, this 2000 refinement incorporated survey responses from 100 clinicians and introduced separate grids for type 1 and type 2 diabetes [3]. The PEG maintains five risk zones but with modified boundaries that reflect greater clinical input. The ISO 15197:2013 standard specifies that 99% of measured values should fall within Zones A and B of the PEG [3].
Surveillance Error Grid (SEG): The most recent development (2014) incorporates input from 206 international diabetes experts and introduces a continuous risk spectrum from no risk (0) to extreme risk (±4) [3]. The SEG is particularly valuable for post-market surveillance as it provides greater sensitivity in detecting clinically significant inaccuracies across the entire glycemic range [3].
ISO Standards: Regulatory Frameworks
The ISO 15197:2013 standard establishes minimum accuracy requirements for in vitro blood glucose monitoring systems, with specific criteria differing slightly between the ISO and FDA frameworks [4].
Table: ISO 15197:2013 and FDA Accuracy Requirements
| Setting | ISO 15197:2013 Requirements | FDA Requirements |
|---|---|---|
| Home Use | 95% within ±15% for BG ≥100 mg/dL95% within ±15 mg/dL for BG <100 mg/dL99% in Parkes Error Grid Zones A or B | 95% within ±15% for all BG in usable range99% within ±20% for all BG in usable range [4] |
| Hospital Use | 95% within ±12% for BG ≥75 mg/dL95% within ±12 mg/dL for BG <75 mg/dL | 98% within ±15% for BG ≥75 mg/dL98% within ±15 mg/dL for BG <75 mg/dL [4] |
For CGM systems specifically, while no dedicated ISO standard exists yet, the analytical performance is typically characterized using MARD alongside error grid analysis, with increasing emphasis on time-in-range metrics as complementary endpoints [2].
Comparative Performance Data of Current CGM Systems
Recent head-to-head comparisons provide valuable insights into the relative performance of leading CGM systems. A 2024 multicenter, prospective study compared the point accuracy of Dexcom G7 and FreeStyle Libre 3 sensors in adults with type 1 and type 2 diabetes [5].
Table: Direct Comparison of Dexcom G7 vs. FreeStyle Libre 3 Accuracy
| Accuracy Metric | FreeStyle Libre 3 | Dexcom G7 | P-value |
|---|---|---|---|
| Overall MARD | 8.9% | 13.6% | <0.0001 |
| Values within ±20 mg/dL/±20% | 91.4% | 78.6% | Not reported |
| MARD (Hours 0-12) | Comparable | Comparable | Not significant |
| MARD (Hours 12-24) | 10.0% | 15.1% | <0.0001 [5] |
The study demonstrated significantly lower MARD values for FreeStyle Libre 3 across all evaluated metrics, with particularly notable differences emerging after the first 12 hours of wear [5]. This temporal pattern suggests potential differences in sensor stabilization or algorithm performance between the systems.
When examining performance across glycemic ranges, historical data reveals important patterns in sensor behavior:
Table: MARD by Glucose Range from Historical CGM Studies
| CGM System | Hypoglycemia (<70 mg/dL) | Euglycemia (70-180 mg/dL) | Hyperglycemia (>180 mg/dL) |
|---|---|---|---|
| Guardian | 16.1% | 15.2% | Not reported |
| DexCom STS | 21.5% | 21.2% | Not reported |
| Navigator | 10.3% | 15.3% | Not reported |
| Glucoday | 17.5% | 15.6% | Not reported [6] |
These variations highlight the importance of assessing CGM performance across the entire glycemic spectrum, particularly in hypoglycemia where clinical risks are most significant.
Experimental Protocols for Accuracy Assessment
Standardized Study Designs
Robust accuracy assessment requires carefully controlled study designs. The 2024 comparative study exemplifies key methodological elements [5]:
Population: Adults with type 1 or type 2 diabetes using insulin therapy. Typical studies enroll 50-60 participants to ensure adequate statistical power.
Reference Method: Venous blood samples analyzed using YSI 2300 Stat Plus glucose analyzer as primary reference, with capillary blood glucose measurements as secondary comparison.
Sensor Deployment: Participants wear sensors on the back of upper arms (opposite arms when comparing multiple devices), with insertion following manufacturers' instructions for use.
Testing Schedule: Multiple in-clinic visits with frequent reference measurements (every 15-30 minutes) over sensor wear period, capturing fasting, pre-prandial, post-prandial, and nocturnal periods.
Data Collection: Capillary blood glucose tests performed at least 8 times daily, including upon waking, before/after meals, and bedtime, with precise temporal matching to sensor values.
This methodology captures performance across diverse glycemic conditions while maintaining clinical relevance.
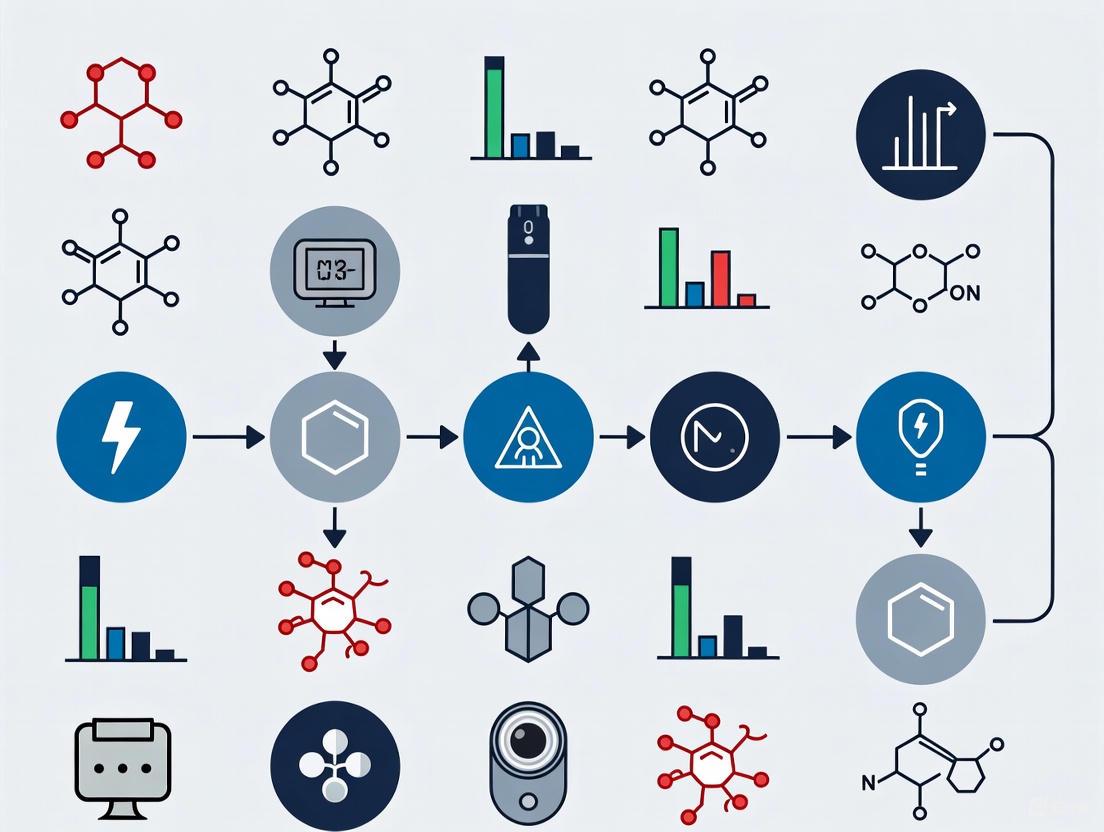
CGM Accuracy Assessment Workflow
The Scientist's Toolkit: Essential Research Reagents
Table: Key Materials and Equipment for CGM Accuracy Studies
| Item | Function | Example Products |
|---|---|---|
| Laboratory Reference Analyzer | Provides gold-standard glucose measurements for accuracy comparison | YSI 2300 Stat Plus [5] |
| Capillary Blood Glucose System | Secondary comparison method; used for frequent sampling | FreeStyle Libre 14 Day Reader with Neo test strips [5] |
| CGM Systems | Devices under evaluation; multiple sensors from different lots | Dexcom G7, FreeStyle Libre 3 [5] |
| Data Synchronization Tools | Ensures precise temporal matching between sensor and reference values | Master clock systems, timestamped data collection [6] |
| Clamp Equipment | Creates controlled glycemic conditions (euglycemia, hypoglycemia) | Hyperinsulinemic clamp protocols [6] |
Interpreting the Complete Accuracy Profile
Integrating Multiple Metrics
Comprehensive CGM evaluation requires integrating all three accuracy dimensions:
MARD provides the overall numerical accuracy but lacks clinical context. The 2024 study showing 8.9% vs. 13.6% MARD for FreeStyle Libre 3 vs. Dexcom G7 indicates superior analytical performance for FreeStyle Libre 3 [5].
Error Grids translate numerical differences into clinical risk. The ISO requirement of 99% values in Parkes Error Grid Zones A+B ensures clinically acceptable performance [3] [4].
ISO Standards establish minimum performance thresholds for regulatory approval and clinical use [4].
Three Dimensions of CGM Accuracy Assessment
Limitations and Considerations
Researchers should acknowledge several critical limitations when interpreting accuracy data:
MARD Variability: The same CGM system can demonstrate significantly different MARD values across studies due to differences in study population, reference method, glycemic variability, and data analysis methods [2].
Clinical vs. Analytical Accuracy: A sensor with favorable MARD may still pose clinical risks if errors occur at critical glycemic thresholds, underscoring the necessity of error grid analysis [3].
Real-world Performance: Controlled study conditions may not reflect actual use, where factors like sensor insertion technique, motion artifacts, and interfering substances affect accuracy [4] [2].
The comprehensive assessment of CGM accuracy requires a multi-dimensional approach that integrates numerical, clinical, and regulatory perspectives. MARD provides essential statistical analysis of numerical accuracy, error grids evaluate clinical risk, and ISO standards establish minimum performance requirements. Recent comparative data demonstrates significant performance differences between current-generation systems, with FreeStyle Libre 3 showing superior MARD (8.9%) compared to Dexcom G7 (13.6%) in a head-to-head trial [5]. For researchers conducting sensor comparison studies, robust experimental design incorporating standardized protocols, appropriate reference methods, and analysis across all glycemic ranges is essential for generating clinically meaningful results. As CGM technology continues to evolve, these accuracy metrics provide the foundational framework for objective performance evaluation in both research and clinical settings.
Continuous Glucose Monitoring (CGM) systems have transformed diabetes management by providing real-time interstitial glucose measurements, enabling researchers and clinicians to move beyond periodic snapshot assessments. The competitive landscape is dominated by three major entities: Dexcom, Abbott, and Medtronic. Each offers distinct technological approaches, with accuracy—quantified as Mean Absolute Relative Difference (MARD)—serving as the critical performance parameter for scientific and clinical evaluation [7]. The following table summarizes the core specifications of each manufacturer's flagship systems for 2025.
Table 1: Key Specifications of Major CGM Systems (2025)
| Feature | Dexcom G7 / G7 15-Day | Abbott FreeStyle Libre 3 | Medtronic Simplera/Sync |
|---|---|---|---|
| Wear Time | 10.5 days (G7), 15.5 days (G7 15-Day) [8] [9] | 14 days [7] | 7 days [10] |
| Reported MARD (Accuracy) | 8.0% (G7 15-Day) [11] [8] | ~8.9% [7] | Varies by study (~9-10%) [7] |
| Calibration | Factory-calibrated [10] | Factory-calibrated [10] | Factory-calibrated, allows optional calibration [10] |
| Key Technological Strengths | High integration with AID systems and smart pens [11], Waterproof [8] | Thin, compact design [7], Low cost [7] | Strong hypoglycemia detection [10], Integrated with MiniMed 780G pump [12] |
| Research & Clinical Notes | Recently launched 15-day sensor; most accurate claimed MARD [8] [9] | New Plus system with 15-day wear and reduced vitamin C interference [13] | Also developing interoperability with Abbott's Instinct sensor [12] |
Comparative Performance Data from Independent Studies
Independent, head-to-head studies provide critical data for cross-platform evaluation. A 2025 study published in the Journal of Diabetes Science and Technology by Eichenlaub et al. offers a direct comparison of the three systems under controlled and free-living conditions [10] [14].
The study evaluated 24 adults with type 1 diabetes who wore all three sensors simultaneously for up to 15 days. Accuracy was assessed against multiple reference methods during supervised glycemic excursions, providing a comprehensive profile of each system's performance across the dynamic glucose range [14].
Table 2: Head-to-Head Accuracy Metrics (Eichenlaub et al., 2025) [10] [14]
| Performance Metric | Dexcom G7 | Abbott FreeStyle Libre 3 | Medtronic Simplera |
|---|---|---|---|
| Overall MARD vs. YSI (Lab) | 12.0% | 11.6% | 11.6% |
| Overall MARD vs. Contour Next (Meter) | 10.1% | 9.7% | 16.6% |
| Hypoglycemia Detection Rate | 80% | 73% | 93% |
| Hyperglycemia Detection Rate | ~99% | ~99% | 85% |
| First-Day Accuracy (MARD) | ~12.8% | ~10.9% | ~20.0% |
The data reveals that while all systems showed higher MARDs in this independent study compared to manufacturer-reported figures, FreeStyle Libre 3 and Dexcom G7 demonstrated more consistent accuracy against different reference methods compared to Medtronic Simplera [14]. A key finding is the performance trade-off across glucose ranges: Libre 3 and G7 excelled in normoglycemic and hyperglycemic ranges, whereas Simplera demonstrated superior sensitivity in detecting hypoglycemic events, albeit with a higher rate of false alarms [10].
Experimental Protocols in CGM Performance Research
The reliability of CGM performance data is intrinsically linked to the rigor of the experimental methodology. The following workflow details the key procedures from a standardized head-to-head comparison study.
Detailed Methodology Breakdown
The protocol illustrated above is designed to evaluate sensor performance under clinically relevant conditions [14]:
Participant Recruitment and Sensor Deployment: The study enrolled 24 adult participants with type 1 diabetes. Each participant wore one sensor from each of the three CGM systems (Dexcom G7, Abbott FreeStyle Libre 3, Medtronic Simplera) in parallel on the upper arm for a duration of 15 days. Sensor replacement was performed according to their respective lifespans (G7 on day 5, Simplera on day 8, Libre 3 lasted 14 days) to ensure data coverage for the intended wear life [14].
Frequent Sampling and Glycemic Excursion: Participants underwent three 7-hour in-clinic frequent sampling periods (FSPs) on days 2, 5, and 15. During these sessions, comparator blood glucose measurements were taken every 15 minutes using three different methods:
- YSI 2300 STAT PLUS: A laboratory-grade glucose oxidase analyzer (venous) [14].
- COBAS INTEGRA 400 plus: A hospital-grade hexokinase analyzer (venous) [14].
- Contour Next: A handheld glucose dehydrogenase-based blood glucose meter (capillary) [14]. Simultaneously, a standardized glucose manipulation procedure was employed to induce transient hyperglycemia, hypoglycemia, and rapid glucose changes, ensuring a challenging and clinically representative test environment [14].
Data Analysis and Accuracy Metrics: CGM readings were time-matched to the nearest comparator value. Key analytical metrics included:
- Mean Absolute Relative Difference (MARD): The average percentage absolute error between CGM and reference values [14].
- Agreement Rate (AR): The percentage of CGM values within ±20 mg/dL or ±20% of the reference value [14].
- Error Grid Analysis (EGA): Assessment of clinical accuracy and potential for erroneous treatment decisions [14].
- Alert Reliability: Calculation of true positive rates for hypoglycemia and hyperglycemia alerts [14].
The Scientist's Toolkit: Key Reagents and Materials
The following table details essential materials and their functions as used in standardized CGM performance studies, providing a reference for researchers seeking to replicate or evaluate such protocols.
Table 3: Essential Research Materials for CGM Performance Studies
| Item | Function in Experiment | Example Product |
|---|---|---|
| Laboratory Glucose Analyzer | Provides high-precision reference measurement for serum/plasma glucose; considered the gold standard. | YSI 2300 STAT PLUS (Glucose Oxidase method) [14] |
| Hospital Clinical Chemistry Analyzer | Provides high-precision reference measurement; mimics hospital lab standards. | COBAS INTEGRA 400 plus (Hexokinase method) [14] |
| Blood Glucose Meter | Provides capillary reference measurement; represents typical point-of-care or patient self-monitoring. | Contour Next (Glucose Dehydrogenase method) [14] |
| CGM Systems (Units Under Test) | The devices being evaluated for accuracy and performance against reference methods. | Dexcom G7, Abbott FreeStyle Libre 3, Medtronic Simplera [14] |
| Glycemic Excursion Protocol | Standardized procedure to induce controlled glucose fluctuations across a wide range, testing sensor performance in dynamic states. | Carbohydrate-rich meal + delayed insulin bolus + controlled exercise [14] |
Core Biosensing Pathway of CGM Systems
The fundamental biochemical principle underlying most modern CGM systems is based on the electrochemical detection of glucose in the interstitial fluid. The following diagram illustrates this common signaling pathway.
The competitive landscape of CGM technology in 2025 is characterized by rapid innovation from Dexcom, Abbott, and Medtronic, each with distinct strategic advantages. Dexcom emphasizes high accuracy and extensive integration with automated insulin delivery ecosystems [11] [8]. Abbott focuses on affordability, miniaturization, and user convenience with its discreet, long-wear sensors [7] [13]. Medtronic leverages its strength in closed-loop systems, with its sensors optimized for integration with the MiniMed 780G pump and demonstrating strong hypoglycemia detection capabilities [10] [12].
For the research community, the choice of system depends heavily on the specific endpoints of a study. Investigations prioritizing overall glycemic control and hyperglycemia reduction may favor systems like Dexcom G7 or FreeStyle Libre 3 for their consistency in the normo- and hyperglycemic ranges. Conversely, studies focused on hypoglycemia prevention may find value in Medtronic's high-sensitivity profile. The ongoing trend toward interoperability, as seen with the Medtronic-Abbott partnership on the Instinct sensor, promises to further decouple CGM selection from insulin delivery hardware, offering greater flexibility for future clinical trial design and therapeutic development [12].
The management of diabetes has been revolutionized by technologies that allow for frequent glucose measurements. Currently, two primary physiological compartments are utilized for this purpose: blood and interstitial fluid (ISF) [15]. Blood glucose monitoring (BGM) systems, which include traditional fingerstick meters, measure glucose within capillary blood. In contrast, continuous glucose monitoring (CGM) systems measure glucose within the interstitial fluid, the fluid that bathes the cells in subcutaneous tissue [15]. Understanding the physiological relationship between these two compartments is fundamental to evaluating the performance, accuracy, and appropriate use of modern glucose sensing technologies, particularly in a research and development context.
This guide provides an objective comparison grounded in physiological principles and experimental data. It is structured to support researchers, scientists, and drug development professionals in making informed decisions when selecting and validating glucose monitoring systems for clinical trials and product development.
Physiological Basis and Compartmental Dynamics
The key to understanding CGM performance lies in the physiological dynamics between blood glucose (BG) and interstitial fluid glucose (ISFG).
The Physiological Lag
ISF is not blood; it is a filtrate of plasma. Glucose is transported from the capillaries into the interstitial space via diffusion and convection. This process is not instantaneous, leading to a physiological time lag between changes in blood glucose and changes in interstitial glucose [16]. This lag is most pronounced during periods of rapidly changing glucose levels, such as after a meal, during physical exercise, or immediately after an insulin bolus [16]. Consequently, a CGM system will naturally trail behind a blood glucose meter during these dynamic periods.
Implications for Accuracy Assessment
The physiological lag means that a direct, moment-to-moment comparison between ISF glucose and blood glucose is inherently complex. The observed difference, or mean absolute relative difference (MARD), is not solely due to sensor measurement error but also includes this physiological component [16]. This is the primary reason why accuracy standards developed for blood glucose meters (BGMs), such as the ISO 15197:2013, cannot be directly applied to the assessment of CGM systems [16] [15]. The ISO standard evaluates measurements within a single compartment (blood), whereas CGM validation involves comparing measurements from two different physiological compartments [16].
Table 1: Key Characteristics of Glucose Measurement Compartments
| Characteristic | Blood Glucose (BGM) | Interstitial Fluid Glucose (CGM) |
|---|---|---|
| Physiological Source | Capillary blood (fingerstick) | Subcutaneous tissue fluid |
| Measurement Type | Episodic, single point-in-time | Continuous, data points every 1-5 minutes |
| Physiological Lag | Not applicable (reference) | 5-15 minutes behind blood glucose during rapid changes [16] |
| Primary Use | Calibration point; reference for CGM; snapshot for therapy decisions | Trend analysis, pattern recognition, forecasting via trend arrows |
| Defining Standard | ISO 15197:2013 [15] | No universally accepted standard; often evaluated via MARD and Error Grids [16] [15] |
Figure 1: Physiological and Technical Pathway from Blood Glucose to CGM Readout. The diagram illustrates the physiological lag during glucose transport from blood to interstitial fluid, a key factor in CGM performance.
Experimental Protocols for Assessing CGM Accuracy
Evaluating the accuracy of CGM systems requires carefully controlled studies designed to capture performance across the entire glycemic range and under dynamic conditions.
Standardized In-Clinic Testing
A comprehensive approach, as detailed in a 2025 head-to-head comparison study, involves prospective, interventional studies with participants wearing multiple CGM sensors simultaneously [14]. Key methodological steps include:
- Participant Cohort: Typically adults with type 1 diabetes, excluding those with severe hypoglycemia unawareness or very high HbA1c (>10%) to standardize the population [14].
- Sensor Placement: Participants insert sensors of all systems being tested (e.g., FreeStyle Libre 3, Dexcom G7, Medtronic Simplera) in the upper arms, with sites distributed between arms [14].
- Frequent Sampling Periods (FSPs): Multiple in-clinic sessions are conducted where glucose levels are manipulated. During these 7-hour FSPs, reference blood glucose measurements are taken every 15 minutes using multiple methods [14].
- Glucose Manipulation: A key component is inducing clinically relevant glycemic scenarios. Participants consume a carbohydrate-rich breakfast followed by a delayed insulin bolus. This protocol is designed to create a sequence of hyperglycemia, followed by a rapid glucose decline into hypoglycemia, and finally a return to normoglycemia. This tests sensor accuracy across all glycemic ranges and during rapid glucose changes [14] [10].
- Multiple Reference Methods: Using different comparator methods highlights the impact of the reference itself. Common standards include:
The Researcher's Toolkit: Key Reagents and Materials
Table 2: Essential Materials for CGM Performance Studies
| Item | Function in Experiment | Example Products |
|---|---|---|
| CGM Systems | The devices under evaluation; factory-calibrated sensors worn by participants. | FreeStyle Libre 3, Dexcom G7, Medtronic Simplera [14] |
| Laboratory Analyzer | High-precision reference method for venous plasma glucose; provides primary endpoint data. | YSI 2300 STAT PLUS (Glucose Oxidase), COBAS INTEGRA (Hexokinase) [14] |
| Blood Glucose Meter | High-accuracy meter for capillary blood glucose reference during free-living periods and clinic sessions. | Contour Next [14] |
| Data Logging Device | A dedicated smart device (e.g., Android) to host CGM software applications and collect data. | Standardized smartphone or receiver [14] |
Figure 2: Generalized Workflow for a CGM Performance Study. The protocol combines free-living data with controlled in-clinic sessions involving glucose manipulation and frequent reference measurements.
Quantitative Performance Comparison of Leading CGM Systems
The following data, synthesized from recent head-to-head studies, provides a quantitative comparison of current-generation CGM systems. It is critical to note that results can vary based on the reference method used.
A 2025 study comparing three major systems against a YSI laboratory analyzer reported the following Mean Absolute Relative Difference (MARD) values, where a lower MARD indicates higher accuracy [14] [10]:
- FreeStyle Libre 3 (FL3): 11.6% MARD
- Dexcom G7 (DG7): 12.0% MARD
- Medtronic Simplera (MSP): 11.6% MARD
When assessed against other reference methods, the performance of the systems varied, particularly for Medtronic Simplera, which showed a higher MARD (16.6%) against the Contour Next blood glucose meter [14]. This underscores the importance of the chosen reference method when interpreting performance data.
Table 3: Comprehensive Performance Metrics from a 2025 Head-to-Head Study [14]
| Performance Metric | FreeStyle Libre 3 | Dexcom G7 | Medtronic Simplera |
|---|---|---|---|
| Overall MARD vs. YSI | 11.6% | 12.0% | 11.6% |
| MARD in Hypoglycemia (<70 mg/dL) | Higher (worse) than MSP | Higher (worse) than MSP | Better than FL3 & DG7 |
| MARD in Hyperglycemia (>180 mg/dL) | Better than MSP | Better than MSP | Higher (worse) than FL3 & DG7 |
| First-Day Accuracy (MARD) | Stable from start (~10.9%) | Slightly higher initial MARD (~12.8%) | Least reliable on Day 1 (MARD ~20.0%) |
| Hypoglycemia Detection Rate | 73% | 80% | 93% |
| Hyperglycemia Detection Rate | ~99% | ~99% | 85% |
Analysis of Comparative Performance
The data reveals distinct performance profiles for each system:
- FreeStyle Libre 3 and Dexcom G7 demonstrated consistent and comparable overall accuracy, with a particular strength in the normoglycemic and hyperglycemic ranges and highly reliable detection of high glucose events [14] [10]. Both systems showed good stability from the first day of use.
- Medtronic Simplera exhibited a unique performance trade-off: while its overall MARD was competitive, it demonstrated superior sensitivity in the hypoglycemic range, detecting a higher percentage of true low glucose events [14] [10]. However, this came with a higher rate of false low alerts and less reliable performance during hyperglycemia. Its accuracy was also significantly lower on the first day of wear [10].
Regulatory and Research Considerations
Evolving Regulatory Frameworks
Unlike BGM systems, which are evaluated against the ISO 15197:2013 standard, CGM systems have historically lacked a universally accepted accuracy standard [16] [15]. However, regulatory bodies are adapting. The US Food and Drug Administration (FDA) has introduced special controls for "integrated CGM" (iCGM) systems, which include accuracy requirements such as more than 87% of readings within ±20% of the reference value across various glucose ranges [15]. Furthermore, some CGM systems now carry a nonadjunctive claim, meaning their readings can be used for making insulin dosing decisions without confirmation from a BGM, placing a higher importance on their demonstrated accuracy and reliability [16] [15].
Application in Clinical Trials
The use of CGM in clinical trials for pharmacological agents has been increasing but remains relatively low. An analysis of trials for 40 diabetes drugs with start dates between 2000 and 2019 found that only 5.9% used CGM, though this rose to 12.5% in 2019 [17]. CGM provides granular data on glycemic metrics like Time in Range (TIR), glycemic variability, and nocturnal glycemia, which offer a more comprehensive picture of a therapy's effect than A1c or episodic BGM alone [17]. When designing trials, researchers must account for the physiological fundamentals of ISF measurement, including the inherent lag and the different performance characteristics of available CGM systems.
The evaluation of Continuous Glucose Monitoring (CGM) and Self-Monitoring of Blood Glucose (SMBG) systems is governed by stringent regulatory standards that ensure device safety, reliability, and clinical utility. For researchers and drug development professionals, understanding these benchmarks is essential for designing clinical trials, interpreting glucose data, and developing new diabetes technologies. The primary regulatory frameworks governing this field are established by the International Organization for Standardization (ISO) and the United States Food and Drug Administration (FDA), with the ISO 15197:2013 standard providing specific requirements for in vitro glucose monitoring systems [18].
These regulatory standards have evolved significantly over the past decade, with both ISO and FDA implementing progressively stricter accuracy requirements. The ISO 15197:2013 standard marked a substantial revision from its 2003 predecessor, introducing more rigorous system accuracy criteria and expanded evaluation procedures [19]. Similarly, the FDA has developed its own guidance documents with even more stringent accuracy criteria than those stipulated by ISO 15197:2013 [20]. For researchers comparing sensor performance across different CGM brands and models, these regulatory benchmarks provide the essential foundation for designing methodologically sound comparison studies and interpreting results within a standardized framework.
Analytical Performance Requirements: FDA vs. ISO 15197:2013
Key Accuracy Criteria and Testing Methodologies
Regulatory standards for glucose monitoring systems establish precise analytical performance requirements, with system accuracy representing a central component. The system accuracy evaluation measures the closeness of agreement between a device's measurement results and their respective reference values [19]. The ISO 15197:2013 standard stipulates that at least 95% of measurement results must fall within ±15 mg/dL of the reference value at blood glucose concentrations <100 mg/dL and within ±15% at concentrations ≥100 mg/dL [19]. Additionally, at least 99% of results must fall within zones A and B of the Consensus Error Grid (CEG), which evaluates clinical risk associated with measurement inaccuracies [19].
The FDA's guidance for SMBG systems, published in 2014, establishes even more stringent system accuracy criteria, requiring that 95% of results fall within ±15% across the entire measuring range [19] [20]. This differs notably from the ISO standard, which applies different thresholds based on glucose concentration. Both regulatory approaches require evaluation across multiple test strip lots to account for manufacturing variability, representing a critical consideration for researchers designing sensor comparison studies [19].
Table 1: Comparison of Key Accuracy Requirements in Regulatory Standards
| Requirement | ISO 15197:2003 | ISO 15197:2013 | FDA Guidance (2014) |
|---|---|---|---|
| System Accuracy Threshold | ±15 mg/dL at <75 mg/dL; ±20% at ≥75 mg/dL | ±15 mg/dL at <100 mg/dL; ±15% at ≥100 mg/dL | ±15% across entire range |
| Minimum Percentage | 95% | 95% | 95% |
| Consensus Error Grid Requirement | Not specified | 99% in zones A + B | Not specified in cited documents |
| Test Strip Lots Evaluated | 1 lot (if variability data shown) | 3 lots | 3 lots |
Expanded Evaluation Requirements
Beyond system accuracy, both ISO 15197:2013 and FDA guidelines encompass broader analytical performance evaluations. The ISO standard now includes requirements for assessing influence quantities such as hematocrit levels and interfering substances, which must be investigated across multiple concentration ranges [19]. Measurement precision evaluation encompasses both repeatability (short-term variability) and intermediate precision (variability over at least 10 days) [19]. These expanded requirements reflect growing recognition of the numerous factors that can affect glucose monitoring performance in real-world conditions, providing researchers with a more comprehensive framework for evaluating sensor reliability across diverse physiological conditions and patient populations.
For drug development professionals utilizing CGM data in clinical trials, these regulatory benchmarks offer critical guidance when selecting monitoring systems and interpreting generated data. The more stringent FDA requirements particularly impact studies targeting the U.S. market, where devices must demonstrate consistent performance across the entire measuring range without the concentration-dependent thresholds permitted under ISO standards [20].
Comparative Performance of Current CGM Systems
Accuracy Metrics Across Leading CGM Platforms
Recent comparative studies provide valuable insights into the performance of current-generation CGM systems relative to regulatory benchmarks. A 2025 head-to-head comparison study evaluated three leading CGM sensors: FreeStyle Libre 3 (Abbott), Dexcom G7 (Dexcom), and Medtronic Simplera (Medtronic) [14] [10]. The study employed rigorous methodology, with 24 adult participants with type 1 diabetes wearing all three sensors simultaneously for up to 15 days, allowing direct comparison under identical conditions [14]. Performance was assessed using Mean Absolute Relative Difference (MARD) against multiple reference methods, including YSI 2300 laboratory analyzers, Cobas Integra systems, and Contour Next capillary measurements [14].
When evaluated against the YSI laboratory reference, FreeStyle Libre 3 and Medtronic Simplera both demonstrated MARD values of 11.6%, while Dexcom G7 showed a slightly higher MARD of 12.0% [14] [10]. However, significant performance differences emerged when sensors were compared against capillary blood glucose measurements using the Contour Next system. In this comparison, FreeStyle Libre 3 and Dexcom G7 maintained strong performance with MARD values of 9.7% and 10.1% respectively, while Medtronic Simplera's MARD increased substantially to 16.6% [14] [10]. These findings highlight the importance of reference method selection when evaluating CGM performance and the potential for variability across different use scenarios.
Table 2: CGM System Accuracy Across Different Reference Methods
| CGM System | MARD vs. YSI (Laboratory) | MARD vs. Cobas Integra | MARD vs. Contour Next (Capillary) |
|---|---|---|---|
| FreeStyle Libre 3 | 11.6% | 9.5% | 9.7% |
| Dexcom G7 | 12.0% | 9.9% | 10.1% |
| Medtronic Simplera | 11.6% | 13.9% | 16.6% |
Performance Across Glycemic Ranges
CGM accuracy varies significantly across different glycemic ranges, presenting important considerations for researchers studying specific patient populations or glucose phenomena. The 2025 comparative study revealed that FreeStyle Libre 3 and Dexcom G7 demonstrated better accuracy in normoglycemic and hyperglycemic ranges, making them particularly suitable for studies focusing on postprandial glucose excursions or general glycemic control [10]. In contrast, Medtronic Simplera performed better in the hypoglycemic range, detecting 93% of low glucose events compared to 80% for Dexcom G7 and 73% for FreeStyle Libre 3 [10]. This strength in hypoglycemia detection may be valuable for research involving hypoglycemia-prone populations or interventions targeting hypoglycemia reduction.
First-day performance also varied significantly between systems, with FreeStyle Libre 3 demonstrating the greatest initial stability (MARD ~10.9%), followed by Dexcom G7 (MARD ~12.8%), while Medtronic Simplera showed notably lower reliability on day 1 (MARD ~20.0%) [10]. These temporal performance patterns are essential for researchers designing study protocols, particularly for shorter-term trials where run-in periods may be limited.
Experimental Design for CGM Performance Evaluation
Methodological Framework for Sensor Comparison Studies
Robust experimental design is fundamental to generating clinically meaningful CGM comparison data. The 2025 study by Eichenlaub et al. provides a valuable methodological framework that incorporates recent expert recommendations for CGM performance testing [14]. The study implemented a prospective, interventional design with parallel sensor wear, eliminating inter-individual variability from the accuracy comparison [14]. Participants wore all three evaluated sensor systems simultaneously on the upper arms, with sensor sites equally distributed between arms to control for potential positional effects [14].
The study incorporated three 7-hour frequent sampling periods (on days 2, 5, and 15) during which reference measurements were collected every 15 minutes using multiple methods [14]. This approach allowed comprehensive assessment of sensor performance across different wear durations and physiological conditions. Additionally, the protocol included standardized glucose manipulation procedures to ensure evaluation across clinically relevant glycemic scenarios, including hyperglycemia, hypoglycemia, and rapid glucose fluctuations [14]. This methodological element is particularly important as CGM accuracy can vary significantly during dynamic glucose changes, and regulatory standards are increasingly emphasizing performance assessment under these challenging conditions.
Diagram 1: Experimental workflow for comprehensive CGM performance evaluation, based on contemporary methodological standards.
Essential Research Reagent Solutions
CGM performance studies require specialized equipment and reagents to generate valid, regulatory-grade evidence. The following table details key research solutions and their functions in experimental protocols:
Table 3: Essential Research Reagents and Equipment for CGM Performance Studies
| Item | Function | Example Products |
|---|---|---|
| Laboratory Reference Analyzer | Provides highest-accuracy reference measurements for method comparison | YSI 2300 STAT PLUS [14] |
| Clinical Chemistry Analyzer | Delivers venous plasma glucose measurements using established enzymatic methods | Cobas Integra 400 plus [14] |
| Capillary Blood Glucose Monitor | Enables frequent sampling with minimal participant burden | Contour Next [14] |
| Standardized Glucose Manipulation Protocol | Creates controlled glycemic conditions including hyperglycemia and hypoglycemia | CG-DIVA procedure [14] |
| Data Analysis Software | Calculates performance metrics (MARD, bias, error grid analysis) | Custom statistical packages [14] |
The implementation of a harmonized reference measurement procedure with verified traceability to higher-order standards is particularly important for generating reliable comparison data [19]. The 2025 study utilized duplicate measurements across multiple reference platforms, enhancing methodological rigor and allowing assessment of how reference method selection might impact apparent CGM performance [14].
Implications for Research and Drug Development
Applications in Clinical Trial Design
Understanding regulatory benchmarks and sensor performance characteristics has profound implications for clinical trial design and interpretation. Researchers utilizing CGM data as endpoints must consider how sensor choice might influence study outcomes, particularly when investigating interventions expected to affect specific glycemic ranges. For example, trials of new hypoglycemia-reducing therapies might benefit from sensors with demonstrated strength in low glucose detection, while studies of postprandial glucose management might prioritize sensors with optimal performance in hyperglycemic ranges [10].
The observed differences in sensor performance during early wear periods also inform trial design decisions regarding sensor run-in periods and data inclusion. Studies collecting CGM data immediately after sensor insertion may require appropriate statistical adjustment or exclusion of early timepoints, particularly for systems demonstrating significant initial variability [10]. Furthermore, the consistency of performance across different reference methods underscores the importance of standardized endpoint assessment in multicenter trials, where reference method variability could introduce systematic measurement differences.
Future Directions in Glucose Monitoring Research
Regulatory standards continue to evolve in response to technological advancements and growing understanding of the clinical implications of monitoring accuracy. The FDA's 2025 accuracy standards for SMBG meters are driving manufacturers to achieve tighter performance specifications and improved patient safety, trends that will inevitably influence future CGM regulatory frameworks [21]. Emerging research priorities include standardized assessment of sensor performance during rapid glucose excursions, evaluation of wear duration effects on accuracy, and validation of new metrics for assessing clinical accuracy beyond traditional MARD calculations [14].
For the research community, these evolving standards highlight the importance of methodological transparency and comprehensive performance reporting in studies utilizing glucose monitoring data. As CGM systems increasingly function as decision-support tools in automated insulin delivery systems and as primary endpoints in clinical trials, understanding the regulatory benchmarks governing their performance becomes essential for generating reliable, clinically meaningful evidence [22].
Assessing CGM Performance: Study Designs, Comparator Methods, and Data Analysis
This guide provides an objective comparison of gold-standard comparators used in the evaluation of blood glucose monitoring systems (BGMS), focusing on the YSI analyzer, hexokinase-based laboratory methods, and capillary blood glucose monitors (BGMs). It is designed to support researchers and professionals in drug development and medical device evaluation.
Accurate blood glucose measurement is foundational to diabetes research and management. Regulatory evaluations of BGMS and continuous glucose monitors (CGMs) require comparison against high-order reference methods. The YSI 2300 Stat Plus analyzer (glucose oxidase method) and hexokinase-based laboratory analyzers (e.g., Cobas c501, Abbott Architect, Siemens ADVIA) serve as primary reference standards. These instruments provide the benchmark against which the performance of commercial capillary BGMs is validated. Understanding the technical performance, appropriate application, and limitations of these comparators is critical for designing robust clinical trials and accuracy studies, especially within the context of evolving standards like ISO 15197:2013 and FDA guidance [23] [24].
Key Comparator Systems and Performance Data
The following tables summarize the core methodologies and documented performance metrics for key comparator systems and representative capillary BGMs.
Table 1: Technical Profiles of Gold-Standard Laboratory Comparators
| Comparator Method | Core Enzymatic Principle | Typical Instrumentation | Traceability | Reported Performance in Studies |
|---|---|---|---|---|
| YSI 2300 Stat Plus | Glucose Oxidase | YSI 2300 Stat Plus analyzer | Accepted by regulatory agencies for BGMS calibration [25] | Used as primary reference in multiple BGMS accuracy studies [25] [23] |
| Hexokinase Method | Hexokinase | Cobas 6000 c501, Abbott Architect C16000, Siemens ADVIA 2400 [23] [26] | Directly linked to ID/GC/MS; NIST-standard calibration [24] [26] | Demonstrates high precision; potential for systematic bias versus YSI [23] [24] |
Table 2: Documented Accuracy of Selected Capillary Blood Glucose Monitors (vs. YSI)
| Blood Glucose Monitor (BGM) | Mean Absolute Relative Difference (MARD) | ISO 15197:2003 Compliance (% within ±15 mg/dL or ±20%) | Clarke Error Grid Zone A (%) |
|---|---|---|---|
| FreeStyle Lite | 4.9% | 98.8% | 98.8% |
| FreeStyle Freedom Lite | Data not specified | 97.5% | Data not specified |
| Accu-Chek Aviva | Data not specified | 97.0% | Data not specified |
| Contour | Data not specified | 92.4% | Data not specified |
| OneTouch UltraEasy | 9.7% | 91.1% | 90.4% |
Source: Multicenter study with 453 patients, devices purchased from retail pharmacies [25].
Table 3: Post-Market Performance of Modern BGMS (vs. Hexokinase Reference)
| BGM System (Roche) | ISO 15197:2013 Compliance (% within ±15 mg/dL or ±15%) | Parkes Error Grid Zone A (%) | Stricter 10/10 Criteria Compliance |
|---|---|---|---|
| Accu-Chek Guide | 99.4% - 99.9% | ≥ 99.9% | All models met the stricter criteria [26] |
| Accu-Chek GuideMe | 99.4% - 99.9% | ≥ 99.9% | All models met the stricter criteria [26] |
| Accu-Chek Instant | 99.4% - 99.9% | ≥ 99.9% | All models met the stricter criteria [26] |
| Accu-Chek Instant S | 99.4% - 99.9% | ≥ 99.9% | All models met the stricter criteria [26] |
Source: 18-month post-market study with ~1650 participants in a non-standardized setting [26].
Experimental Protocols for Accuracy Evaluation
Adherence to standardized protocols is essential for generating valid and comparable accuracy data.
Core Study Design and Sample Handling
A critical principle is the comparison of like-with-like samples. Best practice mandates that capillary whole blood tested on a BGM must be compared against the same capillary sample (converted to plasma) tested on the reference instrument [23] [24]. Inappropriate comparisons, such as capillary BGM results versus venous plasma reference results, can introduce significant physiological and analytical bias, leading to inaccurate conclusions about a device's performance [23]. Key protocol elements include:
- Subject Population: Studies should enroll a minimum of 100 subjects with diabetes, providing a spectrum of glucose values. Both type 1 and type 2 diabetes should be represented [25] [26].
- Glucose Concentration Distribution: Samples must cover the entire claimed measuring range of the device, with a specified number of samples in low, normal, and high glycemic ranges as per ISO 15197 guidelines.
- Sample Handling: Capillary blood for the reference method should be collected into tubes with appropriate anticoagulants (e.g., lithium heparin) and stabilized immediately to prevent glycolysis. For venous samples, tubes containing citrate are recommended over fluoride for better glycolysis inhibition [23].
- Test Sequence: For capillary testing, the subject's finger is lanced, and a drop of blood is applied to the BGM test strip. Immediately after, from the same fingerprick, a sample is collected for the reference method [25] [23].
Reference Method Management and Data Analysis
The choice and management of the reference method are paramount.
- Reference Method Selection: The manufacturer's stated reference instrument (often used for BGM calibration) is ideal. If a different method is used, it must conform to traceability requirements (ISO 17511) and be well-validated for precision and accuracy [24].
- Performance Verification: The trueness and precision of the reference analyzer must be verified during the study using certified reference materials, such as NIST-traceable glucose standards, with a minimum of four levels spanning the measurement range [24].
- Data Analysis and Acceptance Criteria: The primary endpoint is typically the percentage of BGM results that fall within ±15 mg/dL of the reference value for concentrations < 100 mg/dL or within ±15% for concentrations ≥ 100 mg/dL (ISO 15197:2013). A minimum of 95% of results must meet these criteria. Data should also be analyzed using consensus error grids (Clarke or Parkes), where 99% of points must fall in zones A and B [25] [26].
The Scientist's Toolkit: Essential Research Reagents and Materials
Table 4: Essential Materials for Blood Glucose Accuracy Studies
| Item | Function/Justification |
|---|---|
| YSI 2300 Stat Plus Analyzer | Gold-standard reference instrument using glucose oxidase method; widely accepted in regulatory submissions [25]. |
| Hexokinase-Based Analyzer | High-precision laboratory instrument (e.g., Cobas c501); provides NIST-traceable results and is common in clinical labs [26]. |
| Lithium Heparin Capillary Tubes | Anticoagulant for collecting capillary blood samples for reference analysis; helps preserve sample integrity [23]. |
| NIST-Traceable Glucose Standards | Certified reference materials for verifying the trueness and calibration of the reference method prior to and during the study [24]. |
| Quality Control Materials | Commercial control sera at multiple levels for daily precision checks of the reference analyzers. |
| Commercial BGMs and Test Strips | Devices and strips from multiple, commercially available lots, purchased through regular distribution channels to reflect real-world performance [25]. |
Methodological Workflow and Logical Relationships
The following diagram illustrates the decision-making workflow for selecting and applying gold-standard comparators in a BGMS accuracy study, integrating key considerations from recent research.
For researchers and professionals in drug development and medical device evaluation, the choice between in-clinic and ambulatory study designs represents a fundamental methodological crossroads with significant implications for data integrity, clinical relevance, and regulatory outcomes. This distinction is particularly critical in the assessment of continuous glucose monitors (CGMs) and other physiological monitoring technologies where measurement context directly influences performance metrics.
In-clinic studies offer controlled environments with standardized protocols and high-precision reference instruments, enabling rigorous validation under optimal conditions. In contrast, ambulatory studies capture device performance in real-world settings, reflecting the actual conditions of use and potentially revealing challenges not apparent in controlled clinics. The growing emphasis on ecological validity in regulatory science has increased the importance of ambulatory designs, yet in-clinic methodologies remain essential for establishing foundational accuracy and safety.
This analysis examines the comparative advantages, limitations, and data yield of these complementary approaches, with specific application to CGM evaluation. We present empirical data from recent head-to-head device comparisons, detailed experimental methodologies, and analytical frameworks to guide study design decisions for research professionals.
Comparative Analysis: Study Design Characteristics
Table 1: Fundamental characteristics of in-clinic versus ambulatory study designs
| Characteristic | In-Clinic Studies | Ambulatory Studies |
|---|---|---|
| Control | High: Environment, activities, and meals standardized | Low: Participants in free-living conditions |
| Reference Method | Direct, frequent venous/YSI sampling with precise timing | Intermittent capillary fingersticks; no direct continuous reference |
| Data Density | High-frequency paired points (e.g., every 15 minutes) during sessions | Sparse paired points (e.g., 4-7 times daily) |
| Glucose Challenges | Induced hyperglycemia and hypoglycemia using standardized protocols | Natural glucose fluctuations from normal life |
| Participant Burden | High: Extended clinic visits with supervised protocols | Low: Normal daily routine with minimal intervention |
| Context Representation | Artificial, optimized conditions | Real-world, ecological conditions |
| Sample Size | Typically smaller due to intensive protocols | Can be larger due to lower participant burden |
| Duration | Short-term (hours to days) | Medium to long-term (weeks to months) |
CGM Performance Across Study Designs: Quantitative Evidence
Recent comprehensive research reveals how study design influences measured CGM performance metrics. A 2025 head-to-head comparison of three leading CGM systems illustrates these methodological dependencies.
Table 2: CGM accuracy (MARD%) by study design and reference method [10] [14]
| CGM System | In-Clinic Setting (YSI Reference) | In-Clinic Setting (Contour Next Reference) | Ambulatory Setting (Fingerstick Reference) |
|---|---|---|---|
| FreeStyle Libre 3 | 11.6% | 9.7% | Varies significantly with testing frequency |
| Dexcom G7 | 12.0% | 10.1% | Varies significantly with testing frequency |
| Medtronic Simplera | 11.6% | 16.6% | Varies significantly with testing frequency |
This data demonstrates a critical methodological consideration: the choice of reference method significantly impacts reported accuracy. The same sensors showed different MARD values when compared against laboratory-grade YSI analyzers versus capillary blood glucose meters, with variation patterns differing by device. This highlights the importance of specifying reference methodology when interpreting performance data across studies.
Beyond overall accuracy, both designs yield complementary insights into device performance characteristics:
- In-clinic advantages: Superior assessment of dynamic glycemic challenges, early sensor stabilization, and hypoglycemia detection capability [10] [14]
- Ambulatory advantages: Evaluation of real-world adhesion performance, day-to-day reliability, and user behavior interactions [7] [27]
Experimental Protocols for CGM Evaluation
Standardized In-Clinic Testing Protocol
A rigorous methodology for in-clinic CGM assessment incorporates controlled glucose challenges across clinically relevant ranges [10] [14]:
Participant Preparation: After sensor insertion according to manufacturer specifications, participants undergo an equilibration period before data collection.
Frequent Paired Measurements: During 7-hour in-clinic sessions, reference measurements are collected every 15 minutes using laboratory instruments (YSI 2300 STAT PLUS, Cobas Integra 400 plus) and capillary systems (Contour Next).
Structured Glucose Excursions: A standardized protocol induces:
- Postprandial hyperglycemia via carbohydrate-rich meal with delayed insulin bolus
- Controlled descent into hypoglycemia through calculated insulin administration
- Subsequent recovery to normoglycemia using fast-acting carbohydrates
- Mild exercise to assess interference with physical activity
Temporal Sampling: Testing typically occurs on days 2, 5, and 15 of sensor wear to assess performance across the sensor lifecycle.
This protocol generates approximately 28 paired data points per session across glycemic ranges, enabling robust statistical analysis of accuracy, precision, and lag time.
Ambulatory Study Methodology
Ambulatory protocols emphasize ecological validity while maintaining sufficient data collection [14]:
Free-Living Conditions: Participants maintain normal daily routines without dietary or activity restrictions.
Scheduled Self-Monitoring: Participants perform capillary blood glucose measurements at minimum before and 2 hours after meals, and at bedtime (typically 7+ measurements daily).
Naturalistic Observation: Sensors are worn for full product lifetimes (7-14 days) with documentation of real-world challenges including exercise, bathing, and environmental exposures.
Subjective Experience Assessment: Participants complete standardized questionnaires on usability, comfort, and interference with daily activities.
The Researcher's Toolkit: Essential Reagents and Instruments
Table 3: Essential research materials for comprehensive CGM evaluation
| Research Tool | Function | Application Context |
|---|---|---|
| YSI 2300 STAT PLUS Analyzer | Laboratory-grade glucose reference using glucose oxidase method | In-clinic gold standard for venous glucose measurement |
| Cobas Integra 400 Plus Analyzer | Alternative laboratory reference using hexokinase method | In-clinic comparison for method verification |
| Contour Next BGMS | Capillary blood glucose monitoring system | Bridge between clinic and ambulatory settings; home reference |
| Standardized Sensor Applicators | Consistent sensor insertion across participants | Both study designs to minimize insertion variability |
| Data Logging Software | Time-synchronized collection from multiple devices | Both study designs for precise paired analysis |
| Adhesive Assessment Tools | Documentation of skin irritation and adhesion failure | Primarily ambulatory studies for real-world wearability |
| Participant Diaries | Capture of meals, activities, and symptomology | Primarily ambulatory studies for contextual analysis |
The methodological tension between in-clinic and ambulatory study designs represents not a choice between superior and inferior approaches, but rather a strategic opportunity to leverage complementary strengths. In-clinic protocols provide the necessary control to establish fundamental accuracy and detect systematic biases under challenging glycemic conditions, while ambulatory methodologies reveal how devices perform amid the complexities of real-world use.
For comprehensive sensor evaluation, a sequential approach is recommended: initial in-clinic validation to establish foundational performance, followed by ambulatory assessment to verify ecological validity. This dual-method framework provides regulatory bodies with both controlled performance data and real-world evidence, while giving clinicians and researchers complete understanding of device capabilities and limitations across the spectrum of use environments.
As CGM technology evolves toward non-adjunctive use and automated insulin delivery, the interplay between these methodological approaches will grow increasingly important in generating the robust evidence base required for therapeutic decision-making and regulatory approval.
Glycemic challenge protocols are controlled procedures used to induce temporary states of hyperglycemia (high blood glucose) or hypoglycemia (low blood glucose) in study participants. For researchers evaluating Continuous Glucose Monitoring (CGM) systems, these protocols are fundamental for assessing sensor performance across the entire physiologic glucose range under controlled conditions. Accurate characterization of CGM performance during rapid glucose transitions and at extreme values is particularly crucial for diabetes technology development and therapeutic drug monitoring, as these conditions represent critical failure points in daily diabetes management [28] [10].
This article details standardized methodologies for glycemic challenge testing and applies them to compare the performance of leading CGM systems, providing researchers with a framework for objective sensor evaluation. The findings are contextualized within the broader thesis that modern CGM data analysis, often called "CGM Data Analysis 2.0," leverages advanced statistical and artificial intelligence methods to extract more nuanced insights from dense time-series data, moving beyond traditional summary statistics [28].
Experimental Protocols for Glycemic Challenge Testing
Well-designed glycemic challenge tests aim to simulate real-world glucose fluctuations in a controlled setting. The following protocol, adapted from a 2025 head-to-head CGM comparison study, provides a robust methodology for inducing glycemia for sensor testing [10].
Core Protocol Design
- Participant Profile: The study should enroll individuals with diabetes (e.g., type 1 diabetes) who can experience natural glycemic excursions. A sample size of 20-30 participants provides sufficient data for initial analysis.
- Sensor Deployment: Participants simultaneously wear all CGM systems under investigation on the same body region (typically the upper arm) to eliminate inter-subject and site-specific variability.
- Testing Sessions: Conduct multiple in-clinic sessions (e.g., on days 2, 5, and 15 of sensor wear). Each session lasts approximately 7 hours to capture a full glycemic challenge cycle.
- Reference Glucose Measurement: Blood glucose is measured frequently (e.g., every 15 minutes) using a laboratory-grade reference instrument such as a YSI analyzer or a high-accuracy fingerstick meter (e.g., Contour Next). This establishes the "ground truth" for comparison.
Glycemic Challenge Induction Methodology
The following workflow diagram illustrates the sequential phases of a glycemic challenge protocol designed to test CGM sensor accuracy across different glucose ranges and dynamic conditions.
Key Data Collection and Analysis Metrics
The primary metric for assessing CGM accuracy during such challenges is the Mean Absolute Relative Difference (MARD), which calculates the average percentage error between the CGM reading and the reference value [10] [7]. Additional analyses include:
- Agreement Rate (AR): The percentage of CGM readings within ±20% or ±20 mg/dL of the reference value [10].
- Error Grid Analysis (EGA): Assesses the clinical accuracy of glucose readings and the potential for erroneous treatment decisions [10].
- Glucose-Specific MARD: Calculating MARD separately for hyperglycemic, normoglycemic, and hypoglycemic ranges to identify performance disparities [10].
- Day-1 Accuracy: Analyzing MARD specifically for the first 12-24 hours of sensor wear to assess initial warm-up performance [10].
CGM Performance Under Glycemic Challenge
Applying the above protocols yields critical, comparative data on how different CGM systems perform under stress. The following table summarizes the overall accuracy characteristics of three leading CGM systems based on a recent head-to-head study [10].
Table 1: Overall CGM System Accuracy Profiles (Based on YSI Reference)
| CGM System | Overall MARD (%) | Hypoglycemia Detection Strength | Hyperglycemia Detection Strength | First-Day Accuracy (MARD, %) |
|---|---|---|---|---|
| Dexcom G7 | 12.0 | Moderate (80% detection rate) | Excellent (~99% detection rate) | 12.8 |
| FreeStyle Libre 3 | 11.6 | Lower (73% detection rate) | Excellent (~99% detection rate) | 10.9 |
| Medtronic Simplera | 11.6 | Excellent (93% detection rate) | Lower (85% detection rate) | 20.0 |
Performance Across Glucose Ranges
A sensor's overall MARD can mask significant variations in its performance at different ends of the glycemic spectrum. Glycemic challenge testing effectively reveals these disparities:
- Normal & High Glucose Ranges: Dexcom G7 and FreeStyle Libre 3 demonstrate superior accuracy, closely tracking post-meal glucose spikes. This makes them highly reliable for monitoring postprandial hyperglycemia [10].
- Hypoglycemic Range: Medtronic Simplera excels, detecting 93% of hypoglycemic events and tracking true low values more closely. However, this high sensitivity comes with a higher rate of false alarms [10].
- Periods of Rapid Change: During fast glucose rises (e.g., after a meal), Dexcom G7 and Libre 3 maintain steady performance. Simplera struggles with rapid rises but performs adequately during rapid glucose drops [10].
Initial Sensor Stabilization Performance
The "warm-up" period after sensor insertion is a known vulnerability. Challenge protocols reveal stark differences:
- FreeStyle Libre 3 is the most stable from the start, with a first-day MARD of ~10.9% [10].
- Dexcom G7 shows slightly higher initial MARD (~12.8%) but stabilizes quickly [10].
- Medtronic Simplera is least reliable on day one (MARD ~20.0%), indicating its readings in the first 12 hours should be interpreted with caution. Its accuracy improves significantly after this initial period [10].
The Researcher's Toolkit for CGM Evaluation
Beyond the core protocol, effective CGM research requires a suite of data handling techniques and analytical tools to manage the dense time-series data generated by these devices.
Handling the Inevitability of Missing Data
Missing CGM data is a common challenge due to sensor signal loss or removal. Research shows that the accuracy of CGM-derived metrics degrades as the proportion of missing data increases, with at least 80% data completeness required for high-fidelity representation (R² > 0.95) of true glycemic metrics [29].
Table 2: Research Reagents & Computational Tools for CGM Data Analysis
| Tool Category | Specific Example | Function in CGM Research |
|---|---|---|
| Reference Analyzer | YSI Blood Analyzer | Provides laboratory-grade glucose measurements for CGM accuracy calculation (MARD). |
| High-Accuracy BGM | Contour Next Meter | Serves as a secondary reference method for blood glucose measurement. |
| Data Imputation Method | Temporal Alignment Imputation (TAI) | A strategy for handling missing CGM data; found to outperform other methods in certain scenarios [29]. |
| Advanced Analysis Package | Functional Data Analysis (FDA) | Treats CGM data as dynamic curves rather than discrete points, providing deeper insight into temporal patterns than traditional statistics [28]. |
| Open-Source Analysis Tool | Quantification of CGM (QoCGM) in MATLAB | Calculates a comprehensive suite of glycemic metrics (TIR, MAGE, CONGA, etc.) from raw CGM data [29]. |
Advanced Analytical Frameworks (CGM Data Analysis 2.0)
Moving beyond basic metrics like MARD, the field is evolving toward "CGM Data Analysis 2.0," which uses more sophisticated frameworks to interpret complex data [28]:
- Functional Data Analysis (FDA): Leverages the full time-series structure of CGM data, treating it as dynamic curves. This allows for the identification of subtle phenotypes and patterns (e.g., differences between weekday and weekend glycemia) that traditional statistics miss [28].
- Artificial Intelligence/Machine Learning (AI/ML): These methods can predict future glycemic trends, classify metabolic subphenotypes, and are foundational for developing automated insulin delivery (AID) systems. AI can integrate CGM data with other parameters (e.g., food intake, activity) for contextualized, personalized decision support [28].
Glycemic challenge protocols provide the necessary rigor to objectively evaluate and compare CGM system performance under clinically relevant conditions. The experimental data generated reveals that each major CGM system has a distinct performance profile: FreeStyle Libre 3 and Dexcom G7 offer strong overall and hyperglycemic accuracy, while Medtronic Simplera shows a particular strength in hypoglycemia detection, albeit with trade-offs in other areas.
For researchers, the implications are clear. The choice of CGM for a clinical trial or study should be aligned with the primary glycemic endpoints—whether the focus is on overall glucose control, postprandial hyperglycemia, or hypoglycemia prevention. Furthermore, embracing advanced data analysis frameworks like Functional Data Analysis and AI is crucial for extracting the full clinical value from CGM data, ultimately accelerating the development of more intelligent and personalized diabetes management solutions.
For researchers and drug development professionals, the accuracy of Continuous Glucose Monitoring (CGM) systems during dynamic glucose changes represents a critical performance parameter with direct implications for therapeutic development and clinical validation. As diabetes technology evolves toward automated insulin delivery systems and standardized glycemic metrics, understanding comparative device performance across physiologically relevant glucose regions becomes essential for study design and technology selection [14] [30]. The challenge in comparing CGM systems lies in varying study designs and a historical lack of head-to-head comparisons, highlighting the need for standardized testing methodologies that replicate clinically significant glycemic scenarios [14].
This analysis examines the performance of three current-generation factory-calibrated CGM systems—FreeStyle Libre 3 (FL3), Dexcom G7 (DG7), and Medtronic Simplera (MSP)—during rapid glucose fluctuations, with particular focus on their accuracy across hypoglycemic, normoglycemic, and hyperglycemic ranges. By synthesizing data from recent parallel-comparison studies and detailing experimental protocols, this guide provides a framework for objective sensor evaluation in research contexts.
Experimental Protocols for Dynamic Accuracy Assessment
Standardized Glucose Excursion Methodology
Recent comparative studies have employed sophisticated protocols designed to systematically evaluate CGM performance across dynamic glucose regions (DGR). One prominent methodology involves inducing controlled glucose excursions through a multi-phase approach [14]:
- Carbohydrate Loading with Delayed Insulin: Participants consume a carbohydrate-rich breakfast followed by a deliberately delayed insulin bolus to induce initial hyperglycemia
- Hypoglycemia Induction: Administration of insulin accompanied by rapid glucose declines
- Stabilization Phase: Recovery to stable normoglycemic levels through controlled carbohydrate administration and mild exercise
This protocol generates comparator data distribution across high, low, rapidly rising, and falling blood glucose levels, creating clinically relevant scenarios where CGM accuracy is particularly crucial for safety and effectiveness [14].
Comparative Study Design Elements
Rigorous CGM comparison studies incorporate several key design elements to ensure meaningful results:
- Parallel Sensor Wear: Participants wear multiple CGM systems simultaneously to eliminate inter-subject variability [14]
- Frequent Sampling Periods (FSPs): Extended in-clinic sessions with comparator measurements every 15 minutes using multiple reference methods [14]
- Multiple Reference Standards: Utilization of YSI 2300 STAT PLUS (glucose oxidase-based), COBAS INTEGRA 400 plus (hexokinase-based), and capillary Contour Next measurements provides methodologically diverse comparator data [14]
- Free-Living Phase Assessment: Supplemental real-world data collection with standardized self-monitoring of blood glucose (SMBG) protocols [31]
This comprehensive approach allows researchers to evaluate CGM performance across both controlled clinical environments and typical daily living conditions, providing a complete accuracy profile.
Quantitative Performance Comparison
Table 1: Overall MARD (%) by Reference Method for Three CGM Systems
| CGM System | YSI 2300 Reference | Cobas Integra Reference | Contour Next Reference |
|---|---|---|---|
| FreeStyle Libre 3 | 11.6% | 9.5% | 9.7% |
| Dexcom G7 | 12.0% | 9.9% | 10.1% |
| Medtronic Simplera | 11.6% | 13.9% | 16.6% |
Data sourced from a 2025 parallel-comparison study of 24 adults with type 1 diabetes wearing all three systems simultaneously for up to 15 days, with sensors replaced according to manufacturer specifications [14]. The variation in MARD values across reference methods highlights the importance of comparator selection in study design and the need for standardized assessment protocols.
Range-Specific Performance
Table 2: Accuracy Across Glycemic Ranges
| CGM System | Hypoglycemic Performance | Normoglycemic Performance | Hyperglycemic Performance |
|---|---|---|---|
| FreeStyle Libre 3 | Lower accuracy vs. hypoglycemia | Better accuracy | Better accuracy |
| Dexcom G7 | Lower accuracy vs. hypoglycemia | Better accuracy | Better accuracy |
| Medtronic Simplera | Better performance in hypoglycemic range | Lower accuracy | Lower accuracy |
The study revealed distinctive range-dependent performance patterns, with FL3 and DG7 demonstrating superior accuracy in normoglycemic and hyperglycemic ranges, while MSP showed comparatively better performance in the hypoglycemic range [14]. This specialization may inform device selection for specific research applications or patient populations.
Evolution of CGM Accuracy
Historical data reveals significant improvement in CGM technology over successive generations. Earlier comparative studies found substantial accuracy differences between systems, with one 2019 parallel wear study reporting MARD values of 9.5% for Dexcom G5 compared to 13.6% for the original FreeStyle Libre when measured against YSI reference [31]. The FreeStyle Libre 2 system demonstrated improved accuracy (MARD 9.2% in adults, 9.7% in pediatrics) compared to its predecessor (MARD 12.0%) [30]. This evolutionary trajectory underscores the rapid advancement in sensor technology and algorithm development.
Analysis of Clinical and Research Implications
Impact of Comparator Methodology
The choice of reference method significantly influences reported CGM accuracy metrics. The 2025 parallel-comparison study demonstrated that MARD values for the same CGM system varied substantially depending on whether YSI, Cobas Integra, or Contour Next served as the reference [14]. This methodological dependency emphasizes the need for consistent comparator selection across studies and careful interpretation of accuracy claims based on single-reference methodologies.
Performance in Dynamic Conditions
The temporal accuracy of CGM systems—particularly during rapid glucose changes—represents a critical performance dimension for research applications. All systems demonstrated reduced accuracy during periods of rapid glucose fluctuation compared to stable conditions [14]. The physiological time lag between blood and interstitial glucose measurements (typically 6-18 minutes) contributes to this phenomenon, comprising approximately 6 minutes of physiological lag and up to 12 minutes from signal processing filters [32]. Understanding these inherent limitations is essential when designing studies involving dynamic glucose challenges.
Manufacturing and Regulatory Considerations
Recent regulatory developments highlight the impact of manufacturing processes on CGM accuracy. In March 2025, the FDA issued a warning letter to Dexcom citing failures in establishing adequate procedures for monitoring and controlling process parameters for validated processes [33]. The letter specifically noted concerns about manufacturing controls for glucose sensitivity slope and mean absolute relative distance (MARD), with the agency expressing concern that "only specifying the upper limit of MARD could result in all commercial sensors being released with borderline acceptable MARD" [33]. These manufacturing control issues potentially affect the consistency of sensor performance across production lots, an important consideration for longitudinal research studies.
Experimental Workflow and Research Tools
Dynamic Glucose Testing Methodology
The following diagram illustrates the standardized experimental workflow for assessing CGM accuracy during dynamic glucose fluctuations:
Dynamic Glucose Testing Workflow
This standardized protocol ensures systematic assessment across clinically relevant glycemic scenarios and enables direct comparison between CGM systems.
Essential Research Reagent Solutions
Table 3: Key Research Materials for CGM Accuracy Studies
| Research Tool | Function/Application | Key Characteristics |
|---|---|---|
| YSI 2300 STAT PLUS | Laboratory reference standard | Glucose oxidase-based method, traceable to ISO 17511 |
| COBAS INTEGRA 400 plus | Alternative laboratory reference | Hexokinase-based method, provides methodological comparison |
| Contour Next BGMS | Capillary reference standard | Glucose hydrogenase-based, represents typical clinical practice |
| Heated Hand Device | Blood arterialization | ~40°C application for venous sample arterialization |
| CG-DIVA Software | Data analysis platform | Continuous Glucose Deviation Interval and Variability Analysis |
| Consensus Error Grid | Clinical accuracy assessment | Standardized methodology for treatment decision accuracy |
These research tools represent essential components for comprehensive CGM accuracy assessment, particularly during dynamic glucose fluctuations. The use of multiple reference methods strengthens study validity by mitigating methodological biases inherent in any single approach [14].
The comparative analysis of CGM performance during dynamic glucose fluctuations reveals distinct accuracy profiles across systems and glycemic ranges. FreeStyle Libre 3 and Dexcom G7 demonstrate generally superior overall accuracy, particularly in normoglycemic and hyperglycemic conditions, while Medtronic Simplera shows enhanced performance in the hypoglycemic range. These differential performance characteristics highlight the importance of matching system capabilities to specific research requirements.
The significant variation in accuracy metrics based on comparator method underscores the need for standardized testing protocols and multiple reference methodologies in CGM evaluation. Furthermore, recent regulatory actions emphasize the impact of manufacturing controls on sensor consistency, suggesting that declared accuracy metrics may not fully represent real-world performance across production lots.
For researchers designing clinical trials or developing glucose-responsive therapies, these findings support the careful selection of CGM systems based on specific study requirements, with particular attention to expected glycemic ranges and the need for detection of rapid glucose fluctuations. As CGM technology continues to evolve, ongoing independent comparative studies will remain essential for characterizing system performance under dynamic physiological conditions.
Optimizing CGM Data Integrity: Sensor Variability, Drift, and Real-World Reliability
Continuous Glucose Monitoring (CGM) systems have fundamentally transformed diabetes management, providing real-time, dynamic glucose data that is crucial for both clinical care and research. For scientists and drug development professionals, the accuracy of this data is not merely a convenience but a critical determinant in the validity of therapeutic outcomes and clinical trial results. The "20/20 Rule" for clinical validation serves as a key benchmark for assessing this accuracy. This rule, which requires that a high percentage of CGM readings fall within ±20% of the reference blood glucose value (or ±20 mg/dL for values below 100 mg/dL), provides a standardized framework for evaluating sensor performance in clinical settings [10]. The Mean Absolute Relative Difference (MARD) is the cornerstone metric for quantifying CGM accuracy, with a lower MARD indicating superior performance [10] [34]. However, as a recent scoping review highlights, the comparability of CGM performance studies is often limited by significant variability in study designs, subject populations, and testing procedures [35]. This article provides a rigorous, data-driven comparison of contemporary CGM systems, detailing experimental methodologies essential for the robust clinical validation of sensor accuracy.
Quantitative Accuracy Comparison of Leading CGM Systems
Direct, head-to-head comparisons are essential for a true understanding of relative CGM performance. A 2025 study by Eichenlaub et al. offers a robust evaluation of three leading systems under controlled conditions.
The following table summarizes the key accuracy metrics from the Eichenlaub et al. study, which involved 24 adults with type 1 diabetes who wore all three sensors simultaneously, with glucose levels measured against lab-grade devices [10].
Table 1: Overall Accuracy Metrics (MARD) from Head-to-Head Study
| CGM System | MARD vs. Lab Reference (YSI) | MARD vs. Contour Next Meter | Agreement Rate (AR) ±20%/20 mg/dL |
|---|---|---|---|
| Dexcom G7 | 12.0% | ~9.7–10.1% | Data Not Reported |
| FreeStyle Libre 3 | 11.6% | ~9.7–10.1% | Data Not Reported |
| Medtronic Simplera | 11.6% | 16.6% | Data Not Reported |
MARD, Mean Absolute Relative Difference. A lower MARD indicates higher accuracy [10].
The data reveals that while all systems showed comparable performance against the laboratory standard, Medtronic Simplera exhibited greater variability when compared to a standard fingerstick meter, a scenario more representative of everyday use [10]. It is important to note that manufacturers cite different MARD values in their documentation; for instance, Dexcom claims a MARD of 8.2% for the G7, while Abbott cites 8.9% for the FreeStyle Libre 3 [36]. These discrepancies underscore the influence of study design and data analysis methodologies on reported outcomes [35].
Performance Across Glucose Ranges and Time
Sensor performance is not uniform across all glucose levels or throughout the sensor's wear period. The Eichenlaub study provided detailed insights into these critical aspects.
Table 2: Performance Across Glucose Ranges and Initial Wear Period
| CGM System | Low Glucose Performance | High Glucose Performance | First-Day Accuracy (MARD) |
|---|---|---|---|
| Dexcom G7 | Reliable | Best | ~12.8% |
| FreeStyle Libre 3 | Reliable | Best | ~10.9% (Most stable) |
| Medtronic Simplera | Excellent (Best at detecting lows) | Less reliable | ~20.0% (Least reliable) |
The trade-off in performance profiles is evident. Medtronic Simplera detected 93% of low glucose events, outperforming Dexcom G7 (80%) and FreeStyle Libre 3 (73%), making it a strong candidate for studies where hypoglycemia is a primary endpoint [10]. Conversely, all systems, particularly the Simplera, demonstrated higher inaccuracy on the first day, a phenomenon that must be accounted for in trial protocols involving short-term sensor use [10] [37].
Experimental Protocols for CGM Clinical Validation
Robust validation hinges on standardized, transparent methodologies. The following workflow and details synthesize recommendations from recent literature and key studies.
Diagram 1: Workflow for a CGM Clinical Validation Study. T1D: Type 1 Diabetes. Based on Eichenlaub et al. (2025) [10] and the scoping review by Schmelzeisen-Redeker et al. (2023) [35].
Detailed Methodology of a Representative Study
The 2025 study by Eichenlaub et al. serves as a model for a comprehensive head-to-head comparison [10].
- Subject Population: The study enrolled 24 adults with type 1 diabetes. A well-characterized population is essential for assessing performance in the intended use population [10] [35].
- Sensor Deployment and Testing Procedures: Each participant wore all three CGM sensors (Dexcom G7, FreeStyle Libre 3, Medtronic Simplera) simultaneously on their upper arms. To account for different approved wear durations, sensors were replaced according to their manufacturers' instructions: Dexcom G7 on day 5, Simplera on day 8, and FreeStyle Libre 3 for the full duration [10].
- Reference Method and Data Collection: Participants underwent three 7-hour in-clinic sessions on days 2, 5, and 15. During these sessions, controlled glucose fluctuations were induced via meals, insulin, and exercise. Reference glucose levels were measured every 15 minutes using a lab-grade YSI analyzer and a standard fingerstick meter (Contour Next) [10]. This dual-reference approach allows for assessment against both a gold standard and a device used in real-world management.
The Scientist's Toolkit: Key Reagents and Materials
Table 3: Essential Materials for CGM Clinical Validation Studies
| Item | Function in Validation | Example from Literature |
|---|---|---|
| CGM Systems | Devices under test; compared against reference. | Dexcom G7, FreeStyle Libre 3, Medtronic Simplera [10]. |
| Laboratory Analyzer | High-precision reference method (gold standard). | YSI Stat 2300 Analyzer [10]. |
| Blood Glucose Meter | Secondary reference; assesses real-world correlation. | Contour Next meter [10]. |
| Data Analysis Software | For calculating accuracy metrics (MARD, AR). | Custom or commercial statistical packages (e.g., R, Python) [35]. |
| Controlled Environment | In-clinic sessions to standardize conditions (diet, exercise, insulin). | 7-hour in-clinic sessions with standardized meals [10]. |
Critical Analysis and Research Implications
The Clinical Impact of MARD
The pursuit of lower MARD values is not merely academic. In silico research has demonstrated a clear link between sensor error and clinical outcomes. This research identified a critical threshold at MARD = 10%, beyond which the frequency of both hypoglycemic (BG ≤50 mg/dL) and hyperglycemic (BG ≥250 mg/dL) events increases significantly [34]. This finding provides a quantitative basis for setting accuracy standards for non-adjunctive use (making treatment decisions without fingerstick confirmation) and underscores the importance of selecting sensors with a MARD consistently below this threshold for clinical trials [34].
Researchers must account for several factors that can compromise data integrity:
- First-Day Inaccuracy: As shown in Table 2, sensor accuracy is lowest immediately after insertion [10]. A technique known as "sensor soaking"—inserting a new sensor several hours before the previous one ends without starting its warm-up—can significantly improve day-one accuracy [37].
- Calibration Errors: For sensors requiring calibration, inaccurate fingerstick meter readings directly propagate to worse CGM accuracy. Protocols must mandate strict handwashing before reference measurements to avoid contamination [37].
- Physiological Lag: CGMs measure glucose in the interstitial fluid, which lags behind blood glucose by approximately 5-6 minutes. This lag is most pronounced during periods of rapid glucose change [34].
- Interfering Substances: Acetaminophen (paracetamol) is a known interferent that can cause falsely high readings in some CGM systems [37].
For the research community, the choice of a CGM system involves a careful analysis of performance characteristics against study endpoints. The quantitative data presented herein indicates that while FreeStyle Libre 3 and Dexcom G7 offer the most consistent overall accuracy, Medtronic Simplera may be preferable for studies focused specifically on hypoglycemia detection, despite its higher overall variability and first-day inaccuracy [10]. Adherence to rigorous experimental protocols, such as those detailed in the Eichenlaub study and the POCT05 guideline, is paramount for generating reliable, comparable data [10] [35]. As CGM technology continues to evolve, integrating with artificial intelligence for advanced analytics [38], its role in clinical research will only expand. A foundational and critical understanding of sensor validation principles, encapsulated by the 20/20 rule and comprehensive MARD analysis, remains essential for ensuring the scientific rigor of diabetes research and therapeutic development.
Continuous Glucose Monitoring (CGM) systems are critical tools in diabetes management and metabolic research. However, their accuracy is not static and is influenced by two primary temporal factors: start-up dynamics, where performance is unstable immediately after sensor insertion, and sensitivity drift, where a sensor's accuracy gradually changes over its operational lifespan. This guide objectively compares the performance of current-generation CGM systems from Abbott (FreeStyle Libre 3), Dexcom (G7), and Medtronic (Simplera) based on recent experimental data, providing researchers with a framework for evaluating sensor performance in clinical and development settings.
Quantitative Performance Comparison
The following tables consolidate key performance metrics from recent clinical studies, enabling direct comparison of sensor behavior during initial wear and across the sensor lifetime.
Table 1: Overall Sensor Accuracy (MARD) Against Different Comparator Methods [14]
| CGM System | MARD vs. YSI (Venous) | MARD vs. Cobas Integra (Venous) | MARD vs. Contour Next (Capillary) |
|---|---|---|---|
| FreeStyle Libre 3 | 11.6% | 9.5% | 9.7% |
| Dexcom G7 | 12.0% | 9.9% | 10.1% |
| Medtronic Simplera | 11.6% | 13.9% | 16.6% |
Table 2: Start-Up Dynamics and Time-Worn Analysis [14] [39]
| CGM System | MARD (First 12 Hours) | MARD (12-24 Hours) | MARD (After 24 Hours) | Sensor Lifetime |
|---|---|---|---|---|
| Dexcom G6 Pro* | 13.6% | 10.5% | 10.1% | 10 days |
| FreeStyle Libre 3 | Data not stratified by time in study | - | - | 14 days |
| Medtronic Simplera | Data not stratified by time in study | - | - | 7 days |
*Data for G6 Pro shown as illustrative example of start-up dynamics pattern; G7 expected to follow similar trend.
Table 3: Performance Across Glycemic Ranges [14]
| CGM System | Hypoglycemic Range Performance | Normo-/Hyperglycemic Range Performance |
|---|---|---|
| FreeStyle Libre 3 | - | Better accuracy |
| Dexcom G7 | - | Better accuracy |
| Medtronic Simplera | Better accuracy | - |
Experimental Protocols for Performance Assessment
Understanding the methodologies behind performance data is crucial for proper interpretation and study design replication.
Study Design: Prospective, interventional study with 24 adult participants with type 1 diabetes wearing all three CGM systems in parallel for up to 15 days.
Key Methodological Elements:
- Sensor Management: FL3 sensors worn for full 14-day lifetime; DG7 sensors exchanged on day 5; MSP sensors exchanged on day 8
- Comparator Measurements: Three 7-hour frequent sampling sessions (days 2, 5, 15) with measurements every 15 minutes using:
- YSI 2300 (venous, glucose oxidase-based)
- Cobas Integra 400 plus (venous, hexokinase-based)
- Contour Next (capillary, glucose dehydrogenase-based)
- Glucose Excursion Protocol: Induced transient hyperglycemia and hypoglycemia following published testing procedures
- Data Pairing: CGM readings paired with closest comparator measurement (±5 minutes maximum difference)
Study Design: Observational substudy within the Insulin-Only Bionic Pancreas Trial evaluating blinded Dexcom G6 Pro sensors.
Key Methodological Elements:
- Participant Instructions: Perform blood glucose measurements every 2 hours during waking hours and at least once overnight
- Data Collection: 1073 CGM-BGM pairs across 53 participants over median 50 hours
- Analysis Stratification: Results categorized by sensor wear period (<12, 12-24, ≥24 hours), glucose rate of change, and glucose range
Experimental Workflow and Signaling Pathways
The following diagram illustrates the standard experimental workflow for assessing sensor performance over time, as implemented in the cited studies.
Diagram 1: Experimental Workflow for CGM Performance Assessment illustrates the standardized testing protocol with alternating free-living and in-clinic phases.
The Scientist's Toolkit: Research Reagent Solutions
Table 4: Essential Materials and Methods for CGM Performance Research
| Research Tool | Function & Application | Key Characteristics |
|---|---|---|
| YSI 2300 STAT PLUS | Laboratory reference standard for venous glucose measurement | Glucose oxidase-based method; considered gold standard |
| Cobas Integra 400 Plus | Alternative laboratory analyzer for venous glucose | Hexokinase-based method; highlights method-dependent variability |
| Contour Next BGM | Capillary blood glucose reference system | Glucose dehydrogenase-based; represents real-world comparator |
| CG-DIVA Analysis | Comprehensive CGM performance assessment tool | Evaluates glucose deviation intervals and variability |
| Diabetes Technology Society Error Grid | Clinical accuracy assessment | Newly introduced standard for evaluating clinical impact of errors |
| Adaptive Unscented Kalman Filter | Signal processing for fault detection | Detects sensor drift and compression artifacts; requires dual sensors |
Technical Insights into Drift Mechanisms and Compensation
Sensor drift manifests through multiple mechanisms that researchers must account for in study design and data interpretation.
Drift Characterization and Modeling
Advanced modeling approaches separate sensor error into distinct components for more accurate characterization. Autoregressive modeling methods can separately characterize drift and random noise in CGM systems, enabling better protocol design based on expected sensor behavior [40]. These models accurately represent cohort sensor behavior across patients, with demonstrated ability to match clinical trend indices (simulated: 11.4° vs clinical: 10.9°) while maintaining point accuracy (simulated MARD: 9.6% vs clinical: 9.9%) [40].
Signal Processing and Fault Detection
Innovative signal processing techniques enhance sensor reliability by identifying and compensating for common artifacts. Research demonstrates that redundant CGM systems with adaptive Unscented Kalman Filters can detect sensor drifts with 80.9% sensitivity and 92.6% specificity, while identifying pressure-induced sensor attenuation (PISA) with 78.1% sensitivity and 82.7% specificity [41]. These methods can reduce deviation of CGM measurements from reference values from 72.0% to 12.5% during drift events [41].
Implications for Research and Development
The observed performance variations underscore several critical considerations for research applications:
Comparator Method Selection: Significant differences in MARD based on reference method (YSI vs. Cobas Integra vs. capillary) highlight the importance of standardized comparator selection in study design [14].
Sensor-Specific Performance Profiles: Each system exhibits distinct strengths—Medtronic Simplera shows advantages in hypoglycemic detection, while FreeStyle Libre 3 and Dexcom G7 demonstrate superior overall accuracy [14].
Temporal Performance Patterns: The characteristic improvement in accuracy after the first 12-24 hours necessitates careful consideration of data inclusion criteria in study protocols [39].
These findings emphasize the need for comprehensive guidelines for CGM performance testing, particularly regarding comparator data characteristics and study procedures, as ongoing standardization efforts by organizations like the IFCC Working Group on CGM aim to address [42].
Continuous Glucose Monitoring (CGM) systems represent transformative technology in metabolic health management, enabling real-time tracking of interstitial glucose levels. For researchers and clinical professionals, understanding the factors that compromise sensor accuracy is paramount for both device development and clinical application. Signal disturbances—whether from mechanical, pharmacological, or physiological sources—present significant challenges to data reliability and subsequent therapeutic decisions.
The fundamental operation of most CGM systems relies on electrochemical sensing technology. Sensors typically use the enzyme glucose oxidase to catalyze the oxidation of glucose, producing hydrogen peroxide (H₂O₂) as a byproduct. This compound is then electrochemically detected at a working electrode, generating a signal proportional to glucose concentration [43]. This biochemical pathway, while generally robust, creates specific vulnerability points where interfering substances can alter signal output without changing actual glucose levels, thereby compromising measurement accuracy essential for drug development research and clinical care.
Comparative Analysis of CGM Interference Profiles
Different CGM systems exhibit varying susceptibility to common interferents based on their specific sensor design, electrode materials, and algorithms. The table below summarizes key interference profiles for major FDA-approved CGM devices, providing researchers with a comparative overview of documented vulnerabilities.
Table 1: Comparative Interference Profiles of Contemporary CGM Systems
| Device Name | Acetaminophen Interference | Other Medication Interferences | Sensor Life (Days) | Warm-up Time |
|---|---|---|---|---|
| Dexcom G7 | >1g/6hr in adults [44] [45] | Hydroxyurea [44] [45] | 10 + 12-hour grace period [44] | 30 minutes [44] |
| Dexcom G6 | >1g/6hr in adults [44] [45] | Hydroxyurea [44] [45] | 10 [44] | 2 hours [44] |
| Abbott FreeStyle Libre 3 | >500mg Vitamin C daily [44] | Salicylic acid (Libre 14 day) [44] | 14 [7] [44] | 1 hour [44] |
| Medtronic Guardian 4 | Yes (acetaminophen/paracetamol) [44] [43] | Not specified | 7 [7] [44] | 2 hours [44] |
| Eversense 365 | Information not specified in sources | Tetracycline-class medications [44] | 365 [7] [44] | 24 hours [44] |
Key Observations from Comparative Data
The comparative analysis reveals several critical patterns for research consideration. Dexcom systems (G6/G7) maintain consistent interference profiles for acetaminophen and hydroxyurea across generations, though the G7 offers significant improvements in warm-up time [44]. Abbott FreeStyle Libre systems demonstrate a different vulnerability profile, with noted interference from high-dose vitamin C rather than acetaminophen [44]. The Eversense 365 system presents a unique long-term implantable model with distinct pharmacological considerations, including tetracycline-class antibiotics [44].
These differences highlight the importance of device-specific validation when designing clinical trials or interpreting CGM data in research settings, particularly for studies involving medications with known interference potential.
Pharmacological Interference: The Acetaminophen Case Study
Mechanistic Insights
Acetaminophen (paracetamol) interference represents one of the most thoroughly documented pharmacological challenges in CGM technology. The interference mechanism is electrochemical rather than biochemical. At the sensing electrode, where hydrogen peroxide is oxidized to produce a measurable current, acetaminophen's phenolic moiety is also readily oxidized under the same applied voltage [43]. This parallel oxidation reaction generates additional current that the sensor misinterpretes as originating from glucose-derived hydrogen peroxide, resulting in falsely elevated glucose readings [46] [43].
Diagram: Acetaminophen Interference Mechanism in CGM Electrochemistry
Experimental Evidence and Dosing Considerations
The magnitude of acetaminophen interference is dose-dependent and varies by administration route. A 2015 outpatient study with the Dexcom G4 system demonstrated that 1,000 mg acetaminophen ingestion produced significant CGM elevation for up to 8 hours, with the maximum mean difference of 61 mg/dL (upper 95% CI: 77 mg/dL) occurring at 120 minutes post-ingestion [46]. Notably, individual variation was substantial, with 50% of relative differences within 20% and an additional 26% within 40% over the 8-hour observation period [46].
Recent evidence highlights that intravenous administration produces more pronounced effects than oral dosing. A 2025 case report documented that IV acetaminophen (15 mg/kg) in a pediatric patient using a Medtronic Guardian 4 sensor caused rapid CGM increases, peaking at 29.2 ± 1.9 minutes after administration, with estimated discrepancies ranging from 55 to 114 mg/dL compared to capillary measurements [43]. This enhanced effect is likely attributable to higher peak plasma concentrations achieved via intravenous administration.
Table 2: Quantitative Effects of Acetaminophen on CGM Accuracy
| Administration Route | Dosage | CGM System | Peak Discrepancy | Time to Peak | Duration |
|---|---|---|---|---|---|
| Oral [46] | 1,000 mg | Dexcom G4 | 61 mg/dL (mean) | 120 minutes | 8 hours |
| Intravenous [43] | 15 mg/kg | Medtronic Guardian 4 | 55-114 mg/dL (estimated) | 29.2 ± 1.9 minutes | >2 hours |
| Oral [45] | ≤1g/6hr | Dexcom G7 | Minimal (per manufacturer) | Not specified | Not specified |
Clinically Significant Interactions
The interference pattern demonstrates inverse relationship with blood glucose levels, with greater discrepancies observed at lower glucose concentrations [43]. This relationship is particularly concerning for patients using automated insulin delivery (AID) systems, as falsely elevated CGM readings could potentially trigger inappropriate autocorrection boluses, increasing hypoglycemia risk [43]. Research protocols must account for this glucose-level dependent effect when designing studies involving acetaminophen administration.
Compression Artifacts and Mechanical Signal Disturbances
Phenomenology and Clinical Implications
"Compression lows" represent a non-pharmacological interference phenomenon where physical pressure on the sensor artificially depresses glucose readings. While not extensively detailed in the provided search results, this artifact occurs when external pressure on the sensor site temporarily reduces interstitial fluid flow, effectively starving the sensor of glucose and generating falsely low readings.
The clinical significance of compression artifacts is particularly pronounced in nocturnal glucose monitoring, where patients may apply pressure to sensors during sleep, potentially triggering false hypoglycemia alerts and unnecessary therapeutic interventions. For researchers analyzing CGM trend data, recognizing the characteristic sharp "V-shaped" dip and rapid recovery of compression artifacts is essential for accurate data interpretation and exclusion criteria development.
Methodological Framework for Interference Research
Experimental Design Considerations
Rigorous investigation of CGM interference requires standardized methodologies capable of isolating specific effects. The experimental workflow below outlines a comprehensive approach to quantifying pharmacological interference, incorporating elements from cited studies [46] [43].
Diagram: Experimental Workflow for Assessing CGM Pharmacological Interference
The Researcher's Toolkit: Essential Materials and Methods
Table 3: Essential Research Reagents and Equipment for CGM Interference Studies
| Item Category | Specific Examples | Research Function | Considerations |
|---|---|---|---|
| CGM Systems | Dexcom G7, Abbott Libre 3, Medtronic Guardian 4 [7] [44] | Test articles for interference assessment | Include multiple generations/brands for comparative studies |
| Reference Glucose Method | Bayer CONTOUR NEXT, ACCU-CHEK Guide Link [46] [43] | Establish "true" glucose values for discrepancy calculation | Laboratory glucose analyzers preferred for highest accuracy |
| Potential Interferents | Acetaminophen (oral/IV), hydroxyurea, vitamin C [44] [45] [43] | Challenge substances for interference testing | Pharmaceutical grade; standardized dosing protocols |
| Data Extraction Tools | WebPlotDigitizer [43] | Extract numerical data from graphical representations | Essential for meta-analysis of published studies |
| Statistical Software | R software [43] | Mixed models for repeated measures, correlation analysis | Enables sophisticated longitudinal data analysis |
Analytical Approaches for Interference Quantification
Robust statistical analysis is crucial for characterizing interference phenomena. The cited studies employed linear mixed models to account for repeated measures within subjects [46] and linear regression to evaluate relationships between blood glucose levels and magnitude of interference [43]. Key metrics for reporting include:
- Mean Absolute Relative Difference (MARD): Standard metric for CGM accuracy assessment [7]
- Peak discrepancy magnitude and timing: Essential for understanding interference kinetics
- Duration of significant effect: Informs clinical monitoring requirements
- Glucose-level dependency: Correlation between actual BG and interference magnitude
For compression artifact research, signal morphology analysis combining rapid decrease and recovery patterns with participant position data provides the most reliable identification method.
Implications for Research and Clinical Practice
Understanding CGM signal disturbances carries significant implications for multiple research domains. For device developers, identifying specific vulnerability patterns informs next-generation sensor design, such as improved membrane selectivity or algorithmic correction methods. For clinical researchers, awareness of interference patterns is essential for proper study design, including appropriate exclusion of compromised data points and timing of concomitant medications. For regulatory scientists, establishing standardized interference testing protocols ensures consistent evaluation across device platforms.
Future research directions should prioritize standardized testing methodologies across CGM systems, investigation of algorithmic correction approaches for common interferents, and exploration of novel sensing technologies with inherent resistance to common interfering substances. Additionally, more comprehensive assessment of interferent combinations and their potential synergistic effects on CGM accuracy would address an important evidence gap.
Signal disturbances from pharmacological, mechanical, and unknown sources present continuing challenges to CGM accuracy and reliability. The comparative analysis presented here demonstrates that interference profiles vary significantly between devices, necessitating device-specific awareness for proper research implementation and clinical application. Acetaminophen represents the most thoroughly studied interferent, with effects that are dose-dependent, route-dependent, and inversely related to glucose levels—a particularly concerning combination for patients using automated insulin delivery systems.
Methodological rigor in interference research requires careful experimental design, appropriate reference methods, and sophisticated statistical approaches capable of handling repeated measures data. As CGM technology continues to evolve toward increasingly closed-loop systems and non-adjunctive usage, understanding and mitigating signal disturbances becomes increasingly critical for both patient safety and research integrity.
The evolution of Continuous Glucose Monitoring (CGM) systems has centered significantly on a fundamental methodological question: how should sensors be calibrated to transform raw electrical signals into accurate glucose values? This question has bifurcated the field into two distinct technological pathways—factory-calibration and user-calibration workflows. For researchers and drug development professionals, understanding this dichotomy is crucial not only for selecting appropriate monitoring tools for clinical trials but also for interpreting the resulting data with appropriate scientific rigor.
Factory-calibrated systems arrive pre-calibrated from the manufacturing process, utilizing algorithms developed from extensive batch testing to convert sensor signals to glucose values without requiring routine user input [47]. These systems, including the Abbott Freestyle Libre and Dexcom G6/G7 platforms, are designed to eliminate the burden of fingerstick calibrations while maintaining accuracy over their wear period [47] [48]. User-calibrated systems, in contrast, depend on periodic fingerstick blood glucose measurements entered by the user to adjust and maintain sensor accuracy over time [49]. This traditional approach allows for individualization but introduces potential variables related to user technique and meter accuracy.
The calibration methodology extends beyond mere convenience into the realm of data integrity, particularly as CGM systems are increasingly employed as digital health technologies (DHT) in clinical trials [50]. The transformation from raw sensor data (epoch-level) to regulatory endpoints such as Time in Range involves multiple derivation steps where calibration approaches can significantly influence results and potentially introduce bias if not properly accounted for in trial design [50].
Technical Foundations of Calibration Approaches
The Biochemical Basis of CGM Measurement
All subcutaneous CGM systems utilize a glucose-oxidase enzyme reaction to measure glucose concentration in interstitial fluid, subsequently estimating corresponding blood glucose levels [47]. The measured electrical current generated by this reaction is proportional to interstitial glucose concentrations, but this relationship fluctuates due to manufacturing variability, sensor drift, and individual biocompatibility factors [47]. Calibration, whether performed at the factory or by the user, establishes and maintains the mathematical relationship between this electrical current and clinically relevant glucose values.
Algorithmic Foundations of Factory Calibration
Factory-calibrated systems replace user-inputted reference values with sophisticated algorithms that incorporate time-varying functions for sensor offset and gain. These algorithms account for predictable sensor drift over the entire wear period using population-based parameters hardcoded during manufacturing [47]. The Dexcom G6 system exemplifies this approach with a calibration function that corrects for sensor drift over the 10-day wear period by tracking time since insertion and adjusting the conversion algorithm based on established patterns of an "average" sensor [47]. This represents a significant evolution from earlier linear functions that required frequent adjustment to maintain accuracy.
Methodological Framework of User Calibration
User-calibrated systems typically employ calibration algorithms that begin with average parameters for key variables (sensor gain, offset, time-since-insertion factors) derived from population data [47]. These parameters are then periodically adjusted using reference values from self-monitoring of blood glucose (SMBG) measurements. The calibration algorithm minimizes differences between sensor glucose values and the last SMBG measurements, effectively "re-anchoring" the sensor to the individual's blood glucose profile [47]. This process, while allowing for individualization, introduces dependencies on user technique and meter accuracy that can propagate through the data stream.
Table: Fundamental Characteristics of Calibration Approaches
| Characteristic | Factory Calibration | User Calibration |
|---|---|---|
| Reference Values | Pre-established during manufacturing | User-provided via fingerstick meters |
| Algorithm Adjustment | Fixed, time-based drift correction | Dynamic, based on user entries |
| User Burden | Minimal after sensor insertion | Ongoing throughout sensor wear |
| Individualization | Population-based parameters | Adjusted to individual physiology |
| Potential Error Sources | Manufacturing variability, algorithmic assumptions | Meter inaccuracy, user technique, timing errors |
Quantitative Performance Comparison
Clinical validation studies provide critical metrics for evaluating the relative performance of factory-calibrated and user-calibrated systems. The Mean Absolute Relative Difference (MARD) serves as the primary benchmark for accuracy, representing the average absolute percentage difference between paired CGM and reference measurements, with lower values indicating superior accuracy.
Table: Comparative Accuracy Metrics from Clinical Studies
| CGM System | Calibration Type | MARD (%) | 20/20 Agreement Rate (%) | Study Details |
|---|---|---|---|---|
| Dexcom G6 | Factory | 9.0–10.0 | Not reported | Pivotal trial, 262 patients with T1D/T2D [47] |
| Abbott Freestyle Libre | Factory | 11.4 | 85–89 (CEG Zone A) | Adult pivotal trial, 72 patients [47] |
| CareSens Air (updated algorithm) | Factory (optional) | 8.7 | 93.9 | 2025 study, 30 adults with diabetes [49] |
| CareSens Air (manual algorithm) | User | 9.9 | 90.1 | Same cohort as above for direct comparison [49] |
| Dexcom G7 | Factory | 8.2 (adults) | Not reported | Manufacturer-reported data [7] |
| Freestyle Libre 3 | Factory | 8.9 | 91.4 | 2025 study, 55 adults [7] |
| Eversense 365 | User (initial) | 8.8 | Not reported | Manufacturer-reported data [7] |
Recent comparative evidence demonstrates that factory-calibrated systems can achieve accuracy metrics comparable to or exceeding user-calibrated approaches. A 2025 study of the CareSens Air system directly compared manual calibration with an updated factory-calibration algorithm in the same cohort, revealing a statistically significant improvement in MARD from 9.9% to 8.7% with the factory-calibrated approach [49]. Similarly, the 20/20 agreement rate (percentage of CGM values within ±20 mg/dL or ±20% of reference values) improved from 90.1% to 93.9% with factory calibration [49].
Clinical accuracy, as assessed by Diabetes Technology Society Error Grid (DTSEG) analysis, further supports the validity of factory-calibrated systems. The CareSens Air study demonstrated 92.4% of data pairs in the clinically accurate Zone A with factory calibration compared to 88.0% with manual calibration [49]. This metric is particularly significant for researchers, as it reflects the potential for clinical decision-making without introducing dangerous misinterpretations.
Experimental Protocols for CGM Validation
Standardized Clinical Validation Methodology
Robust evaluation of CGM system performance follows standardized protocols designed to assess accuracy across clinically relevant glucose ranges and throughout the sensor wear period. The frequently cited methodologies from pivotal trials share common elements that researchers should consider when designing studies or evaluating manufacturer claims.
The Frequent Sample Testing (FST) protocol employed in Dexcom G6 pivotal trials exemplifies this approach [47]. Studies enrolled 262 patients with type 1 and type 2 diabetes across 11 clinical sites, with sensors worn for up to 10 days. Participants underwent frequent sample testing on designated days (day 1, 4, 5, 7, or 10), with reference measurements compared to concurrent CGM values. This design enables assessment of accuracy stability throughout the sensor lifetime and captures potential early-wear anomalies [47].
The glucose clamping procedure used in CareSens Air evaluation represents another key methodological approach [49]. During in-clinic sessions, participants underwent glucose manipulation through controlled food intake and insulin administration, maintaining levels either <70 mg/dL or >300 mg/dL for approximately 60 minutes. This deliberate manipulation provides critical accuracy data at glycemic extremes where clinical risk is highest but naturally occurring events may be infrequent in study populations.
Comparator Measurement Standards
The choice of reference method fundamentally influences reported accuracy metrics. Clinical trials typically employ one of two approaches:
Laboratory Reference Instruments: Systems like the Yellow Springs Instruments (YSI) Glucose Analyzer provide high-precision venous glucose measurements serving as the reference standard in pivotal trials [47]. This approach minimizes reference method variability but requires clinical site visits and venous sampling.
Capillary Blood Glucose Monitoring: Approved blood glucose meters (e.g., Contour Next system) provide practical alternatives for reference measurements, particularly in outpatient settings [49]. This approach enables more frequent sampling but introduces additional variability from the meters themselves, typically requiring duplicate measurements with tight agreement criteria (±10% or ±10 mg/dL) before averaging [49].
Table: Essential Research Reagents and Materials for CGM Validation
| Item | Specification | Research Function |
|---|---|---|
| Reference Glucose Analyzer | YSI 2300 STAT Plus | Provides laboratory-standard venous glucose measurements for accuracy assessment [47] |
| Capillary Blood Glucose System | Contour Next | Enables frequent reference measurements during in-clinic sessions; requires validation against laboratory standards [49] |
| Standardized Sensor Insertion | Manufacturer-specific applicators | Ensures consistent sensor deployment across study participants and sites |
| Data Collection Platform | Compatible smart devices or dedicated receivers | Captures real-time CGM values at specified intervals (typically 1-5 minutes) |
| Temperature Monitoring System | Continuous skin temperature loggers | Controls for potential thermodynamic effects on sensor performance |
| Statistical Analysis Software | R, Python, or SAS with specialized packages | Performs MARD, regression, error grid, and time-series analyses |
Statistical Considerations for Research Applications
The integration of CGM systems as digital health technologies in clinical trials introduces complex statistical challenges that researchers must address in study design and analysis plans [50]. The high-volume data output—up to 288 measurements daily per participant—creates both opportunities and analytical challenges for evaluating treatment effects.
Data quality and traceability concerns emerge from the multilayered structure of CGM data, which undergoes multiple derivation steps from epoch-level readings (collected every 1-5 minutes) to summary-level endpoints like Time in Range [50]. Each transformation layer introduces potential error sources that can propagate through analysis, particularly if data irregularities (duplicate timestamps, daylight saving adjustments, device malfunctions) occur differentially between treatment arms.
Missing data management represents another critical consideration, as missingness can occur at various levels from individual readings to entire days without data [50]. The extent, pattern, and reason for missing data should be carefully documented, with statistical analysis plans pre-specifying imputation methods and conducting sensitivity analyses to assess robustness under different missing data assumptions [50].
The estimand framework provides a valuable foundation for addressing missing data in CGM-derived endpoints, requiring researchers to precisely define the treatment effect of interest and how intercurrent events (including missing data) are handled [50]. This approach strengthens the statistical integrity of trials using CGM endpoints and supports regulatory decision-making.
The calibration debate extends beyond technical specifications to fundamental research considerations. Factory-calibrated systems offer practical advantages for large-scale trials through reduced participant burden and simplified protocols, potentially enhancing compliance and data completeness. The demonstrated accuracy of these systems, with MARD values consistently below 10% in recent studies [47] [49], supports their use as reliable measurement tools in clinical research.
However, the choice between calibration approaches should align with specific research objectives. User-calibrated systems may remain preferable in populations with unusual glucose dynamics or physiological states where population-based algorithms may prove less accurate. Additionally, researchers should consider that not all factory-calibrated systems permit optional calibration—a potential limitation when algorithmic drift is suspected [51].
For drug development professionals, the trajectory of CGM technology points toward increasingly accurate factory-calibrated systems that minimize user-dependent variables while maintaining rigorous accuracy standards. This evolution supports more standardized endpoint collection across multicenter trials while reducing potential bias introduced by variations in user calibration practices. As CGM-derived endpoints gain prominence in regulatory decisions, continued attention to statistical rigor in handling CGM data remains paramount, regardless of calibration methodology [50].
Head-to-Head CGM Accuracy Validation: 2025 Comparative Data and Analysis
Continuous Glucose Monitoring (CGM) systems have revolutionized diabetes management by providing real-time interstitial glucose readings, thereby reducing reliance on capillary blood glucose measurements. For researchers and clinicians, sensor accuracy is paramount, as it directly influences the reliability of glycemic data used for therapy adjustments and clinical studies. The Mean Absolute Relative Difference (MARD) is the primary metric for evaluating CGM accuracy, representing the average percentage difference between sensor readings and reference glucose values. A lower MARD indicates higher accuracy.
This guide provides a head-to-head, data-driven comparison of three leading CGM systems: the Dexcom G7, FreeStyle Libre 3, and Medtronic Simplera. We focus on a recent, rigorous head-to-head study and supplementary data to deliver an objective analysis of their performance for a scientific audience.
Experimental Protocol: A Rigorous Head-to-Head Design
A seminal 2025 study by Eichenlaub et al., published in the Journal of Diabetes Science and Technology, provides a robust comparative accuracy assessment [10] [14]. The methodology was designed to test performance across dynamic glucose ranges and against different reference standards.
Study Population and Design
- Participants: 24 adults with type 1 diabetes [14].
- Design: Prospective, interventional study. Each participant wore all three CGM sensors simultaneously on the upper arms for approximately 15 days [10] [14].
- Sensor Management: To account for different approved wear durations, sensors were managed as follows:
Testing Procedures and Reference Methods
The study included three 7-hour in-clinic frequent sampling periods (FSPs) on days 2, 5, and 15. During these sessions, a standardized glucose manipulation procedure was employed to induce controlled periods of hyperglycemia, hypoglycemia, and rapid glucose changes, providing a comprehensive assessment of sensor performance under clinically challenging conditions [14].
Reference blood glucose (BG) levels were measured every 15 minutes using three different methods to evaluate the impact of the comparator:
- YSI 2300 STAT PLUS: A laboratory-grade glucose oxidase analyzer (venous plasma), considered the gold standard [14].
- COBAS INTEGRA 400 plus: A hospital-grade hexokinase analyzer (venous plasma) [14].
- Contour Next (CNX): A handheld capillary blood glucose meter (capillary whole blood) [14].
Data and Accuracy Analysis
CGM readings were paired with the closest reference measurement (within ±5 minutes). Accuracy was evaluated using:
- Primary Metric: Mean Absolute Relative Difference (MARD).
- Supplementary Metrics: Agreement Rate (AR) and Error Grid Analysis (EGA). The EGA, specifically the Diabetes Technology Society Error Grid, assesses the clinical risk of inaccurate readings, where Zone A represents no effect on clinical action and Zone B indicates a low risk of clinical error [14].
Results: Quantitative Accuracy Comparison
The results demonstrate that overall accuracy varies significantly depending on the reference method used for comparison.
Table 1: Overall MARD (%) of FL3, DG7, and MSP Against Different Reference Methods [10] [14]
| CGM System | vs. YSI (Gold Standard) | vs. Cobas Integra (Venous) | vs. Contour Next (Capillary) |
|---|---|---|---|
| FreeStyle Libre 3 | 11.6% | 9.5% | 9.7% |
| Dexcom G7 | 12.0% | 9.9% | 10.1% |
| Medtronic Simplera | 11.6% | 13.9% | 16.6% |
Against the YSI gold standard, all three sensors showed comparable and clinically acceptable MARD values, with FL3 and MSP at 11.6% and DG7 at 12.0% [10] [14]. However, performance diverged against other references. FL3 and DG7 demonstrated consistent accuracy across all comparator methods. In contrast, MSP's MARD increased substantially against the Cobas Integra (13.9%) and the capillary Contour Next meter (16.6%), indicating greater variability and less consistent performance in more common clinical or home-use scenarios [14].
Performance Across Glycemic Ranges
Sensor performance was not uniform across different glucose levels, revealing distinct strengths and weaknesses for each system.
Table 2: Stratified Performance by Glucose Range and Situation [10] [14]
| Performance Characteristic | FreeStyle Libre 3 | Dexcom G7 | Medtronic Simplera |
|---|---|---|---|
| Normo- & Hyperglycemia | Best performance | Best performance | Good performance |
| Hypoglycemia | Good performance | Good performance | Best performance |
| Rapid Glucose Drops | Good performance | Good performance | Best performance |
| Rapid Glucose Rises | Steady performance | Steady performance | Struggled |
| First-Day Accuracy | Most stable (MARD ~10.9%) | Slightly higher initial MARD (~12.8%) | Least reliable (MARD ~20.0%) |
| Hypoglycemia Detection Rate | 73% | 80% | 93% |
Both FL3 and DG7 showed superior accuracy in the normal and high glucose ranges, making them reliable for tracking post-meal glucose spikes [10]. Conversely, MSP excelled in the low glucose range, more closely tracking true hypoglycemic values and achieving the highest detection rate for low glucose events (93%) [10] [14]. A significant finding was the first-day accuracy. MSP was notably less reliable in the first 12 hours (MARD ~20.0%), while FL3 was the most stable from the start [10].
Clinical Accuracy and Alert Reliability
Error Grid Analysis (EGA) for all three systems showed almost all paired readings (>99%) fell within the clinically acceptable Zones A and B when compared to YSI reference, indicating a low risk of clinically misleading readings [10] [14].
For alert reliability:
- High Glucose Alerts: DG7 and FL3 caught approximately 99% of high glucose events, outperforming MSP (85%), which sometimes missed actual highs [10].
- Low Glucose Alerts: While MSP had the highest true detection rate (93%), it also came with a higher rate of false alarms compared to DG7 (80%) and FL3 (73%) [10].
Diagram 1: CGM performance varies significantly across different glycemic ranges and challenging situations, with each sensor exhibiting distinct strengths.
The Researcher's Toolkit: Key Reagents and Equipment
Table 3: Essential Materials for CGM Performance Studies [14]
| Item | Function / Rationale | Example from Eichenlaub et al. (2025) |
|---|---|---|
| Reference Analyzers | Provide criterion-standard glucose measurements for MARD calculation. | YSI 2300 STAT PLUS (lab), Cobas Integra 400 plus (hospital) |
| Capillary BG Meter | Represents typical point-of-care or home-use comparator. | Contour Next |
| Glucose Manipulation Protocol | Standardized procedure to stress-test sensors across dynamic ranges. | Carbohydrate meal + delayed insulin to induce hyper-/hypoglycemia [14] |
| Data Pairing Software | Aligns CGM and reference values with a defined time tolerance for analysis. | Custom scripts to pair readings within ±5 minutes [14] |
| Error Grid Analysis Tool | Evaluates clinical (not just statistical) significance of CGM errors. | Diabetes Technology Society Error Grid [14] |
Discussion & Future Directions
Interpretation of Findings and Research Implications
The data indicates that while all three CGMs meet regulatory standards for accuracy, the choice for clinical research may depend on the study's primary endpoint. For investigations focused on postprandial hyperglycemia or overall Time in Range, FreeStyle Libre 3 and Dexcom G7 are the most consistent performers. For studies where hypoglycemia detection and prediction are the primary outcomes, Medtronic Simplera presents a compelling profile, despite its overall higher variability [10] [14].
A critical consideration for researchers is the calibration bias of different CGM systems. As noted in the search results, not all CGMs report glucose in the same physiological space. Dexcom G7 and FreeStyle Libre 3 are calibrated close to capillary glucose levels, which is representative of the glucose exposure that drives microvascular complications. In contrast, Medtronic Simplera has been reported to align more closely with venous glucose, which can lead to an underestimation of peak glucose exposures and may necessitate different Time in Range target interpretations in research settings [52].
The Evolving Landscape: Dexcom G7 15-Day
It is important to note that CGM technology is rapidly evolving. In April 2025, Dexcom received FDA clearance for the Dexcom G7 15-Day system, which boasts a significantly lower overall MARD of 8.0% and an extended wear duration of 15 days [8]. This new iteration, expected to launch in the second half of 2025, has the potential to further shift the competitive landscape, offering enhanced accuracy and convenience.
This direct comparison, based on a robust head-to-head study, reveals a nuanced accuracy profile for the three leading CGM systems:
- FreeStyle Libre 3 demonstrates excellent, consistent accuracy across multiple reference methods and superior first-day stability.
- Dexcom G7 shows performance nearly identical to FL3, with strong consistency and reliability, and a new 15-day version with higher accuracy is on the horizon.
- Medtronic Simplera excels specifically in hypoglycemia detection but shows greater overall variability and weaker first-day performance.
For the research community, this MARD showdown underscores that there is no single "best" sensor for all scenarios. The optimal choice is contingent upon the specific clinical or research question being asked, emphasizing the need for careful sensor selection based on the particular performance characteristics that align with the study's goals.
Continuous Glucose Monitoring (CGM) systems have revolutionized diabetes management by providing real-time insights into glucose levels, enabling both individuals and healthcare providers to make more informed decisions [53]. For researchers and drug development professionals, the accuracy of these systems across different glycemic ranges is not merely a technical specification but a critical factor that can influence clinical trial outcomes and the safety assessment of new therapies.
The performance of CGM systems can vary significantly across the glycemic spectrum [14]. Accuracy in the hypoglycemic range is crucial for patient safety and for evaluating interventions aimed at reducing hypoglycemic events. Performance during normoglycemia directly impacts the reliability of "time-in-range" data, a key efficacy endpoint in modern clinical trials. Similarly, accuracy in the hyperglycemic range is essential for assessing glycemic control and the effect of antihyperglycemic drugs [53] [14].
This guide objectively compares the glucose-range specific performance of current-generation CGM systems using published experimental data, detailing the methodologies employed to generate this critical performance data.
Comparative Performance Data Across Glycemic Ranges
The accuracy of CGM systems is most commonly quantified using the Mean Absolute Relative Difference (MARD), which represents the average percentage difference between the sensor reading and a reference value [54] [14]. A lower MARD indicates higher accuracy.
The table below summarizes the key accuracy metrics for three leading CGM systems from recent clinical studies.
Table 1: Glucose-Range Specific Accuracy (MARD%) of Contemporary CGM Systems
| CGM System | Overall MARD (%) | Hypoglycemia MARD (%) | Normoglycemia MARD (%) | Hyperglycemia MARD (%) | Source/Comparator |
|---|---|---|---|---|---|
| FreeStyle Libre 3 (FL3) | 8.9 [54] | Better performance vs. DG7 in normo- and hyperglycemia [14] | Better performance vs. DG7 in normo- and hyperglycemia [14] | Better performance vs. DG7 in normo- and hyperglycemia [14] | YSI [54] |
| 9.5-11.6 [14] | YSI/INT [14] | ||||
| Dexcom G7 (DG7) | 13.6 [54] | Better performance vs. FL3 in hypoglycemia [14] | Better performance vs. MSP in normo- and hyperglycemia [14] | Better performance vs. MSP in normo- and hyperglycemia [14] | YSI [54] |
| 9.9-12.0 [14] | YSI/INT [14] | ||||
| Medtronic Simplera (MSP) | 11.6-16.6 [14] | Performed better in hypoglycemic range [14] | Lower accuracy vs. FL3 & DG7 [14] | Lower accuracy vs. FL3 & DG7 [14] | YSI/INT/CNX [14] |
Key Findings from Comparative Data:
- FreeStyle Libre 3 vs. Dexcom G7: A direct head-to-head study found FL3 had a significantly lower overall MARD (8.9%) compared to DG7 (13.6%), with FL3 demonstrating superior accuracy in all metrics throughout the study period [54]. A three-way comparison later suggested that while FL3 and DG7 tend to be more accurate overall, DG7 may show better relative performance in the hypoglycemic range compared to FL3 [14].
- Three-System Comparison: A comprehensive evaluation of FL3, DG7, and Medtronic Simplera (MSP) found that performance results varied depending on the comparator method used (YSI, INT, or CNX) [14]. Across comparators, FL3 and DG7 tended to be more accurate than MSP. The study highlighted that FL3 and DG7 showed better accuracy in the normoglycemic and hyperglycemic ranges, while MSP performed better in the hypoglycemic range [14].
- Performance Consistency: It is important to note that all CGM systems in the three-way comparison showed lower accuracy (higher MARD) compared to some of their previously reported studies, emphasizing the impact of study design—including glycemic challenges—on performance outcomes [14].
Detailed Experimental Protocols
The reliability of performance data is intrinsically linked to the rigor of the experimental methodology. Below are the protocols from key studies cited in this comparison.
Head-to-Head Comparison of Libre 3 and G7
Reference: Hanson et al. J Diabetes Sci Technol. 2024 [54]
Objective: To assess the point accuracy of the Dexcom G7 and FreeStyle Libre 3 sensors in a head-to-head comparison.
Methodology:
- Design: Multicenter, single-arm, prospective, nonsignificant risk evaluation.
- Participants: 55 adults with diagnosed type 1 or type 2 diabetes.
- Procedure: Participants wore both CGM systems simultaneously. Accuracy was assessed by comparing sensor glucose values to frequent laboratory reference measurements (Yellow Springs Instrument, YSI) and capillary blood glucose values.
- Outcome Measures: The primary metric was the Mean Absolute Relative Difference (MARD). The number and percentage of matched glucose pairs within ±20 mg/dL (±20%) of reference values were also calculated across glucose ranges (<54, 54–69, 70–180, 181–250, >250 mg/dL) [54].
Three-Way CGM System Evaluation with Glycemic Challenges
Reference: J Diabetes Sci Technol. 2025 (Online ahead of print) [14]
Objective: To evaluate the performance of FreeStyle Libre 3, Dexcom G7, and Medtronic Simplera against different comparator methods during clinically relevant glycemic scenarios.
Methodology:
- Design: Prospective, interventional study.
- Participants: 24 adult participants with type 1 diabetes mellitus.
- Procedure: Each participant wore one sensor of each of the three CGM systems in parallel for up to 15 days. The study included three 7-hour frequent sampling periods (FSPs) where venous blood glucose was measured every 15 minutes using two laboratory analyzers (YSI 2300 and Cobas Integra) and one capillary glucose meter (Contour Next). During these FSPs, a standardized glucose manipulation procedure was employed:
- Participants consumed a carbohydrate-rich breakfast followed by a delayed insulin bolus to induce initial hyperglycemia.
- Interventions were then used to induce hypoglycemia accompanied by rapid glucose changes.
- Finally, stability in the normoglycemic range was achieved [14].
- Data Analysis: MARD, relative bias, and agreement rates (within ±20 mg/dL/±20%) were calculated. The recently introduced Diabetes Technology Society Error Grid was used for clinical accuracy assessment, and hypoglycemia/hyperglycemia alert reliability was analyzed [14].
The following diagram illustrates the workflow of this complex study design.
The Scientist's Toolkit: Key Research Reagents and Equipment
Table 2: Essential Materials for CGM Performance Evaluation
| Item Name | Function / Application in Research |
|---|---|
| YSI 2300 STAT PLUS Analyzer | Considered the gold-standard laboratory instrument for glucose measurement. It uses a glucose oxidase-based method to provide reference plasma glucose values against which CGM sensor accuracy is benchmarked [14] [55]. |
| Cobas Integra 400 Plus Analyzer | A laboratory analyzer using a hexokinase-based method. Used as a secondary venous plasma reference method to understand how CGM performance varies with different comparator technologies [14]. |
| Contour Next Meter | A handheld capillary blood glucose monitoring system. Used to collect comparator data in both free-living and clinical settings, representing typical point-of-care glucose measurement [14]. |
| Standardized Meal | A meal with a defined carbohydrate content (e.g., 100g) used to induce a predictable postprandial glycemic excursion, testing sensor performance during dynamic glucose changes [14] [55]. |
For the research and drug development community, selecting a CGM system requires a nuanced understanding of its performance across the glycemic spectrum. The evidence indicates that while modern CGM systems like the FreeStyle Libre 3 and Dexcom G7 demonstrate high overall accuracy, their performance profiles differ.
The FreeStyle Libre 3 has shown strong overall accuracy, particularly in normoglycemic and hyperglycemic ranges [54] [14]. The Dexcom G7 also demonstrates high accuracy and may offer relative strengths in hypoglycemia detection in some studies [14]. The Medtronic Simplera showed a promising performance in the hypoglycemic range in one evaluation, though with lower overall accuracy compared to the other two systems [14].
The choice of system for clinical research should be guided by the primary glycemic endpoint of interest. Studies focusing on time-in-range and hyperglycemia reduction might prioritize one system, while trials where hypoglycemia safety is the primary outcome might consider another. Ultimately, researchers must critically evaluate the methodologies used in accuracy studies, as results are highly dependent on the study design, reference methods, and the inclusion of clinically relevant glycemic challenges [14].
Continuous Glucose Monitoring (CGM) systems have evolved from optional tools to recommended standards of care, fundamentally transforming diabetes management for both type 1 and type 2 diabetes [56]. For researchers and drug development professionals, understanding the precise technical capabilities and performance characteristics of these devices is crucial for designing clinical trials, developing integrated technologies, and advancing therapeutic algorithms. This guide provides an objective, data-driven comparison of leading CGM systems, focusing on their core feature sets, wear time, form factors, and, most critically, their accuracy as established under controlled experimental conditions. The analysis is framed within the broader context of sensor accuracy comparison research, providing the methodological details and performance metrics essential for scientific evaluation.
Comparative Device Specifications
The current CGM landscape is characterized by rapid innovation, with key players including Dexcom, Abbott, and Medtronic introducing systems with varying technical profiles. The table below summarizes the core specifications of leading CGM systems as available in 2025.
Table 1: Technical Specifications of Leading Continuous Glucose Monitoring (CGM) Systems
| CGM Sensor (Manufacturer) | Sensor Size (cm) | Wear Time (Days) | Glucose Range (mg/dL) | Warm-up Time (min) | Calibration Required | MARD (%) |
|---|---|---|---|---|---|---|
| Dexcom G7 [56] | 2.7 x 2.4 x 0.46 | 10 (with 12-hour grace period) | 40–400 | 30 | No (optional) | 8.2–9.1 |
| Dexcom G7 15-Day [57] | Not specified | 15 (with 12-hour grace period) | Not specified | 30 | No | 8.0 |
| Abbott FreeStyle Libre 3 [56] | 2.1 diameter x 0.28 | 14 | 40–500 | 60 | No | 7.9–9.4 |
| Medtronic Simplera [14] | Not specified | 7 | 50–400 | Not specified | No | 11.6–16.6* |
| Eversense 365 [7] | Implantable | 365 | Not specified | Once annually | Not specified | 8.8 |
| Caresens Air / Barozen Fit [56] | 3.5 x 1.9 x 0.5 | 15 | 40–500 | 120 | Yes (every 24 hours) | 9.4–10.42 |
Note: The MARD for Medtronic Simplera shows a range based on different comparator methods [14].
Key Feature Analysis
Wear Time and Form Factor: Significant variation exists in sensor longevity, directly impacting user burden and medical waste. Dexcom's G7 15-Day, cleared by the FDA in April 2025, represents the company's longest-wear sensor attempt to date at 15.5 days, reducing monthly sensor changes [57]. In contrast, Senseonics' Eversense 365 offers a paradigm shift as a fully implantable sensor with a 365-day wear time, requiring only a single annual warm-up period [7]. Medtronic's Simplera has a 7-day wear time [14], while Abbott's FreeStyle Libre 3 maintains a 14-day duration [56].
Accuracy Metrics: The Mean Absolute Relative Difference (MARD) is the standard metric for evaluating CGM accuracy, with lower values indicating closer agreement with reference glucose levels [57] [7]. The Dexcom G7 15-Day sensor has a reported MARD of 8.0% [57], while the Eversense 365 boasts a MARD of 8.8% [7]. It is critical to note that MARD can vary with sensor age, individual physiology, and clinical settings [57].
Experimental Protocols for CGM Performance Evaluation
To ensure reliable and comparable accuracy data, researchers employ standardized clinical testing protocols. The following workflow visualizes a comprehensive methodology for head-to-head CGM performance evaluation, as implemented in a recent 2025 study [14].
Diagram 1: CGM Performance Evaluation Workflow
Detailed Methodology
The experimental design, as outlined in a 2025 study published in the Journal of Diabetes Science and Technology, involves several critical phases [14]:
Participant Profile and Sensor Deployment: The study enrolled 24 adult participants with type 1 diabetes. Each participant wore one sensor from each of the three CGM systems (FreeStyle Libre 3, Dexcom G7, and Medtronic Simplera) in parallel on the upper arms for up to 15 days. Sensor sites were distributed equally between arms, and sensors could be affixed with additional tape if necessary to maintain adhesion [14].
Comparator Methods and Frequency: A key strength of this protocol is the use of three different comparator methods during structured 7-hour Frequent Sampling Periods (FSPs) on days 2, 5, and 15. Measurements were taken every 15 minutes using:
- YSI 2300 STAT PLUS: A laboratory analyzer using a glucose oxidase-based method (venous).
- Cobas Integra 400 plus: A laboratory analyzer using a hexokinase-based method (venous).
- Contour Next: A handheld blood glucose monitoring system (capillary) [14]. This multi-method approach allows researchers to assess the impact of the comparator method itself on performance results.
Glucose Manipulation Procedure: To test sensor performance under dynamic conditions, a standardized glucose manipulation procedure was conducted during FSPs. This procedure, designed to induce clinically relevant glycemic scenarios, involved:
- Consumption of a carbohydrate-rich breakfast followed by a delayed insulin bolus to induce initial hyperglycemia.
- Subsequent induction of hypoglycemia accompanied by rapid glucose changes.
- Final stabilization of glucose levels in the normoglycemic range. An experienced physician managed individual excursions using fast-absorbed carbohydrates, additional insulin boluses, and mild exercise to achieve the target comparator data distribution while ensuring participant safety [14].
The Scientist's Toolkit: Key Research Reagents and Equipment
Table 2: Essential Materials for CGM Performance Studies
| Item | Function in Experiment | Example Models |
|---|---|---|
| Laboratory Glucose Analyzer | Provides high-precision venous reference measurements. Consider both glucose oxidase and hexokinase methods. | YSI 2300 STAT PLUS, Cobas Integra 400 plus [14] |
| Capillary Blood Glucose Monitor | Provides point-of-care reference measurements and supports glucose excursion management. | Contour Next system [14] |
| CGM Systems Under Test | Devices being evaluated for accuracy and performance. | FreeStyle Libre 3, Dexcom G7, Medtronic Simplera [14] |
| Data Logging & Analysis Software | For storing paired CGM and reference values, and calculating performance metrics (MARD, bias, etc.). | Custom or commercial solutions supporting CG-DIVA [14] |
Analysis of Performance Data and Clinical Implications
The rigorous experimental protocol yields comprehensive data on the relative performance of different CGM systems, which has direct implications for their use in clinical research and drug development.
Comparative Accuracy Findings
The 2025 head-to-head study revealed that performance results varied depending on the comparator method used, underscoring the importance of methodological transparency [14].
MARD by Comparator Method: When compared against the YSI 2300 laboratory analyzer, the MARD values for FreeStyle Libre 3 (FL3), Dexcom G7 (DG7), and Medtronic Simplera (MSP) were 11.6%, 12.0%, and 11.6%, respectively. However, when assessed against the Cobas Integra, the MARDs were 9.5% for FL3, 9.9% for DG7, and 13.9% for MSP. This highlights that FL3 and DG7 tended to show better accuracy across different comparators compared to MSP [14].
Performance in Different Glycemic Ranges: The study also found that FL3 and DG7 demonstrated better accuracy in the normoglycemic and hyperglycemic ranges, while MSP performed better in the hypoglycemic range [14]. This nuanced performance profile is critical for researchers designing studies where accuracy in specific glycemic ranges is paramount.
Impact on Diabetes Management and Research Endpoints
The technical advancements in CGM systems directly influence their clinical utility and their role as endpoints in clinical trials.
Glycemic Control Improvements: CGM use is associated with consistent improvements in key glycemic metrics. Evidence shows HbA1c reductions of 0.25%–3.0% and time-in-range improvements of 15%–34% [56]. These metrics are increasingly used as primary endpoints in diabetes drug and device trials.
Beyond Glucose Monitoring: CGM is also recognized as an effective educational tool for lifestyle modification, providing real-time feedback that helps patients understand how diet and physical activity affect glucose levels [56]. This secondary benefit can influence adherence and outcomes in long-term studies.
The CGM landscape in 2025 is dynamic, with devices offering a range of technical specifications tailored to different user needs and research applications. For the scientific community, the choice of a CGM system for clinical trials or integration into new technologies must be informed by robust, head-to-head performance data obtained through standardized methodologies like the one detailed herein. Key differentiators include wear time (from 7 days to a full year), form factor (disposable vs. implantable), and critically, accuracy profiles that may vary across glycemic ranges. As CGM technology continues to evolve, maintaining rigorous, transparent evaluation standards will be essential for validating their performance and effectively leveraging their capabilities to advance diabetes research and therapeutic development.
The evaluation of continuous glucose monitoring (CGM) system performance relies on comparing sensor readings against reference blood glucose (BG) measurements. However, methodological variations in how these values are paired can significantly influence reported accuracy metrics, potentially confounding direct comparisons between different CGM systems. This analysis examines the quantitative impact of different comparator value pairing methods on CGM performance assessment, providing researchers and drug development professionals with a framework for interpreting comparative study data.
A critical challenge in CGM performance evaluation stems from the fundamental data collection mismatch: CGM readings are stored at fixed intervals (typically every five minutes), while comparator BG measurements are performed manually at less frequent intervals (typically every 15 minutes) [58]. This asynchrony necessitates methodological decisions about which CGM values to pair with which BG measurements, a choice that meaningfully impacts the resulting accuracy calculations.
Comparative Analysis of Pairing Methodologies
A scoping review of CGM accuracy studies revealed that four primary methods are commonly used for pairing CGM and comparator values [58]. The characteristics and applications of these methods are detailed in Table 1.
Table 1: Common CGM-to-Comparator Value Pairing Methods
| Pairing Method | Description | Number of Studies Identified | Key Characteristics |
|---|---|---|---|
| Closest | Pairs the CGM reading recorded closest in time to the BG value | 30 | Neutral regarding time lag; uses only actually recorded CGM values |
| CGM After | Pairs the CGM reading recorded simultaneously or after the BG timestamp | 18 | Systematically compensates for CGM system time lag |
| Linear Interpolation | Uses interpolation to estimate a CGM value at the exact BG timestamp | 14 | Can generate values never displayed to the user; a technical compromise |
| CGM Before | Pairs the CGM reading recorded simultaneously or before the BG timestamp | 4 | Can exacerbate the perceived time lag of the system |
Impact on Reported Accuracy Metrics
The choice of pairing method introduces quantifiable variability in the primary metric for CGM accuracy, the Mean Absolute Relative Difference (MARD). Analysis of data from a recent CGM system with a five-minute sampling interval demonstrated that the pairing method alone can cause differences in MARD of up to 1.8% [58]. This degree of variation is substantial enough to influence performance rankings between competing CGM systems.
The direction of this impact is method-dependent. The "CGM after" method typically yields the highest (best) apparent accuracy, as it systematically compensates for a CGM system's intrinsic time lag [58]. This characteristic makes it a method potentially favored by manufacturers seeking to report optimized performance. Conversely, the "CGM before" method tends to result in the lowest (worst) apparent accuracy by exacerbating the perceived time lag. The "linear interpolation" and "closest" methods serve as a compromise between these two extremes, offering a more neutral technical assessment [58].
Experimental Protocols for CGM Performance Evaluation
Standardized Clinical Evaluation Workflow
Robust evaluation of CGM performance requires a controlled clinical study design. The following workflow, derived from recent multi-system comparisons, outlines key procedural steps [10].
Figure 1: Experimental workflow for head-to-head CGM performance evaluation, highlighting critical stages (yellow) that directly influence accuracy outcomes.
A typical protocol involves:
- Participant Cohort: Recruiting adults with type 1 diabetes, with each participant wearing all test CGM systems simultaneously on the upper arms to enable paired-data analysis [10].
- Testing Sessions: Conducting multiple in-clinic sessions (e.g., on days 2, 5, and 15) where glucose levels are measured frequently (every 15 minutes) using laboratory-grade reference instruments [10].
- Glucose Excursions: Inducing controlled glucose fluctuations through standardized meals, insulin dosing, and sometimes exercise to evaluate sensor performance across the dynamic glycemic range [10].
- Data Analysis: Pairing CGM readings with reference values post-study using a pre-specified method, followed by calculation of MARD and other accuracy metrics like consensus error grid analysis [10].
Key Research Reagents and Materials
Table 2: Essential Research Materials for CGM Performance Studies
| Item / Solution | Function in Experiment | Specification Example |
|---|---|---|
| Laboratory Reference Analyzer (YSI) | Provides high-accuracy venous blood glucose reference values | YSI 2300 STAT PLUS glucose and lactate analyzer [59] |
| Blood Glucose Meter | Used for capillary reference measurements and CGM calibration | Contour Next meter [10] |
| CGM Systems | Devices under evaluation | Dexcom G7, FreeStyle Libre 3, Medtronic Simplera, Eversense [10] [60] |
| Data Logging Software | Secures timestamped CGM and reference data | Custom software or manufacturer-specific cloud platforms [61] |
Case Study: Multi-System Accuracy Comparison
Performance Under Standardized Conditions
A 2025 head-to-head comparison of leading CGM systems illustrates how accuracy varies between devices when evaluated under consistent conditions. This study utilized the "closest" pairing method for data analysis [10].
Table 3: Comparative CGM Accuracy (MARD) Against Different Reference Methods
| CGM System | MARD vs. YSI Lab Reference | MARD vs. Contour Next Meter | Key Performance Characteristics |
|---|---|---|---|
| FreeStyle Libre 3 | 11.6% | 9.7-10.1% | Consistent across reference methods; stable from first day (MARD ~10.9%) [10] |
| Dexcom G7 | 12.0% | 9.7-10.1% | Consistent across reference methods; slightly higher initial MARD (~12.8%) [10] |
| Medtronic Simplera | 11.6% | 16.6% | Less reliable vs. fingerstick; high day-1 MARD (~20.0%) [10] |
| Eversense CGM System | 9.6% (PRECISION Study) | N/R | Sustained accuracy through 90-day sensor life [60] |
Performance Across Glycemic Ranges
CGM accuracy is not uniform across all glucose ranges, which has clinical implications for different patient populations.
- Normal & High Glucose: Dexcom G7 and FreeStyle Libre 3 demonstrate strongest performance, closely tracking post-meal spikes [10].
- Low Glucose (Hypoglycemia): Medtronic Simplera showed superior detection capability, identifying 93% of low events compared to Dexcom G7 (80%) and FreeStyle Libre 3 (73%), though with a higher false alarm rate [10].
- Rapid Glucose Changes: Dexcom G7 and FreeStyle Libre 3 maintained steady performance during rapid rises, while Simplera performed better during rapid drops [10].
Standardization Initiatives and Future Directions
The documented variability in CGM performance evaluation has prompted standardization efforts. The Working Group on CGM of the International Federation of Clinical Chemistry and Laboratory Medicine (IFCC) has developed a comprehensive guideline defining requirements for [42]:
- Study design and procedures
- Characteristics of comparator measurements
- Minimum accuracy requirements
- Performance characterization
These guidelines aim to facilitate harmonized therapy outcomes and standards of care by making results from different studies more comparable. Based on current evidence, many researchers recommend adopting the "closest" pairing method for all future CGM performance evaluations due to its neutrality regarding time lag and exclusive use of actually recorded CGM values [58]. In cases where two CGM readings are equidistant to the BG timestamp, pairing the earlier reading is recommended [58].
The method used to pair CGM readings with comparator blood glucose values significantly impacts reported accuracy, with MARD values varying by up to 1.8% between different methodologies. This variability complicates direct comparison between CGM systems evaluated in different studies and underscores the necessity for strict methodological standardization. Future comparative research should adhere to emerging guidelines from bodies like the IFCC, clearly report the pairing methodology employed, and consider performance across different glycemic ranges to provide a comprehensive assessment of clinical accuracy.
Conclusion
The current landscape of CGM technology is characterized by high and improving accuracy, with leading systems like the Dexcom G7 and FreeStyle Libre 3 demonstrating MARD values between 8-9% in recent head-to-head studies. However, reported performance is highly dependent on study methodology, including the choice of comparator and glycemic challenges employed. For biomedical research, this underscores the critical need for standardized testing protocols to enable valid cross-study comparisons. Key takeaways include the reliability of factory-calibrated sensors for clinical trial endpoints, the importance of range-specific accuracy for safety, and the evolving potential of CGM data as a robust biomarker in drug development. Future directions should focus on establishing universal performance testing guidelines, extending accuracy analysis to pediatric and special populations, and integrating real-world evidence with clinical validation to fully leverage CGM data in therapeutic innovation.
References
- 1. MARD (Mean Absolute Relative Difference) [https://www.adces.org/education/danatech/glucose-monitoring/continuous-glucose-monitors-(cgm)/cgm-101/cgm-glossary/mard-(mean-absolute-relative-difference)]
- 2. Benefits and Limitations of MARD as a Performance ... [https://pmc.ncbi.nlm.nih.gov/articles/PMC7189145/]
- 3. The Need for a Modern Error Grid for Clinical Accuracy of ... [https://pmc.ncbi.nlm.nih.gov/articles/PMC10899826/]
- 4. ISPAD Clinical Practice Consensus Guidelines 2022 - PMC [https://pmc.ncbi.nlm.nih.gov/articles/PMC10107687/]
- 5. Comparison of Point Accuracy Between Two Widely Used ... [https://pmc.ncbi.nlm.nih.gov/articles/PMC11089878/]
- 6. Comparison of the Numerical and Clinical Accuracy of Four ... [https://pmc.ncbi.nlm.nih.gov/articles/PMC4607511/]
- 7. 5 Best Continuous Glucose Monitors for 2025 [https://www.type1strong.org/blog-post/5-best-continuous-glucose-monitors-for-2025]
- 8. Dexcom G7 15 Day Receives FDA Clearance: the Longest ... [https://investors.dexcom.com/news/news-details/2025/Dexcom-G7-15-Day-Receives-FDA-Clearance-the-Longest-Lasting-Wearable-and-Most-Accurate-CGM-System/default.aspx]
- 9. Dexcom G7 15 Day Continuous Glucose Monitoring ... [https://investors.dexcom.com/news/news-details/2025/Dexcom-G7-15-Day-Continuous-Glucose-Monitoring-System-to-Launch-on-Dec--1-in-the-United-States/default.aspx]
- 10. Dexcom G7 vs FreeStyle Libre 3 vs Medtronic Simplera [https://www.snaq.ai/blog/cgm-accuracy-comparison-2025-dexcom-g7-vs-freestyle-libre-3-vs-medtronic-simplera]
- 11. Dexcom Report Unveiled at ATTD 2025 Reveals HCPs ... [https://investors.dexcom.com/news/news-details/2025/Dexcom-Report-Unveiled-at-ATTD-2025-Reveals-HCPs-Favour-Tech-Over-Medication-for-Future-of-Type-2-Care/default.aspx]
- 12. FDA Clears MiniMed™ 780G System to Enable Integration ... [https://news.medtronic.com/2025-09-02-FDA-Clears-MiniMed-TM-780G-System-to-Enable-Integration-with-the-Instinct-Sensor,-Made-by-Abbott,-and-Approves-Use-in-Type-2-Diabetes]
- 13. Accuracy of a 15-day Factory-Calibrated Continuous ... [https://pubmed.ncbi.nlm.nih.gov/40183340/]
- 14. Performance of Three Continuous Glucose Monitoring ... [https://pmc.ncbi.nlm.nih.gov/articles/PMC11795573/]
- 15. Measures of Accuracy for Continuous Glucose Monitoring ... [https://pmc.ncbi.nlm.nih.gov/articles/PMC6501529/]
- 16. How Much Accuracy of Interstitial Glucose Measurement Is ... [https://pmc.ncbi.nlm.nih.gov/articles/PMC5478034/]
- 17. Continuous Glucose Monitoring Use in Clinical Trials for ... [https://pmc.ncbi.nlm.nih.gov/articles/PMC8061554/]
- 18. : ISO - In vitro diagnostic test systems — 15197 for... 2013 Requirements [https://www.iso.org/standard/54976.html]
- 19. Analytical Performance Requirements for Systems for Self ... [https://pmc.ncbi.nlm.nih.gov/articles/PMC4525642/]
- 20. Analytical Performance Requirements for Systems for Self-Monitoring... [https://pubmed.ncbi.nlm.nih.gov/25872965/]
- 21. Accuracy Standards Changing SMBG Meter Design FDA 2025 [https://www.linkedin.com/pulse/fda-2025-accuracy-standards-changing-smbg-meter-design-bhardwaj-dlnif]
- 22. Reproducibility of continuous glucose monitoring results ... [https://www.nature.com/articles/s41598-023-40949-1]
- 23. Capillary and Venous Blood Glucose Accuracy in ... [https://pmc.ncbi.nlm.nih.gov/articles/PMC6501528/]
- 24. Analysis of “Capillary and Venous Blood Glucose Accuracy ... [https://pmc.ncbi.nlm.nih.gov/articles/PMC6501518/]
- 25. Accuracy Evaluation of Five Blood Glucose Monitoring Systems... [https://pmc.ncbi.nlm.nih.gov/articles/PMC3317395/]
- 26. Monitoring of the Analytical Performance of Four Different ... [https://pmc.ncbi.nlm.nih.gov/articles/PMC11561228/]
- 27. The Best Continuous Glucose Monitors of 2025 [https://www.nesaz.com/the-best-continuous-glucose-monitors-of-2025/]
- 28. CGM Data Analysis 2.0: Functional Data Pattern Recognition ... [https://pmc.ncbi.nlm.nih.gov/articles/PMC12356821/]
- 29. The Role of Missing Data and Imputation Strategies [https://www.medrxiv.org/content/10.1101/2025.02.13.25322196v1.full-text]
- 30. Analysis of “Accuracy of a 14-Day Factory Calibrated ... [https://pmc.ncbi.nlm.nih.gov/articles/PMC8875038/]
- 31. Comparative Accuracy Analysis of a Real-time and an ... [https://pmc.ncbi.nlm.nih.gov/articles/PMC8256076/]
- 32. Continuous Glucose Monitoring: Changing Diabetes ... [https://pmc.ncbi.nlm.nih.gov/articles/PMC2769738/]
- 33. Dexcom, Inc. MARCS-CMS 700835 — March 04, 2025 [https://www.fda.gov/inspections-compliance-enforcement-and-criminal-investigations/warning-letters/dexcom-inc-700835-03042025]
- 34. Assessing Sensor Accuracy for Non-Adjunct Use of ... [https://pmc.ncbi.nlm.nih.gov/articles/PMC4346608/]
- 35. Clinical Performance Evaluation of Continuous Glucose ... [https://pmc.ncbi.nlm.nih.gov/articles/PMC10658695/]
- 36. Dexcom G7 vs. FreeStyle Libre 3 and Libre 3 Plus [https://www.dexcom.com/en-us/all-access/dexcom-cgm-explained/dexcom-g7-vs-freestyle-libre-3-and-libre-3-plus-choosing-the-right-cgm]
- 37. CGM Tips and Tricks for Better Accuracy and Less Frustration [https://diatribe.org/diabetes-technology/cgm-tips-and-tricks-better-accuracy-and-less-frustration]
- 38. Continuous glucose monitoring combined with artificial ... [https://pmc.ncbi.nlm.nih.gov/articles/PMC12146165/]
- 39. Testing the Real-World Accuracy of the Dexcom G6 Pro ... [https://pmc.ncbi.nlm.nih.gov/articles/PMC10771867/]
- 40. Autoregressive Modeling of Drift and Random Error to ... [https://pmc.ncbi.nlm.nih.gov/articles/PMC5761979/]
- 41. Fault and meal detection by redundant continuous glucose ... [https://www.sciencedirect.com/science/article/abs/pii/S1746809417300952]
- 42. A proposed guideline by the IFCC Working Group on CGM [https://www.sciencedirect.com/science/article/pii/S0009898125006072]
- 43. Interference of Intravenous Acetaminophen with ... [https://www.jmaj.jp/detail.php?id=10.31662%2Fjmaj.2025-0186]
- 44. CGM Device Comparison [https://pro.aace.com/cgm/toolkit/cgm-device-comparison]
- 45. Interfering Medications with Dexcom CGM and Side Effects [https://www.dexcom.com/en-us/interference]
- 46. Effect of Acetaminophen on CGM Glucose in an Outpatient ... [https://pmc.ncbi.nlm.nih.gov/articles/PMC4876736/]
- 47. Factory-Calibrated Continuous Glucose Monitoring [https://pmc.ncbi.nlm.nih.gov/articles/PMC6477582/]
- 48. What is calibration [https://www.freestyle.abbott/en-bh/support/what-is-calibration-.html]
- 49. Comparative Performance Analysis of Manual and ... [https://pmc.ncbi.nlm.nih.gov/articles/PMC12226519/]
- 50. Hidden Statistical Challenges of Continuous Glucose ... [https://pmc.ncbi.nlm.nih.gov/articles/PMC12623221/]
- 51. CGM The Bells And Whistles| GNL [https://theglucoseneverlies.com/cgm-bells-whistles/]
- 52. Assessing CGM Accuracy Performance [https://theglucoseneverlies.com/assessing-cgm-accuracy-performance/]
- 53. Transformative Advances in Continuous Glucose ... [https://pmc.ncbi.nlm.nih.gov/articles/PMC12007415/]
- 54. Comparison of Point Accuracy Between Two Widely Used ... [https://pubmed.ncbi.nlm.nih.gov/38189290/]
- 55. Accuracy Assessment of the GlucoMen® Day CGM System ... [https://www.mdpi.com/2079-6374/12/2/106]
- 56. Advances in Continuous Glucose Monitoring: Clinical ... [https://pmc.ncbi.nlm.nih.gov/articles/PMC12061739/]
- 57. FDA Clears Dexcom G7 15 Day [https://beyondtype1.org/dexcom-g7-15-day-fda-approval/]
- 58. Comparator Value Pairing Impacts Reported Continuous ... [https://pmc.ncbi.nlm.nih.gov/articles/PMC12102080/]
- 59. Accuracy and Reliability of Continuous Glucose Monitoring ... [https://pmc.ncbi.nlm.nih.gov/articles/PMC3746288/]
- 60. A Prospective Multicenter Evaluation of the Accuracy and ... [https://pmc.ncbi.nlm.nih.gov/articles/PMC6532543/]
- 61. FreeStyle Libre Systems vs. Dexcom: Compare CGM ... [https://www.freestyle.abbott/us-en/compare-cgms.html]