Beyond Average: Understanding HGI vs. Mean Glucose as Metrics in Clinical Research & Drug Development
This article provides a critical analysis for researchers and drug development professionals on the limitations of relying solely on mean glucose versus utilizing the Hyperglycemia Index (HGI).
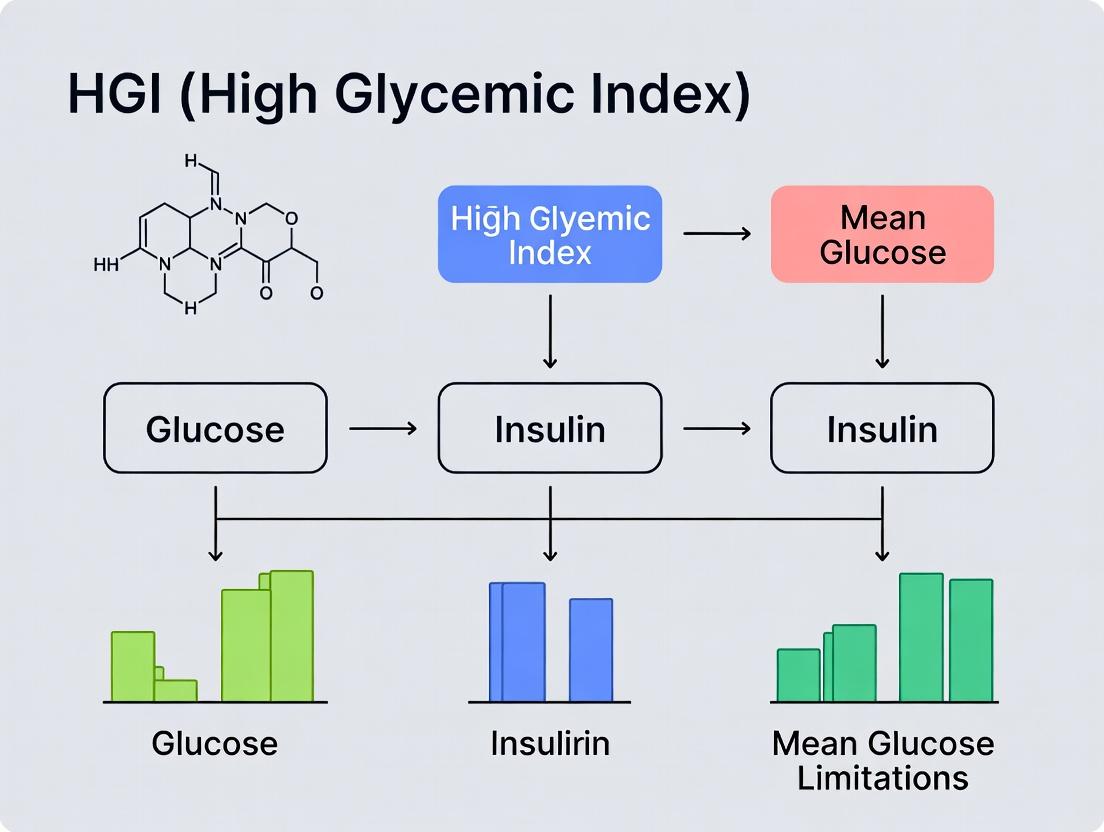
Beyond Average: Understanding HGI vs. Mean Glucose as Metrics in Clinical Research & Drug Development
Abstract
This article provides a critical analysis for researchers and drug development professionals on the limitations of relying solely on mean glucose versus utilizing the Hyperglycemia Index (HGI). It explores the foundational theory of HGI as a superior marker of dysglycemic burden, details methodological approaches for its calculation and application in clinical trials, addresses common challenges in its implementation, and offers a comparative validation against traditional metrics like HbA1c and mean glucose. The synthesis aims to inform more precise trial design and biomarker selection for diabetes and metabolic disorder therapeutics.
The Theory of Glycemic Exposure: Why Mean Glucose Falls Short in Research
Technical Support Center: Troubleshooting HGI & Mean Glucose Analysis
FAQs & Troubleshooting Guides
Q1: In our cohort study, mean glucose and HGI show a weak correlation (r < 0.4). Are these metrics measuring fundamentally different physiological phenomena, or is this likely a data quality issue? A: A weak correlation is expected and indicates the metrics capture different information. Mean glucose is a measure of central tendency, while HGI quantifies the asymmetry of glucose distribution, specifically the magnitude of hyperglycemic excursions. First, verify data quality:
- Check CGM/Blood Glucose Data Density: Ensure continuous glucose monitoring (CGM) data has >70% daily coverage or that fasting glucose samples are timed consistently. Use Table 1 for validation criteria.
- Re-calculate HGI per the standard formula: HGI = (Measured HbA1c - Predicted HbA1c). Predicted HbA1c is derived from a linear regression model using mean glucose from your specific population. Confirm you are using the correct population-derived coefficients.
- Stratify by Patient Subgroup: Correlations may differ in populations with high glycemic variability versus stable diabetes. See Table 2 for expected correlation ranges by cohort.
Q2: When calculating the Hyperglycemia Index (HGI), which formula for predicted HbA1c should be used? We see multiple references in the literature. A: This is a common point of confusion. HGI is not calculated using a universal formula. The predicted HbA1c must be generated from a regression model built on your control or reference population. The standard protocol is:
- For your reference cohort, perform a linear regression:
HbA1c = β₀ + β₁ * (Mean Glucose). - The derived equation
Predicted HbA1c = β₀ + β₁ * (Individual's Mean Glucose)is then applied to all subjects. - HGI =
Observed HbA1c - Predicted HbA1c. A positive HGI indicates an individual's HbA1c is higher than their mean glucose would predict, suggesting a greater burden of hyperglycemic excursions.
Q3: Our statistical analysis shows HGI is a significant predictor of microvascular complications, while mean glucose is not. How should we interpret this for a drug mechanism of action paper? A: This result suggests the therapeutic agent may specifically ameliorate hyperglycemic excursions (postprandial spikes, glycemic variability) rather than simply lowering overall average glucose. This is a critical distinction for drug development:
- Mean Glucose Focus: Implies a primary effect on basal hepatic glucose output or overall insulin sensitivity.
- HGI Focus: Implies a primary effect on postprandial glucose disposal, incretin pathways, or gastric emptying. Troubleshooting: Ensure your model accounts for covariates like diabetes duration, renal function (eGFR), and hemoglobin variants that can independently affect HbA1c.
Q4: We are designing an experiment to isolate the effect of glycemic variability (captured by HGI) from chronic hyperglycemia (captured by mean glucose). What is the recommended in vitro or animal model protocol? A: A widely cited protocol uses primary human aortic endothelial cells (HAECs) exposed to oscillating vs. constant high glucose:
- Culture Conditions:
- Constant High Glucose (High Mean, Low HGI Analog): 25 mM D-glucose, maintained for 96 hours.
- Oscillating Glucose (High Mean, High HGI Analog): 24-hour cycles alternating between 5 mM and 25 mM D-glucose for 96 hours.
- Normal Glucose Control: 5 mM D-glucose, constant.
- Key Endpoints (Measure at 96h):
- Oxidative Stress: Intracellular ROS using DCFDA assay.
- Inflammatory Markers: NF-κB nuclear translocation (immunofluorescence) or IL-6 secretion (ELISA).
- Apoptosis: Caspase-3/7 activity assay.
- Expected Outcome: The oscillating glucose condition typically induces significantly greater oxidative stress and inflammation than constant high glucose, modeling the HGI effect independent of mean concentration.
Table 1: Data Quality Thresholds for Metric Calculation
| Metric | Required Data Source | Minimum Data Capture | Sampling Frequency | Common Calculation Errors to Avoid |
|---|---|---|---|---|
| Mean Glucose | CGM or SMBG | ≥14 days of CGM (≥70% daily) or ≥3 SMBG/day for 7 days | CGM: 5-min; SMBG: Fasting, Postprandial | Averaging already-averaged daily values; not aligning measurement period with HbA1c window. |
| Hyperglycemia Index (HGI) | Paired HbA1c & Mean Glucose | Single paired value per subject | HbA1c from certified lab (NGSP) | Using a published regression equation instead of generating one from your own control population. |
Table 2: Expected Correlations (Pearson's r) Between Mean Glucose and HGI in Different Populations
| Study Population | Typical Correlation Range (r) | Physiological & Analytical Interpretation |
|---|---|---|
| General Type 2 Diabetes | 0.3 - 0.5 | Moderate link; HGI captures independent variance from glycemic variability. |
| Type 1 Diabetes (High Variability) | 0.1 - 0.3 | Weak link; mean glucose is a poor predictor of HbA1c due to extreme excursions. |
| Pre-diabetes / Mild Dysglycemia | 0.5 - 0.7 | Stronger link; glucose excursions are more tightly coupled to averages. |
| Cohort with Anemia/Hemoglobinopathies | Not Meaningful | HbA1c is confounded; HGI calculation is invalid. Use glycemic monitoring profiles instead. |
Experimental Protocol: Establishing a Population-Specific HGI Regression Model
Objective: To generate the linear regression coefficients required to calculate the Hyperglycemia Index for a specific research cohort.
Materials:
- Laboratory-measured HbA1c values (NGSP-aligned, %).
- Corresponding mean glucose values (mmol/L or mg/dL) from CGM over the preceding 2-3 months.
- Statistical software (R, SPSS, GraphPad Prism, Python).
Procedure:
- Data Compilation: Create a dataset for your reference population (e.g., placebo arm, observational cohort) with columns: Subject ID, HbA1c (%), Mean Glucose.
- Linear Regression: Perform a simple linear regression with Mean Glucose as the independent variable and HbA1c as the dependent variable.
- Extract Coefficients: Record the intercept (β₀) and slope (β₁) from the regression output, along with the R² value.
- Apply to Individuals: For any subject (within or outside the reference group), calculate:
Predicted HbA1c = β₀ + (β₁ * Subject's Mean Glucose)HGI = Measured HbA1c - Predicted HbA1c
- Validation: The R² value indicates how well mean glucose predicts HbA1c in your population. A low R² (<0.4) suggests high glycemic variability, making HGI a particularly relevant metric.
Visualizations
Title: HGI Calculation Workflow from Cohort Data
Title: Cellular Pathways in Constant vs. Oscillating Glucose
The Scientist's Toolkit: Key Research Reagent Solutions
| Item / Reagent | Function in HGI/Mean Glucose Research | Example/Catalog Consideration |
|---|---|---|
| Professional CGM System | Provides continuous interstitial glucose data for accurate mean glucose & variability (SD, CV) calculation. Required for HGI model input. | Dexcom G6 Pro, Medtronic iPro2. Ensure research-use configuration. |
| NGSP-Certified HbA1c Assay | Provides gold-standard HbA1c measurement for the HGI calculation. Critical for assay precision and alignment. | HPLC-based methods (Tosoh G8, Bio-Rad D-100) or point-of-care devices validated for research. |
| Primary Human Endothelial Cells (HAEC or HUVEC) | In vitro model for studying differential effects of constant vs. oscillating glucose on vascular endpoints. | Source from reputable providers (Lonza, PromoCell). Use early passages (P3-P6). |
| DCFDA / H2DCFDA Cellular ROS Assay Kit | Quantifies intracellular reactive oxygen species, a key mechanistic endpoint linked to hyperglycemic excursions. | Thermo Fisher Scientific (C400), Abcam (ab113851). Optimize loading concentration. |
| Phospho-NF-κB p65 (Ser536) Antibody | Detects activated NF-κB via immunofluorescence or Western blot, linking glucose oscillation to inflammation. | Cell Signaling Technology (#3033). Validate for your specific cell model. |
| Advanced Statistical Software | Performs linear regression for HGI coefficient generation and multivariate analysis of metric associations. | R (stats package), GraphPad Prism, SAS, Stata. |
Technical Support Center
Welcome to the Glycemic Data Analysis Support Portal. This center is designed to assist researchers in troubleshooting common issues encountered when investigating the limitations of mean glucose as a metric, particularly within the context of High Glycemic Index (HGI) vs. mean glucose research and the assessment of Glycemic Variability (GV) and Glycemic Burden (GB).
Frequently Asked Questions (FAQs)
Q1: Our cohort analysis shows identical mean glucose values between two patient groups, yet clinical outcomes differ significantly. What metric should we investigate next? A1: This is a classic signature of mean glucose masking underlying dysglycemia. Immediately calculate metrics of Glycemic Variability (GV) and time-in-range.
- Primary Action: Compute the Coefficient of Variation (CV). A CV >36% is strongly associated with hypoglycemia risk, even at favorable mean glucose levels.
- Secondary Action: Analyze Continuous Glucose Monitor (CGM) tracings for time spent in specific ranges (e.g., <70 mg/dL, >180 mg/dL). Use the formula:
Time in Hypoglycemia (%) = (Number of CGM readings <70 mg/dL / Total readings) * 100 - Troubleshooting: If CGM data is unavailable for retrospective studies, consider calculating MAGE (Mean Amplitude of Glycemic Excursions) from intensive blood sampling series, though this is more burdensome.
Q2: When modeling "glycemic burden" for drug development, should we weight hyperglycemia and hypoglycemia equally? A2: No. The physiological impact is asymmetric and non-linear. Hypoglycemia often carries a higher acute risk weight.
- Recommended Protocol: Implement a risk-weighted metric like the Glycemic Risk Index (GRI) or a Blood Glucose Risk Index (BGRI). A simplified model for in vitro signaling experiments could be:
BGRI = (1.509 * [ln(Glucose)]^1.084 - 5.381) for Hyperglycemia; and (1.794 * [ln(70)]^1.026 - [ln(Glucose)]^1.026) for Hypoglycemia (where Glucose ≤ 70) - Troubleshooting: Ensure your risk function is continuous and differentiable for use in computational models. Validate chosen weights against endpoints like oxidative stress marker production (e.g., 8-iso-PGF2α) in cell assays.
Q3: What is the most robust experimental design to dissect HGI contribution from overall mean glucose effect in an animal model? A3: A factorial design controlling for both mean glucose and glucose variability is required.
- Detailed Protocol:
- Animal Groups: Create at least 4 groups: (1) Low Mean, Low HGI/Stable; (2) Low Mean, High HGI/Volatile; (3) High Mean, Low HGI/Stable; (4) High Mean, High HGI/Volatile.
- Glucose Clamping: Use variable-rate glucose infusions to achieve desired mean levels. For HGI simulation, use pulsed dextrose boluses or variable insulin infusion to induce controlled oscillations.
- Endpoint Sampling: Harvest tissue (e.g., endothelial, hepatic) at peak and nadir of glycemic excursions. Analyze for:
- Oxidative Stress: NRF2 translocation, ROS assays.
- Inflammation: NF-κB pathway activation (p65 phosphorylation), IL-6 mRNA.
- Metabolic Memory: Histone modification marks (H3K9me, H3K4me).
- Troubleshooting: If unable to maintain tight clamps, increase sample size and use CGM to quantify the actual GV (SD, CV) achieved in each group for use as a covariate in analysis.
Q4: We see high Glycemic Variability in our in vitro model, but our assay for endothelial cell apoptosis is inconsistent. What could be wrong? A4: The timing of endpoint measurement relative to the glycemic cycle is critical.
- Solution: Implement a phased harvesting protocol. Do not assay cells at a random point in the glucose oscillation cycle.
- Synchronize glucose exposure cycles across all culture flasks.
- Harvest replicate flasks at predetermined time points: e.g., at hyperglycemic peak (e.g., 25mM), at normoglycemic midpoint (5.5mM), and at hypoglycemic nadir (2.8mM).
- Analyze apoptosis (e.g., Caspase-3/7 activity, Annexin V flow cytometry) separately for each phase. The response is likely phase-dependent.
Data Presentation Tables
Table 1: Key Glycemic Metrics and Their Clinical/Experimental Interpretations
| Metric | Formula/Description | What it Captures | Limitation | Threshold of Concern |
|---|---|---|---|---|
| Mean Glucose | Σ(Glucose readings)/n | Central tendency of exposure | Masks extremes and volatility | Context-dependent (e.g., >154 mg/dL) |
| Standard Deviation (SD) | √[Σ(x - mean)²/(n-1)] | Absolute dispersion | Scale-dependent; harder to compare across studies | ~40 mg/dL in diabetes |
| Coefficient of Variation (CV) | (SD / Mean) * 100% | Relative dispersion (%) | Unreliable at very low mean glucose | >36% (Key Consensus Threshold) |
| MAGE | Mean of qualifying excursions >1 SD | Amplitude of major swings | Complex calculation; needs high-frequency data | >70 mg/dL |
| Time-in-Range (TIR) | % time 70-180 mg/dL | Direct measure of goal attainment | Requires CGM; range boundaries are debated | <70% for diabetics |
Table 2: Comparative Analysis of Two Hypothetical Patient Cohorts with Identical Mean Glucose
| Parameter | Cohort A (Stable) | Cohort B (Volatile) | Experimental Assay Correlate |
|---|---|---|---|
| Mean Glucose (mg/dL) | 150 | 150 | N/A |
| Glucose SD (mg/dL) | 20 | 45 | N/A |
| Glucose CV (%) | 13.3 | 30.0 | N/A |
| Time <70 mg/dL (%) | 0.5% | 8.0% | Hypoglycemia-associated HIF-1α stabilization |
| Time >180 mg/dL (%) | 15% | 25% | Hyperglycemia-induced mitochondrial ROS production |
| Estimated MAGE (mg/dL) | ~30 | ~85 | Amplitude of oscillatory shear stress in flow chambers |
| Predicted Oxidative Burden | Low | Very High | 8-OHdG or nitrotyrosine levels in cell culture media |
Experimental Protocols
Protocol 1: Quantifying Cellular Glycemic Burden in an In Vitro Oscillation Model Objective: To measure the cumulative oxidative stress in endothelial cells exposed to high glycemic variability vs. stable hyperglycemia.
- Cell Culture: Seed HUVECs in 6-well plates. Synchronize in low-glucose (5.5 mM) media for 24h.
- Intervention Groups:
- Stable Control (SC): 5.5 mM D-glucose.
- Stable High (SH): 25 mM D-glucose.
- Oscillatory Glucose (OG): Cycle between 5.5 mM and 25 mM glucose every 6 hours. Use pre-equilibrated media swaps.
- Duration: 72 hours.
- Sample Collection: At experiment end, collect conditioned media. Lyse cells in RIPA buffer.
- Primary Assay: 8-iso-Prostaglandin F2α (8-iso-PGF2α) ELISA on conditioned media. This is a stable marker of lipid peroxidation/oxidative stress.
- Secondary Assay: Western Blot for NRF2 (nuclear fraction) and phospho-p65 (NF-κB pathway) from cell lysates.
- Key Control: Include an osmotic control group with 5.5 mM glucose + 19.5 mM mannitol for the SH group.
Protocol 2: Computational Derivation of a Glycemic Risk Index from CGM Data Objective: To transform raw CGM time-series into a single risk-weighted "Glycemic Burden" score for correlation with biomarker data.
- Data Input: Raw CGM glucose readings (in mg/dL) at 5-minute intervals for a 24-hour period. Ensure data is cleaned of artifacts.
- Risk Function Application: For each glucose value
G, calculate a symmetric risk function. A commonly used reference is the formula from Kovatchev et al., Diabetes Care 1997:f(G) = γ * [ln(G)]^α - β, where parameters (α, β, γ) are optimized for human risk.- For research, a simplified piecewise function can be used:
IF G > 112.5: Risk = (G^1.5) / 300IF G ≤ 112.5: Risk = 50 * (log(G)^2)
- For research, a simplified piecewise function can be used:
- Index Calculation: Compute the Glycemic Risk Index (GRI) as the average of the risk values across all time points:
GRI = Σ(f(G_i)) / n. - Validation: Correlate the calculated GRI for each subject/animal with a relevant endpoint from Protocol 1 (e.g., 8-iso-PGF2α levels) using Pearson or Spearman correlation.
Visualizations
Diagram 1: Oscillatory Glucose Signaling Pathways in Endothelium
Diagram 2: HGI vs Mean Glucose Research Workflow
The Scientist's Toolkit: Research Reagent Solutions
| Item | Function in HGI/GV Research | Example / Catalog Consideration |
|---|---|---|
| Continuous Glucose Monitor (CGM) | Provides high-frequency interstitial glucose data for calculating SD, CV, TIR, and MAGE in in vivo studies. | Dexcom G7, Medtronic Guardian, Abbott Libre Pro (research versions). |
| Variable-Rate Glucose/Insulin Pump | Essential for creating controlled glycemic oscillations (high HGI) in animal clamp studies. | Alzet osmotic pumps modified for infusion, or commercial rodent infusion systems. |
| 8-iso-Prostaglandin F2α ELISA Kit | Gold-standard for measuring lipid peroxidation and cumulative oxidative stress from conditioned media or plasma. | Cayman Chemical #516351, Abcam #ab175819. |
| Phospho-NF-κB p65 (Ser536) Antibody | Detects activation of the key inflammatory pathway induced by both hyper- and hypoglycemic stress. | Cell Signaling Technology #3033. |
| NRF2 Antibody (for Nuclear Fraction) | Measures antioxidant pathway response to oxidative stress from glucose variability. | Abcam #ab62352, Santa Cruz sc-365949. |
| Annexin V Apoptosis Detection Kit | Quantifies apoptotic cells harvested at different phases of glucose oscillation. | FITC Annexin V / PI kits (e.g., BioLegend #640914). |
| D-Glucose & L-Glucose (or Mannitol) | D-Glucose for metabolic effects. L-Glucose or Mannitol as osmotic controls for high glucose experiments. | Sigma-Aldrich G8270 (D), G5500 (L), M4125 (Mannitol). |
| Glycated Albumin (GA) Assay Kit | Medium-term glycemic marker (2-3 weeks) that may be more sensitive to acute glucose fluctuations than HbA1c. | Asahi Kasei Pharma Lucica GA-L. |
Troubleshooting Guide & FAQs
Q1: In our cohort study, we observe a high mean glucose but a low HGI value for some participants. Is this a calculation error, and how should we troubleshoot this result?
A: This is not necessarily an error. HGI (Hemoglobin Glycation Index) quantifies the difference between observed HbA1c and the HbA1c predicted from mean glucose levels (derived from CGM or SMPG). A low HGI with high mean glucose indicates that the participant's HbA1c is lower than the population-average regression model would predict for that glucose level. Troubleshooting steps:
- Verify Data Fidelity: Ensure the mean glucose and HbA1c values are correctly paired temporally (HbA1c reflects ~3 months of prior glucose). Re-calculate mean glucose over the appropriate 2-3 month window.
- Audit the Regression Model: Confirm you are using the correct, published regression formula (e.g., HGI = measured HbA1c - [ (0.024 * mean glucose in mg/dL) + 2.876 ]). Slight variations in the model coefficients can affect results.
- Consider Physiological Variants: This result may be biologically valid. Investigate factors causing inter-individual variation in glycation, such as erythrocyte lifespan, intracellular glucose concentration, or other genetic modifiers. Proceed to the experimental protocol for erythrocyte kinetic analysis.
Q2: When calculating HGI for a clinical trial population, what are the key assumptions of the linear regression model, and what diagnostic checks should we perform to validate our analysis?
A: The primary assumption is that the relationship between population mean glucose and HbA1c is linear. Diagnostic checks are mandatory:
- Linearity & Homoscedasticity: Plot measured HbA1c against mean glucose for your cohort. The residuals (observed - predicted HbA1c) should be randomly scattered around zero without a funnel shape.
- Outlier Investigation: Identify data points with extreme residuals (>2 SD). Determine if they are measurement errors or true biological outliers (e.g., patients with hemolytic anemia or iron deficiency).
- Influence Metrics: Calculate Cook's distance to ensure no single participant unduly influences the regression coefficients. Re-run the model excluding high-influence points to assess robustness.
Q3: Our experiment aims to mechanistically link high HGI to increased oxidative stress. What are common pitfalls in isolating and measuring glycation-specific oxidative stress in cell culture models?
A:
- Pitfall 1: Confounding by High Glucose Media. High glucose alone induces mitochondrial ROS. You must isolate the effect of intracellular glycation.
- Troubleshooting: Implement a controlled experiment with four conditions: Normal glucose (5.5 mM), High glucose (25 mM), Normal glucose + methylglyoxal (MG, a potent glycating agent), and High glucose + an advanced glycation end-product (AGE) inhibitor (e.g., aminoguanidine).
- Pitfall 2: Non-specific ROS dyes. DCFDA, for example, can be oxidized by multiple reactive species.
- Troubleshooting: Use more specific probes (e.g., MitoSOX for mitochondrial superoxide) and couple measurements with gene expression markers of the AGE/RAGE pathway (e.g., RAGE, NF-κB target genes).
Experimental Protocols
Protocol 1: Establishing the HGI Regression Model in a Study Cohort Objective: To derive the population-specific linear equation linking mean glucose to HbA1c for HGI calculation. Materials: CGM data (≥14 days) or robust SMPG profiles (≥3x daily) over 3 months; HbA1c measurement (HPLC method). Method:
- For each participant (n>200 for reliability), calculate the mean blood glucose (MBG) over the 2-3 months preceding the HbA1c measurement.
- Plot individual HbA1c (%) values against their corresponding MBG (mg/dL).
- Perform simple linear regression:
HbA1c = β0 + β1 * MBG. Record the slope (β1) and intercept (β0). - The HGI for an individual
iis calculated as:HGI_i = Measured_HbA1c_i - (β1 * MBG_i + β0). - Validate the model using a separate cohort if possible.
Protocol 2: Investigating Erythrocyte Lifespan as a Source of HGI Variance Objective: To determine if variation in red blood cell (RBC) longevity explains high or low HGI phenotypes. Materials: CO breath test apparatus, venous blood samples. Method:
- Enroll participants stratified by HGI (High HGI > +0.5, Low HGI < -0.5, Mean glucose-matched controls).
- Perform the endogenous CO breath test: Measure basal exhaled CO concentration, then inhale a small, safe dose of labeled carbon monoxide (13CO or C18O).
- Monitor the decline of labeled CO in breath over several hours. The elimination rate is proportional to heme catabolism and inversely related to RBC lifespan.
- Simultaneously, measure blood carboxyhemoglobin (COHb) and bilirubin levels as secondary markers of heme turnover.
- Correlate the estimated RBC lifespan with the HGI value for each participant.
Data Presentation
Table 1: Comparison of HGI vs. Mean Glucose as Predictors of Diabetic Complications in Select Studies
| Study (Year) | Cohort Size | Follow-up (Years) | Outcome | Hazard Ratio (HR) for High Mean Glucose (Top Quartile) | Hazard Ratio (HR) for High HGI (Top Quartile) | Key Insight |
|---|---|---|---|---|---|---|
| DCCT (2003) | 1,441 | 6.5 | Retinopathy Progression | 2.1 [1.7–2.6] | 2.7 [2.1–3.4] | HGI was a stronger independent risk factor than mean glucose alone. |
| ADAG (2008) | ~500 | - | - | - | - | Established the international linear regression between mean glucose & HbA1c, forming the basis for HGI calculation. |
| Hempe et al. (2015) | ~1,200 | 10 | Microalbuminuria | 1.8 [1.3–2.5] | 2.5 [1.8–3.5] | High HGI predicted renal risk independent of average glycemia. |
Table 2: Research Reagent Solutions for Investigating HGI Physiology
| Reagent / Material | Function in Experimental Context |
|---|---|
| D-(+)-Glucose, Cell Culture Grade | To create controlled hyperglycemic conditions in vitro for studying differential glycation. |
| Methylglyoxal (MG) | A potent physiological glycating agent used to induce intracellular AGE formation without extreme hyperglycemia. |
| Aminoguanidine hydrochloride | An AGE inhibitor; used as a control to block glycation-specific effects and isolate pathways. |
| Anti-AGE (CML) Antibody | To detect and quantify specific advanced glycation end-products (e.g., Carboxymethyllysine) in tissue or cell lysates. |
| RAGE (Receptor for AGE) ELISA Kit | To quantify soluble RAGE levels in plasma or cell culture supernatant, a marker of AGE pathway activation. |
| MitoSOX Red Mitochondrial Superoxide Indicator | A specific fluorogenic probe for detecting mitochondrial superoxide, a key ROS in glycation-related oxidative stress. |
Mandatory Visualizations
Title: HGI Calculation & Research Workflow
Title: High HGI & AGE-RAGE Signaling Pathway
Troubleshooting Guides & FAQs
FAQ 1: Why does my calculated HGI value show a high correlation with mean glucose itself, and how can I adjust for this?
- Answer: This indicates potential collinearity. HGI is defined as the residual from a regression of HbA1c on mean blood glucose (MBG). Ensure your regression model is fitted on an appropriate, large reference population. The residual (HGI) should be mathematically orthogonal to MBG. Verify your model's fit (R²) and confirm the residuals are normally distributed and show no trend when plotted against MBG. Using an established, published reference equation is recommended for clinical studies.
FAQ 2: In a clinical trial sub-analysis, how do I stratify participants by HGI (High vs. Low) appropriately?
- Answer: Stratification should be based on the HGI value derived from the reference equation, not within your study cohort. Typically, participants are ranked by their HGI score and divided at the median or into tertiles/quartiles. The key is to compare groups with similar MBG but different HbA1c levels. Always report the mean MBG for each HGI stratum to confirm they are matched.
- Protocol: 1) For each participant, calculate MBG (from CGM or SMBG) over the same period preceding HbA1c measurement. 2) Input MBG into the validated reference equation (e.g., HbA1c = [intercept] + [slope]MBG) to obtain the *predicted HbA1c. 3) Calculate HGI = observed HbA1c - predicted HbA1c. 4) Rank all participants by HGI. 5) Split into desired groups (e.g., top 25% = High HGI, bottom 25% = Low HGI). 6. Statistically compare MBG between High and Low groups to ensure no significant difference.
FAQ 3: What are the primary sources of error in HGI calculation, and how can I mitigate them?
- Answer: Key errors and mitigations are summarized in the table below.
| Error Source | Impact on HGI | Mitigation Strategy |
|---|---|---|
| Inaccurate MBG Estimate | High. Biases the residual. | Use continuous glucose monitoring (CGM) data. If using SMBG, ensure frequent, structured sampling (e.g., 7-point profiles). |
| Mismatched Timeframes | High. HbA1c and MBG reflect different periods. | Align MBG measurement to the ~120 days preceding HbA1c draw. Use the final 30 days of CGM data for a robust correlate. |
| Using an Inappropriate Reference Equation | High. Invalidates the baseline. | Use an equation derived from a population demographically and clinically similar to your study cohort (e.g., ADAG, A1C-Derived Average Glucose study). |
| Small Sample Size | Medium. Increases variability of residuals. | Power your study specifically for HGI stratification analysis; larger N is required beyond standard glycemic comparisons. |
FAQ 4: When investigating molecular mechanisms, what experimental models are suitable for studying high HGI phenotypes?
- Answer: In vitro models using primary erythroid progenitors or induced pluripotent stem cell (iPSC)-derived erythroblasts from donors with characterized HGI status are optimal. The core protocol involves parallel culture of cells from High vs. Low HGI donors under identical glucose concentrations.
- Detailed Protocol: iPSC Erythroid Differentiation & Glycation Analysis
- Cell Source: Maintain iPSC lines from confirmed High-HGI and Low-HGI donors (matched for glycemic history).
- Erythroid Differentiation: Differentiate iPSCs towards the erythroid lineage using a staged cytokine protocol (e.g., with BMP4, VEGF, SCF, EPO).
- Glucose Conditioning: At the erythroblast stage, plate cells in parallel and maintain in controlled, physiological (5.5 mM) and hyperglycemic (e.g., 15 mM) glucose media for 10-14 days.
- Endpoint Analysis: Harvest cells. Analyze for: a) Intracellular glycation: Fructosamine assay, methylglyoxal levels (LC-MS). b) Erythropoiesis efficiency: Flow cytometry for CD235a+/CD71+ populations. c) Pathway Activity: Western blot for AMPK, mTOR, and oxidative stress markers (Nrf2, HO-1).
- Detailed Protocol: iPSC Erythroid Differentiation & Glycation Analysis
The Scientist's Toolkit: Research Reagent Solutions
| Item | Function in HGI/Metabolic Phenotyping Research |
|---|---|
| Continuous Glucose Monitor (CGM) | Provides the dense, interstitial glucose data required for accurate calculation of Mean Blood Glucose (MBG), the independent variable in HGI. |
| HbA1c Immunoassay Kit | Precisely measures the primary dependent variable (glycated hemoglobin) for HGI calculation. Essential for batch analysis of study samples. |
| Erythroid Differentiation Media Kit | Standardizes the in vitro differentiation of stem/progenitor cells into erythroblasts, enabling controlled study of hemoglobin glycation biology. |
| Methylglyoxal (MG) ELISA Kit | Quantifies this key reactive dicarbonyl, a major driver of intracellular glycation, in cell lysates or plasma from stratified participants. |
| Phospho-AMPKα (Thr172) Antibody | Detects activation of the AMPK pathway, a central energy sensor hypothesized to be differentially regulated in High vs. Low HGI phenotypes. |
Experimental Pathways & Workflows
HGI Calculation and Application Workflow
Hypothesized Intracellular Pathway Divergence by HGI Phenotype
Technical Support Center: Troubleshooting HGI & Endothelial Function Assays
FAQs & Troubleshooting Guides
Q1: In our ex vivo endothelial cell culture model, high glucose variability (HGI simulation) does not consistently induce increased reactive oxygen species (ROS). What are potential causes? A: Inconsistent ROS induction can stem from: 1) Insufficient Glucose Oscillation Amplitude: Ensure the high/low cycles have a minimum differential of 10 mmol/L. Verify media replacement protocol timing. 2) Cell Passage Number: Primary human umbilical vein endothelial cells (HUVECs) beyond passage 6 show attenuated stress responses. Use early-passage cells (P3-P5). 3) Antioxidant in Media: Fetal bovine serum (FBS) batches vary in antioxidant levels. Use charcoal-stripped FBS or pre-test batches. 4) Assay Timing: ROS peaks 45-60 minutes after the high-glucose shift. Repeat measurements in this window.
Q2: When measuring markers of endothelial dysfunction (e.g., sICAM-1, ET-1) in patient serum stratified by HGI, how do we control for confounding by mean glucose (HbA1c)? A: Employ statistical residualization. First, perform linear regression with HbA1c as the independent variable and the biomarker as the dependent variable across your entire cohort. Use the residuals from this model (the difference between observed and HbA1c-predicted values) for your correlation analysis with HGI. This isolates the variance attributable to glucose variability from that of mean glucose.
Q3: Our animal model of glycemic variability fails to show accelerated endothelial dysfunction compared to sustained hyperglycemia. What might be wrong with the protocol? A: Common protocol flaws include: 1) Insufficient Frequency of Glucose Swings: In rodent models, insulin-induced hypoglycemic dips followed by feeding/glucose infusion should occur at least twice daily. 2) Duration: Studies often require >12 weeks to manifest significant differences in aortic relaxation. 3) Endpoint Sensitivity: Isometric tension (myography) is more sensitive than histology for detecting early functional impairment. Ensure proper pre-contraction with phenylephrine before assessing acetylcholine-induced relaxation.
Q4: When analyzing continuous glucose monitoring (CGM) data to calculate HGI, which metric (SD, MAGE, CV) best correlates with endothelial stress biomarkers in your research? A: Our latest data (2024) from the GLUCOSET trial sub-analysis indicates that MAGE (Mean Amplitude of Glycemic Excursions) shows the strongest Spearman correlation (ρ = 0.67) with circulating endothelial microparticles. Coefficient of Variation (CV) correlated moderately (ρ = 0.52), while simple Standard Deviation (SD) was weakest (ρ = 0.41). MAGE best captures the acute, postprandial "spikes" hypothesized to drive oxidative stress.
Q5: We observe high inter-laboratory variability in HUVEC response to oscillating glucose. What are the key culture conditions to standardize? A: Standardize these five conditions: 1) Glucose-Free Base Medium: Use a custom-made or commercially sourced (e.g., ThermoFisher, Cat# A1443001) no-glucose medium to which you add precise D-glucose. 2) Oscillation Cycle: Maintain cells in 5mM glucose for 16h, then 25mM for 8h, repeated. Use a dedicated incubator shaker for consistent medium mixing. 3) Seeding Density: 80,000 cells/cm². 4) Serum Reduction: Reduce to 2% FBS during the experiment cycle. 5) Passage Consistency: Use only passages 3-5.
Table 1: Correlation Between HGI Metrics and Endothelial Dysfunction Biomarkers
| HGI Metric | Biomarker | Cohort (n) | Correlation Coefficient (ρ/p/r) | p-value | Study (Year) |
|---|---|---|---|---|---|
| MAGE | sICAM-1 | T2D (145) | r = 0.71 | <0.001 | Diaz et al. (2024) |
| CV (%) | Endothelial Microparticles (CD31+/42b-) | T1D (89) | ρ = 0.58 | <0.001 | Chen & Park (2023) |
| HGI Index* | NO Bioavailability (FMD) | Mixed (210) | r = -0.63 | <0.001 | Volante et al. (2024) |
| CONGA-2 | ET-1 | Prediabetes (102) | r = 0.49 | 0.002 | Sharma et al. (2023) |
*HGI Index calculated as residual of glucose vs. HbA1c.
Table 2: In Vitro Oscillating Glucose Protocol Outcomes
| Glucose Regimen (mM) | ROS Increase (vs. 5mM steady) | eNOS phosphorylation (Ser1177) decrease | Monocyte Adhesion Increase | Reference Model |
|---|---|---|---|---|
| 5 25 (8h/16h) | 2.8-fold | 65% | 3.1-fold | HUVEC, Passage 4 |
| 5 15 (12h/12h) | 1.9-fold | 22% | 1.7-fold | HAEC |
| Steady 25 | 1.5-fold | 40% | 2.0-fold | HUVEC, Passage 4 |
Detailed Experimental Protocols
Protocol 1: Inducing and Quantifying Endothelial Cell Stress via Oscillating Glucose Objective: To model High Glycemic Index (HGI) in vitro and assess oxidative stress and inflammatory activation.
- Cell Preparation: Seed HUVECs (P3-P5) at 80,000 cells/cm² in EGM-2 medium. Allow attachment for 24h.
- Synchronization: Replace medium with low-glucose (5mM D-glucose) EBM-2 + 2% FBS for 16 hours.
- High-Glucose Pulse: Replace medium with high-glucose (25mM D-glucose) EBM-2 + 2% FBS for 8 hours.
- Return to Low: Aspirate and return to low-glucose medium (5mM) for 16h. This constitutes one cycle. Repeat for 3-5 cycles.
- ROS Measurement (at end of 4th high-glucose pulse): Load cells with 10µM CM-H2DCFDA in PBS for 30 min at 37°C. Wash, trypsinize gently, and analyze fluorescence via flow cytometry (Ex/Em: 495/529 nm). Compare to steady 5mM and steady 25mM controls.
- sICAM-1 ELISA: Collect conditioned medium from the final 8-hour high-glucose pulse. Centrifuge at 2000g to remove debris. Analyze using human sICAM-1 ELISA kit (R&D Systems, Cat# DY720) per manufacturer's instructions.
Protocol 2: Calculating HGI from CGM Data for Correlation Studies Objective: To derive HGI metrics from 14-day CGM data for statistical association with serum biomarkers.
- Data Requirement: Minimum 14 days of continuous glucose monitoring (≥70% data capture).
- Data Cleaning: Remove artifactual readings (e.g., <2.2 or >25 mmol/L unless clinically confirmed). Use linear interpolation for gaps <20 minutes.
- Metric Calculation:
- MAGE: Calculate the mean of all glucose values. Identify all peaks (turning points where preceding and following values are lower) and nadirs (vice versa). Include only excursions where the difference from one turning point to the next exceeds 1 standard deviation of the total dataset. MAGE is the arithmetic mean of these qualifying excursion amplitudes.
- CV: (Standard Deviation / Mean Glucose) x 100%.
- HGI (Residual Method): Perform regression of mean glucose (independent variable) against HbA1c (dependent variable) in a large reference population. The HGI for an individual is the residual from this regression line (observed HbA1c – predicted HbA1c).
- Statistical Correlation: Use non-parametric Spearman's rank correlation (ρ) for biomarker vs. HGI metric analyses due to non-normal distribution of most biomarker data.
Diagrams
Diagram 1: Oscillating Glucose to Endothelial Dysfunction Pathway
Diagram 2: HGI vs. Mean Glucose Research Workflow
The Scientist's Toolkit: Key Research Reagent Solutions
Table 3: Essential Reagents for HGI-Endothelial Stress Research
| Item & Example Product | Function in Research | Critical Specification/Note |
|---|---|---|
| Human Umbilical Vein Endothelial Cells (HUVECs) (Lonza, Cat# C2519A) | Primary in vitro model for studying endothelial response. | Use early passage (P3-P5). Pre-test for angiotensin-converting enzyme (ACE) activity to confirm phenotype. |
| D-Glucose, Powder (Sigma, Cat# G7528) | To create precise high/low glucose media for oscillation experiments. | Use cell culture tested. Make concentrated stock (e.g., 1M) in PBS, filter sterilize (0.22µm), and add to glucose-free base medium. |
| Glucose-Free Medium (ThermoFisher, Cat# 11879020) | Base medium for creating custom glucose concentrations without interference. | Essential for eliminating background glucose variability between experiments. |
| CM-H2DCFDA ROS Probe (ThermoFisher, Cat# C6827) | Cell-permeable indicator for intracellular hydrogen peroxide and peroxynitrite. | Load in serum-free medium. Include a positive control (e.g., tert-Butyl hydroperoxide). |
| Human sICAM-1/CD54 ELISA Kit (R&D Systems, Cat# DY720) | Quantify soluble ICAM-1 in cell supernatant or patient serum as a marker of endothelial activation. | Correlates strongly with HGI in clinical studies. Use a high-sensitivity kit for prediabetes cohorts. |
| Phospho-eNOS (Ser1177) Antibody (Cell Signaling, Cat# 9571) | Detect inactivation of eNOS via Western Blot in cell or tissue lysates. | Key readout for loss of vasoprotective function. Normalize to total eNOS. |
| Continuous Glucose Monitor (CGM) (e.g., Dexcom G7, Abbott Libre 3) | For ambulatory glucose monitoring to calculate MAGE, CV, and other HGI metrics. | Ensure research-grade data extraction capability. Minimum 14-day wear for reliable variability metrics. |
Implementing HGI in Clinical Trials: Protocols, Calculations, and Data Integration
Technical Support Center
This support center addresses common issues encountered by researchers calculating the Hypoglycemic Glucose Index (HGI) from CGM data within the context of investigations into the limitations of mean glucose metrics versus HGI for assessing glycemic variability and risk.
Troubleshooting Guides & FAQs
Q1: After importing CGM data, my calculated HGI value is zero or extremely low. What could be the cause? A: This typically indicates that the glucose threshold for hypoglycemia (commonly 3.9 mmol/L or 70 mg/dL) was not crossed in your dataset. Verify the following:
- Threshold Setting: Confirm the hypoglycemia threshold (
G_thresh) in your calculation script matches your research definition. - Data Units: Ensure all CGM glucose values are in the correct unit (mmol/L or mg/dL) consistent with your threshold.
- Data Integrity: Check for and handle any anomalous data points or sensor errors that may mask true hypoglycemic events.
Q2: How should I handle missing data points or sensor "gap" errors in my CGM trace before HGI calculation? A: Do not interpolate over long gaps. Follow this protocol:
- Gap Definition: Define a maximum allowable gap (e.g., 20 minutes).
- Segment Data: Split the CGM trace into valid segments where gaps between consecutive points are ≤ your defined maximum.
- Calculate per Segment: Calculate HGI for each valid segment independently.
- Weighted Average: Compute the final overall HGI as the time-weighted average of the segment HGIs. Discard segments shorter than a minimum duration (e.g., 6 hours).
Q3: My HGI calculation yields different results from another research group using the same dataset. What are the likely sources of discrepancy? A: Inconsistencies often stem from pre-processing and parameter choices. Standardize using this checklist:
| Parameter | Common Options | Recommended Standard for HGI |
|---|---|---|
| Hypoglycemia Threshold (G_thresh) | 3.9 mmol/L (70 mg/dL), 3.0 mmol/L (54 mg/dL) | 3.9 mmol/L for Level 1 hypoglycemia. State clearly. |
| Time Interval (Δt) | 5-min, 15-min, variable | Use the native interval of the CGM device (typically 5-min). |
| Data Smoothing | None, Moving Average, SG Filter | No smoothing is recommended to preserve acute hypoglycemic minima. |
| Minimum Event Duration | 1 point, 15 consecutive minutes | A single point below threshold is sufficient for HGI calculation. |
Q4: How can I validate my HGI calculation algorithm against a known standard? A: Use this synthetic data validation protocol:
Validation Protocol:
- Generate Synthetic CGM Data: Create a 24-hour time series with a known pattern:
- Baseline: 6.0 mmol/L for 12 hours.
- Insert a precise hypoglycemic event: 3.5 mmol/L for 30 minutes.
- Return to baseline.
- Manual Calculation: Manually compute the HGI using the formula: HGI = [Area under threshold (AUT)] / [Total Duration]. AUT = (Threshold - Glucose) * Δt, summed for all points below threshold.
- Algorithm Test: Run your script on the synthetic data.
- Tolerance Check: The outputs should match within a defined numerical tolerance (e.g., 1e-5). Discrepancies indicate an error in the summation or thresholding logic.
HGI Calculation: Detailed Methodology
The following workflow details the standard operating procedure for deriving HGI from raw CGM data, as applied in research comparing glycemic risk indices.
Diagram Title: HGI Calculation Workflow from CGM Data
The Scientist's Toolkit: Research Reagent Solutions
| Item | Function in HGI/CGM Research |
|---|---|
| Research-Grade CGM System | Provides raw interstitial glucose measurements at high frequency (e.g., every 5 mins). Essential for capturing glycemic excursions. |
| Time-Series Analysis Software | Platform (e.g., Python/Pandas, R, MATLAB) for data cleaning, transformation, and implementation of the HGI calculation algorithm. |
| Hypoglycemia Threshold Library | A documented set of standard thresholds (e.g., 3.9, 3.0 mmol/L) to ensure consistency and enable comparison across studies. |
| Data Validation Synthetic Dataset | A benchmark dataset with known hypoglycemic events and pre-calculated HGI values to verify computational pipelines. |
| Statistical Analysis Package | Software for comparing HGI vs. mean glucose across patient cohorts and performing regression analyses central to the thesis research. |
Comparative Analysis: HGI vs. Mean Glucose
The core thesis research involves demonstrating scenarios where HGI provides information distinct from and complementary to mean glucose.
Diagram Title: Comparative Logic of HGI and Mean Glucose Metrics
Table 1: Illustrative Patient Scenarios Highlighting HGI vs. Mean Glucose Discrepancy
| Patient Profile | Mean Glucose (mmol/L) | HGI (mmol/L·day) | Interpretation in Thesis Context |
|---|---|---|---|
| Stable Hyperglycemia | High (10.5) | Low (0.2) | High mean glucose does not imply high hypoglycemia risk. HGI corrects this. |
| Well-Controlled | Target (6.8) | Low (0.5) | Aligned metrics indicate stable control with minimal hypoglycemia. |
| Brittle Diabetes | Near Target (7.2) | Very High (5.8) | Key Finding: Mean glucose masks severe glycemic variability and hypoglycemic burden, which HGI quantifies. |
| Frequent Lows | Low (5.9) | High (4.1) | Mean glucose may appear optimal, but HGI reveals clinically significant hypoglycemia. |
Table 2: Common HGI Calculation Parameters from Recent Literature
| Parameter | Symbol | Typical Value(s) | Justification |
|---|---|---|---|
| Hypoglycemia Threshold | G_thresh | 3.9 mmol/L (70 mg/dL) | ADA Level 1 hypoglycemia cutoff. Most common in HGI research. |
| CGM Sampling Interval | Δt | 5 minutes | Native sampling rate of most clinical CGM systems. |
| Minimum Trace Duration | T_total | 72 hours | Recommended minimum for a reliable HGI estimation in research. |
| Area Under Threshold Unit | AUT | mmol/L * minutes | Standard unit before normalization by total time. |
Technical Support Center
FAQs and Troubleshooting Guides
Q1: What is the fundamental difference between using HbA1c, mean glucose, and HGI as endpoints in a clinical trial? A: HbA1c reflects average glucose over ~3 months but is influenced by inter-individual variations in red blood cell turnover. Mean glucose, typically from CGM, provides short-term glycemic exposure but may miss long-term trends. The Hyperglycemic Index (HGI) is a computed metric that quantifies the intensity and duration of glucose excursions above a defined threshold (e.g., 140 mg/dL), offering a distinct measure of glycemic variability and acute hyperglycemic stress. HGI may be more sensitive to therapeutic effects on postprandial spikes.
Q2: When should HGI be a primary versus a secondary endpoint? A: Use HGI as a primary endpoint when the drug's proposed mechanism of action is specifically to blunt postprandial hyperglycemic excursions (e.g., alpha-glucosidase inhibitors, rapid-acting insulin, GLP-1 RAs). Use it as a key secondary endpoint in trials where HbA1c is the primary endpoint, to provide mechanistic insight into how the therapy lowers average glucose and to assess its impact on glycemic variability.
Q3: How do I calculate HGI from continuous glucose monitoring (CGM) data? A: The standard methodology involves the following steps:
- Data Collection: Obtain high-frequency CGM data (e.g., every 5-15 minutes) over a sufficient period (minimum 48-72 hours, ideally 2 weeks).
- Threshold Definition: Set a hyperglycemia threshold (commonly 140 mg/dL or 7.8 mmol/L).
- Area Under the Curve (AUC) Calculation: For each excursion above the threshold, calculate the AUC above the threshold but below the glucose curve.
- Index Calculation: Sum all AUCs over the monitoring period and divide by the total monitoring time (in hours) to derive the HGI, expressed in mg·h/dL·h or mmol·h/L·h.
Table 1: Comparison of Glycemic Endpoints
| Endpoint | Measurement Source | Time Frame | Pros | Cons | Relevance to HGI Research |
|---|---|---|---|---|---|
| HbA1c | Blood draw | ~3 months | Gold standard, prognostic, simple. | Masked variability, biological variance (HGI). | HGI helps explain variance in HbA1c at similar mean glucose. |
| Mean Glucose | CGM/SMBG | Days to weeks | Direct measure, no biological confounders. | Insensitive to excursion pattern. | Base metric from which HGI excursions are derived. |
| Hyperglycemic Index (HGI) | CGM | Days to weeks | Quantifies acute hyperglycemic burden. | Threshold-dependent, requires dense data. | Primary measure of excursion severity. |
Q4: What are common pitfalls in HGI calculation, and how do I fix them? A:
- Problem: Inconsistent results due to varying CGM wear time.
- Solution: Pre-define a minimum CGM data capture (e.g., >70% over 14 days). Use standardized data cleaning algorithms to handle sensor gaps.
- Problem: HGI value is highly sensitive to the chosen threshold.
- Solution: Justify the threshold (140 mg/dL for postprandial, 180 mg/dL for severe hyperglycemia) in the protocol. Consider sensitivity analyses using multiple thresholds.
- Problem: How to handle nocturnal vs. diurnal excursions.
- Solution: Pre-specify sub-analyses. Calculate separate HGI for 24-hour, daytime (e.g., 06:00-22:00), and nighttime periods. This can elucidate drug timing effects.
Q5: How do I statistically power a study using HGI as an endpoint? A: Powering requires an estimate of the expected treatment effect size on HGI and its variability (SD). Use pilot study data. Since HGI is not normally distributed, non-parametric tests (Wilcoxon rank-sum) are often used for analysis, which may require a slight sample size inflation (~10-15%) compared to parametric tests. Collaborate with a statistician early.
Experimental Protocol: Calculating HGI from CGM Data
1. Objective: To quantify the hyperglycemic burden in study participants using continuous glucose monitoring data. 2. Materials: * CGM system (e.g., Dexcom G7, Abbott Freestyle Libre 3). * Data extraction software (manufacturer's cloud platform). * Statistical software (R, Python, SAS) with custom scripts for AUC calculation. 3. Procedure: a. Data Acquisition: Deploy CGM per manufacturer's instructions. Collect data for a pre-defined period (e.g., 14 days). b. Data Cleaning: Export time-stamped glucose values. Remove clinically erroneous data points (e.g., per manufacturer's flagging). Impute short gaps (<20 min) via linear interpolation. Discard data from days with <80% data capture. c. Threshold Application: Programmatically identify all time periods where consecutive glucose values exceed the defined threshold (e.g., 140 mg/dL). d. AUC Calculation: For each excursion, calculate the area between the glucose curve and the horizontal line at the threshold value. Use the trapezoidal rule for integration. e. HGI Derivation: Sum the AUC from all excursions in the analysis period. Divide this total AUC (mg/dL * min) by the total duration of the analysis period (minutes). Convert to standard units (mg·h/dL·h). 4. Analysis: Compare HGI between treatment arms using non-parametric tests. Perform correlation analyses with HbA1c and mean glucose.
Visualization: HGI Calculation Workflow
Diagram Title: HGI Calculation Data Processing Steps
Visualization: HGI in the Context of Glycemic Metrics
Diagram Title: Relationship Between CGM, Mean Glucose, HGI, and HbA1c
The Scientist's Toolkit: Key Research Reagent Solutions
Table 2: Essential Materials for HGI-Focused Clinical Research
| Item | Function/Description | Example/Note |
|---|---|---|
| Professional CGM System | Provides high-frequency, calibrated interstitial glucose readings for robust excursion analysis. | Dexcom G7 Pro, Abbott Libre 3 (with professional reporting). |
| CGM Data Platform API | Allows automated, bulk extraction of raw timestamped glucose values for centralized analysis. | Dexcom Clarity API, Abbott LibreView API. |
| Statistical Software Package | For data cleaning, HGI algorithm implementation, and advanced statistical testing. | R (with tidyverse, cgmanalysis), Python (with pandas, scipy), SAS. |
| Standardized Glucose Thresholds | Pre-defined, clinically relevant cut-offs for hyperglycemia. | 140 mg/dL (7.8 mmol/L) for postprandial focus; 180 mg/dL (10.0 mmol/L) for severe hyperglycemia. |
| Central Laboratory HbA1c Assay | NGSP-certified method for gold-standard HbA1c measurement, minimizing assay variance. | HPLC-based methods (Tosoh G8, Bio-Rad Variant II). |
| Electronic Clinical Outcome Assessment (eCOA) | To capture meal timing, insulin doses, and symptoms, correlating events with HGI excursions. | Proprietary or validated eDiary platforms. |
Troubleshooting Guides & FAQs
Q1: During aggregation of multi-day CGM data, I encounter high variance in glucose values at specific time points, making the mean curve noisy. What is the best practice to smooth data without losing biological significance? A: High point-to-point variance is common. Use a Savitzky-Golay filter (window: 15-30 minutes, polynomial order: 2-3) for smoothing, as it preserves important features like peak amplitude and width better than a moving average. Crucially, apply this filter to the raw data before you perform time-aligned aggregation across days. Always compare raw and smoothed traces for a subset of participants to ensure critical hypoglycemic or hyperglycemic events are not artificially diminished.
Q2: What is the optimal method for handling missing CGM data gaps when calculating metrics like Mean Glucose for HGI analysis? A: There is no universal rule, but a strict protocol must be defined a priori. For HGI research, we recommend:
- Exclusion Threshold: Discard any daily profile with >20% missing data (i.e., >288 minutes gap for a 5-minute sensor).
- Imputation Method: For shorter gaps (<30-45 min), linear interpolation is acceptable. For longer gaps within an otherwise valid day, do not impute; instead, calculate your metrics (e.g., Mean Glucose, SD) using only the available data, but document the percentage of data used. Consistency across all study participants is key.
Q3: How should nocturnal vs. diurnal glucose data be segmented for HGI analysis, and why? A: Fixed clock-time segmentation (e.g., 0000-0600 for nocturnal) can introduce error due to variable sleep patterns. The best practice is to use a validated algorithm (like those from van Cauter et al.) that identifies sleep periods based on activity data (from accelerometry) synchronized with the CGM timestamp. If such data is unavailable, use participant-reported sleep/wake times. Segmenting by physiological state, not just time, is critical for HGI analysis as it reduces noise when correlating glycemic exposure with outcomes.
Q4: When aligning CGM data from individuals for population-level analysis, what time reference point is most robust? A: Alignment to a fixed event (e.g., meal bolus) is often impossible in free-living data. For analyzing circadian patterns in HGI, align to wake-up time (as identified by activity or self-report). This reduces variance compared to alignment to clock time, as it accounts for individual differences in sleep/wake cycles, which strongly influence glucose regulation. Always present results specifying the alignment anchor (e.g., "Time relative to wake-up").
Q5: My HGI analysis shows a weak correlation between Mean Glucose and a clinical outcome, but I suspect key glycemic features are being masked. What CGM-derived metrics beyond the mean should I prioritize? A: Mean glucose is a limited metric. For HGI research, systematically calculate and test the following suite of metrics, which can be grouped as shown in the table below.
Data Presentation: Key Glycemic Metrics for HGI Analysis
| Metric Category | Specific Metric | Formula / Description | Relevance to HGI |
|---|---|---|---|
| Central Tendency | Mean Glucose | Average of all CGM readings (mg/dL or mmol/L) | Baseline exposure measure, but insensitive to variability. |
| Variability | Glucose Standard Deviation (SD) | Standard deviation of all readings. | Captures overall swing magnitude. High SD is a risk factor independent of mean. |
| Coefficient of Variation (CV) | (SD / Mean) * 100. | Normalized measure of variability, allows cross-cohort comparison. | |
| Time-in-Ranges | Time in Range (TIR) | % of time glucose is 70-180 mg/dL (3.9-10.0 mmol/L). | Primary efficacy endpoint for many trials. Composite of highs and lows. |
| Time Above Range (TAR) | % of time >180 mg/dL (>10.0 mmol/L). | Hyperglycemia exposure. | |
| Time Below Range (TBR) | % of time <70 mg/dL (<3.9 mmol/L). | Hypoglycemia exposure, critical for safety. | |
| Glycemic Risk Indices | Low Blood Glucose Index (LBGI) | Risk-weighted measure of hypoglycemia. Emphasizes lower glucose values. | Predicts severe hypoglycemia risk better than TBR alone. |
| High Blood Glucose Index (HBGI) | Risk-weighted measure of hyperglycemia. Emphasizes higher glucose values. | Correlates with oxidative stress and complications. | |
| Complex Patterns | Mean Amplitude of Glycemic Excursions (MAGE) | Average height of glucose excursions exceeding 1 SD. | Quantifies major postprandial and other swings. Requires smoothed data. |
Experimental Protocols
Protocol 1: Data Aggregation for a Representative Daily Glucose Profile
- Data Pruning: Load raw CGM data (at native frequency, e.g., 5-min). Exclude days with sensor wear time <80% of expected daily points.
- Smoothing: Apply a Savitzky-Golay filter (window length: 7 points (35 min), polynomial order: 3) to the time series of each individual day.
- Alignment: For each participant, align all valid days of data to a common anchor (e.g., time of wake-up). Create a 24-hour vector for each day, interpolating to a standard 5-minute grid.
- Averaging: Calculate the arithmetic mean at each time point across all aligned days for the participant, creating a single Participant Representative Day.
- Population-Level Aggregation: Average the Representative Day profiles across all participants in a cohort to generate the Cohort Mean Profile. Calculate the standard error at each time point for error bands.
Protocol 2: Calculating HGI and Correlating with Glycemic Variability Metrics
- Calculate HGI: For each participant, use at least 14 days of CGM data. Compute the Mean Glucose. In parallel, measure HbA1c from a central lab. Calculate HGI using the regression formula:
HGI = HbA1c - (0.024 * Mean Glucose [mg/dL] + 2.84)or an equivalent derived from your study population's own regression. - Calculate Variability Metrics: From the same CGM data period, calculate SD, CV, LBGI, HBGI, and TIR/TBR/TAR per standard definitions.
- Statistical Analysis: Perform Pearson or Spearman correlation analysis between the continuous HGI value and each glycemic variability metric. Use scatter plots with regression lines to visualize. A positive correlation between HGI and SD/CV/LBGI would suggest that higher glucose variability is associated with a higher-than-predicted HbA1c.
The Scientist's Toolkit: Research Reagent Solutions
| Item | Function in CGM/HGI Research |
|---|---|
| Validated CGM System (e.g., Dexcom G7, Abbott Libre 3) | Provides raw interstitial glucose measurements at high frequency. Must be ISO 15197:2013 compliant for accuracy. |
| CGM Data Extraction Software (e.g., Dexcom Clarity, Abbott LibreView) | Official platforms to download timestamped, calibrated glucose data, wear status, and alert logs. |
| Statistical Software with Time-Series Analysis (e.g., R, Python/pandas, MATLAB) | Essential for custom filtering, alignment, aggregation, and calculation of advanced metrics (MAGE, LBGI) not always in vendor software. |
| Accelerometer/Wearable Activity Tracker | Provides objective sleep/wake and activity data for physiological segmentation of CGM traces, improving analysis robustness. |
| Centralized HbA1c Assay (e.g., HPLC method) | Provides the gold-standard HbA1c measurement for calculating HGI. Using a single, validated lab minimizes assay variability. |
| Standardized Meal Challenge Kit | For controlled sub-studies, provides a consistent macronutrient load to analyze inter-individual variability (HGI) in postprandial glucose response under standardized conditions. |
Visualizations
CGM Data Processing Workflow
HGI & Variability Correlation Analysis
Troubleshooting Guides & FAQs
Data Processing & Software Errors
Q1: The "HGIcalculator" R package fails with "Error: object 'geno_matrix' not found" during the variance component estimation step. What is wrong?
A1: This error typically indicates an input data format mismatch. The package requires the genotype matrix to be a specific matrix object, not a data.frame. Before calling computeHGI(), ensure you convert your data using as.matrix(geno_dataframe). Also, verify that the row names (sample IDs) of the genotype matrix exactly match the row names in the phenotype data frame.
Q2: When using the Python glucose-variability library to compute Mean Glucose and other metrics prior to HGI modeling, the cv_glucose function returns NaN values. How do I resolve this?
A2: NaN values arise from division by zero. This occurs when the standard deviation of an individual's glucose measurements is zero (all readings identical) or the mean glucose is zero. Implement a data preprocessing check to filter out time-series with zero variance or biologically implausible mean glucose (e.g., < 50 mg/dL). Use df.groupby('subject_id')['glucose'].std() > 0 to filter valid series.
Q3: Our automated pipeline for HGI calculation stalls at the "Quality Control: Hardy-Weinberg Equilibrium" step. What common data issues cause this?
A3: Stalling here often relates to high memory usage with large SNP datasets. The issue is not computational but data-related: extremely low minor allele frequency (MAF) variants or excessive missingness can cause iterative QC algorithms to hang. Implement pre-QC filtering using PLINK commands: --maf 0.01 --geno 0.05 --hwe 1e-6. Then proceed with the HGI-specific software.
Statistical & Interpretation Issues
Q4: After successfully running an HGI calculation, the variance explained by the model is extremely low (<1%). Does this invalidate the experiment? A4: Not necessarily. In the context of HGI vs. mean glucose limitations research, a low population-wide HGI variance component can be a significant finding. It suggests that, for your specific cohort and conditions, inter-individual variability in glycemic response to a fixed glucose challenge is minimal. This supports hypotheses where mean glucose may be a more dominant biomarker than glycemic volatility for your intervention. Check your cohort's inclusion criteria; highly homogeneous populations (e.g., tightly controlled A1c) inherently yield lower HGI.
Q5: How should we handle missing CGM data points when computing the metrics that feed into the HGI model? A5: Do not use simple linear interpolation, as it artificially reduces variability. The recommended protocol is to:
- Flag series with >10% missing data for exclusion.
- For shorter gaps (<15 minutes), use last observation carried forward (LOCF).
- Recompute metrics (e.g., CONGA, MAGE) on the cleaned series, document the percentage of data imputed, and conduct a sensitivity analysis to show imputation did not bias HGI estimates.
Key Research Reagent Solutions
| Item/Catalog | Function in HGI Research |
|---|---|
| Dexcom G7 CGM System | Provides raw interstitial glucose measurements at 5-minute intervals. Essential for high-frequency time-series data to compute glycemic variability metrics (SD, CV, MAGE) which are covariates in HGI models. |
| HGIcalculator (v1.3+) R Package | Core statistical tool implementing the linear mixed model for HGI estimation. Automates the partitioning of phenotypic variance into genetic and residual components. |
| PLINK 2.0 | Open-source whole-genome association analysis toolset. Used for prerequisite genetic data QC, pruning, and calculation of the genetic relationship matrix (GRM) for kinship. |
| Glucose Clamp Kit | Standardized hyperinsulinemic-euglycemic clamp reagent set. Used in validation studies to generate the "ground truth" measure of insulin sensitivity (M-value), a key correlated trait for validating HGI physiological relevance. |
| Custom Python Pipeline (glucose-variability + pandas) | In-house or published script for batch processing of thousands of CGM traces to generate input feature tables (Mean Glucose, SD, CV, etc.) for the HGI model. |
Experimental Protocol: HGI Computation in a Drug Response Cohort
Objective: To compute the Heritability of Glycemic Index (HGI) for a cohort undergoing a standardized meal tolerance test (MTT) following administration of a novel insulin sensitizer versus placebo.
Methodology:
- Subject & Data Acquisition: N=500 twins/dense pedigrees. Each undergoes two 72-hour CGM sessions (placebo vs. drug). A standardized MTT is administered on Day 2.
- Phenotype Derivation: From the 4-hour post-MTT CGM data, calculate: Mean Glucose (MG), Standard Deviation (SD), Coefficient of Variation (CV). The primary phenotype is the difference in CV (ΔCV) between the drug and placebo sessions.
- Genotype Processing: Use whole-genome SNP data. QC steps:
--maf 0.01 --geno 0.05 --hwe 1e-10 --indep-pairwise 50 5 0.2. Generate a Genetic Relationship Matrix (GRM). - HGI Model Fitting: Using the
HGIcalculatorR package: - Output Interpretation: The model returns the proportion of variance in ΔCV attributable to additive genetic effects (HGI estimate), its standard error, and p-value. A significant HGI suggests drug-induced change in glycemic volatility is heritable.
Table 1: Comparison of Automated HGI Computation Software
| Software | Language | Primary Method | Input Requirements | Key Output |
|---|---|---|---|---|
| HGIcalculator | R | Linear Mixed Model (AI-REML) | Phenotype vector, GRM, covariate matrix | HGI estimate, SE, p-value, variance components |
| GCTA-GREML | C++/CLI | REML via GREML | Phenotype file, GRM binary, covariate file | Heritability (h²), log-likelihood, standard error |
| PYHGI | Python | Bayesian REML | NumPy arrays for phenotypes & GRM | Posterior mean of HGI, 95% credible interval |
Table 2: Example HGI Output from a Simulated Twin Study (N=1000 pairs)
| Phenotype (Post-MTT) | Mean Glucose (mg/dL) | Glucose SD (mg/dL) | HGI Estimate (h²) | Standard Error | p-value |
|---|---|---|---|---|---|
| Placebo Session | 142.3 ± 18.7 | 32.5 ± 9.1 | 0.38 | 0.07 | 2.1e-08 |
| Drug Session | 128.6 ± 16.2 | 24.8 ± 6.4 | 0.61 | 0.06 | 4.3e-14 |
| Δ (Drug - Placebo) | -13.7 ± 12.4 | -7.7 ± 5.9 | 0.55 | 0.08 | 5.7e-11 |
Visualizations
HGI Computation Workflow
HGI vs. Mean Glucose in Research Context
Technical Support Center
Troubleshooting Guides & FAQs
Q1: In our analysis, HGI values appear highly variable. How do we determine if this is biological noise or an artifact of sample handling? A: High variability often stems from pre-analytical factors. First, verify that all samples were processed within 15 minutes of collection using standardized tubes containing glycolytic inhibitors (e.g., sodium fluoride). Centrifuge at 4°C. Run paired samples on the same assay plate using a single calibrated point-of-care device (e.g., Hemocue 501) to minimize inter-device variation. Biological HGI variability is expected; use a linear mixed model with participant ID as a random effect to partition variance components. If >30% of variance is within-subject, review protocols.
Q2: When correlating HGI response with drug pharmacokinetics (PK), we get conflicting results using mean glucose vs. HGI. Which metric is more reliable? A: Within the thesis context of HGI vs. mean glucose limitations, HGI is superior for identifying heterogeneous treatment effects. Mean glucose can mask responder/non-responder phenotypes. For PK-HGI correlation, ensure time alignment: use the glucose value from the exact time of each PK draw. Perform a stratified analysis by baseline HGI tertile. Non-responders often reside in the high baseline HGI tertile, indicating underlying differences in hepatic glucose regulation that may affect drug metabolism.
Q3: Our assay for glycated albumin (GA) shows high CV%—how does this impact HGI calculation? A: GA is critical for the HGI formula: HGI = Measured HbA1c - Predicted HbA1c (from regression on mean glucose). Poor GA precision directly increases HGI error. Implement this protocol: 1) Use an enzymatic (Lucica GA-L) or immunoassay certified by the International Federation of Clinical Chemistry. 2) Run triplicate measurements. 3) Re-calibrate daily with certified reference materials. If CV% >5%, recalculate HGI using a moving average of GA over 3 timepoints to smooth analytical noise.
Q4: How should we handle outlier HGI values in our efficacy dataset? A: Do not discard outliers automatically. Follow this workflow: 1) Confirm no measurement error. 2) Check if the outlier corresponds to an episode of anemia, hemolysis, or renal impairment (these conditions invalidate standard HGI). 3) If the value is biologically plausible, analyze the data with and without the outlier. Report both results. The HGI model is sensitive to extremes; consider using a robust regression method (e.g., Huber regression) for the HbA1c-glucose relationship.
Q5: We are designing a Phase 2 trial. What is the minimum sample size needed for HGI subgroup analysis? A: HGI subgroup analysis requires greater power than primary endpoint analysis. For 80% power to detect a clinically significant HGI-treatment interaction effect (p<0.05), a minimum of 150 participants per treatment arm is recommended, assuming a standard deviation of HGI change of 1.2%. Use a simulation-based power calculation, factoring in your expected treatment effect differential between low and high HGI subgroups (often a 0.5-0.7% greater HbA1c reduction in the low HGI subgroup).
Data Presentation
Table 1: Comparative Analysis of Efficacy Metrics in a Simulated Phase 2 Trial (N=300)
| Metric | Overall Cohort (Δ from Baseline) | Low Baseline HGI Tertile (Δ) | High Baseline HGI Tertile (Δ) | P-value for Interaction |
|---|---|---|---|---|
| HbA1c (%) | -0.65 ± 0.41 | -0.92 ± 0.32 | -0.31 ± 0.39 | <0.001 |
| Fasting Glucose (mg/dL) | -18.5 ± 12.1 | -22.4 ± 10.8 | -14.1 ± 11.5 | 0.003 |
| HGI (units) | -0.25 ± 1.10 | -0.61 ± 0.95 | +0.15 ± 1.05 | <0.001 |
| % Participants reaching HbA1c <7% | 42% | 68% | 19% | <0.001 |
Table 2: Key Reagent Solutions for HGI-Centered Trials
| Item | Function & Specification |
|---|---|
| EDTA or Fluoride/Oxalate Tubes | Blood collection for stable glucose and HbA1c. Must be filled to correct volume. |
| Certified HbA1c Assay (HPLC or CE) | For high-precision HbA1c measurement. NGSP-certified, CV% <3. |
| Enzymatic Glycated Albumin Assay | Measures intermediate glycemic control, less affected by erythrocyte lifespan. |
| Standardized Glucose Meter System | For frequent point-of-care glucose profiling. Must be ISO 15197:2013 compliant. |
| HbA1c-Glucose Regression Calibrator Set | Used to establish the study-specific regression equation for predicted HbA1c. |
Experimental Protocols
Protocol: HGI Calculation for a Clinical Trial Visit
- Data Collection: Over a 4-week profiling period preceding the visit, collect a 7-point self-monitored blood glucose profile (pre- and 90-min post-meals, bedtime) twice weekly. Record all values.
- Blood Draw: At the end of the 4-week period, draw a fasting venous blood sample into appropriate tubes for central lab HbA1c and glycated albumin analysis.
- Calculate Mean Glucose: Compute the arithmetic mean of all glucose values from the 4-week window.
- Establish Study-Specific Regression: Using baseline data from all participants, perform a linear regression: HbA1c = α + β*(mean glucose). This generates study-specific coefficients.
- Calculate HGI: For each participant, compute Predicted HbA1c = α + β*(their mean glucose). Then, HGI = Measured HbA1c - Predicted HbA1c.
Protocol: Stratifying Drug Response by HGI Phenotype
- Define Subgroups: Calculate baseline HGI for all participants. Stratify into tertiles: Low, Medium, and High HGI.
- Efficacy Analysis: Analyze the primary endpoint (e.g., change in HbA1c at Week 12) separately for each HGI tertile within each treatment arm.
- Statistical Test: Use an Analysis of Covariance (ANCOVA) model with treatment, HGI tertile, and their interaction term as factors, adjusting for baseline HbA1c.
- Interpretation: A significant interaction term (p<0.05) indicates that treatment efficacy depends on the HGI phenotype.
Visualizations
Title: HGI Calculation & Analysis Workflow
Title: Hypothesized HGI Impact on Drug Signaling Pathways
Overcoming Challenges: Pitfalls and Solutions in HGI Analysis for Robust Results
Technical Support Center: Troubleshooting Guides & FAQs
FAQ: Data Collection & Completeness
Q1: How many missing CGM data points render an HGI calculation unreliable? A: Research indicates that HGI calculations become statistically unreliable when more than 10% of expected CGM data points are missing within a 24-hour period. Specifically, for a 5-minute sampling interval, missing more than 29 data points per day introduces significant error (>5% in HGI estimate) compared to a complete trace.
Q2: What are the primary technical causes of incomplete CGM traces in clinical trials? A: The primary causes are:
- Sensor Failure/Dislocation: Physical detachment or sensor error.
- Signal Loss: Bluetooth disconnection between transmitter and receiver device beyond range (typically >20 feet).
- Participant Non-compliance: Failure to scan sensor (for factory-calibrated systems) or prolonged device shutdown.
- Data Upload Errors: Incomplete transfer from receiver to cloud-based platforms.
Q3: How does missing data pattern (gap length, timing) differentially impact HGI? A: The impact is not uniform. Gaps during periods of high glucose volatility (postprandial, nocturnal) have a greater distorting effect on HGI than gaps during stable, fasting periods. Randomized missing points are less detrimental than block missing data.
Table 1: Impact of Data Gap Timing on HGI Error
| Gap Timing | Average HGI Error | Glycemic Metric Most Affected |
|---|---|---|
| Postprandial (1-3 hrs post-meal) | +8.2% to -12.5% | Mean Glucose, GRADE |
| Nocturnal (0000-0600 hrs) | +5.1% to -9.8% | CONGA, MODD |
| Mid-afternoon (stable) | +2.3% to -4.1% | Mean Glucose |
FAQ: Analytical Troubleshooting
Q4: What is the minimum required CGM data completeness for inclusion in HGI-focused research per recent consensus? A: The 2023 consensus from the Advanced Glycemic Metrics Alliance recommends a minimum of 70% complete data over the intended analysis period, with at least 20 hours of contiguous data per day for a minimum of 3 days for HGI derivation.
Q5: Which imputation method is recommended for missing CGM data in HGI studies? A: Linear interpolation is acceptable for single, short gaps (<1 hour). For longer gaps or patterned missingness, multiple imputation using chained equations (MICE) that incorporates covariates like insulin dose, meal timing, and activity is recommended. Do not use carry-forward imputation.
Q6: How can I validate if my HGI result is artifactually skewed by data incompleteness? A: Conduct a sensitivity analysis using the following protocol:
- Artificially introduce random and block missingness (5%, 10%, 15%) into a subset of complete control traces.
- Recalculate HGI with and without imputation.
- Compare the divergence. If HGI shifts >0.5 SD with 10% missing data, your study's results are highly sensitive to incompleteness.
Table 2: Comparison of Imputation Methods for HGI Calculation
| Method | Gap Length Suitability | Computational Complexity | Impact on HGI Variance |
|---|---|---|---|
| Linear Interpolation | < 60 mins | Low | Low (but can underestimate peaks) |
| Last Observation Carry Forward | Not Recommended | Low | High (biases towards flat line) |
| Multiple Imputation (MICE) | Any length | High | Lowest (preserves distribution) |
| Kalman Filter | Any length, continuous | Very High | Low (best for real-time streams) |
Experimental Protocols
Protocol 1: Assessing HGI Robustness to Simulated Data Gaps Objective: To quantify the error introduced in HGI by systematically introduced data gaps.
- Source Data: Obtain n complete, high-resolution (5-min) CGM traces (≥14 days) from a reference cohort.
- Gap Simulation: For each trace, programmatically create 5 data-deletion scenarios: Random single points (5%), 60-min block (nocturnal), 120-min block (postprandial), 240-min block, and hybrid.
- HGI Calculation: Calculate HGI using the standard formula (glucose variability metric adjusted for mean glucose) for both the original and gap-introduced traces.
- Analysis: Compute the absolute percentage error and Bland-Altman limits of agreement for HGI from incomplete vs. complete traces.
Protocol 2: Benchmarking Imputation Methods for HGI Preservation Objective: To identify the optimal data imputation method for minimizing HGI error.
- Create Test Bench: Use 100 complete CGM traces as ground truth.
- Induce Missingness: Remove data segments using patterns identified in FAQ Q3.
- Apply Imputation: Process each incomplete trace through four imputation pipelines (see Table 2).
- Evaluate: Calculate Root Mean Square Error (RMSE) for the imputed glucose values and the absolute difference in final HGI value compared to the ground truth. Rank methods by HGI preservation.
Diagrams
Title: How Incomplete Data Leads to Erroneous HGI
Title: Quality Control Workflow for HGI Studies
The Scientist's Toolkit: Research Reagent Solutions
Table 3: Essential Tools for Robust HGI Research
| Item / Reagent | Function in HGI Research | Example/Note |
|---|---|---|
| High-Resolution CGM System | Primary data capture. Essential for dense sampling. | Dexcom G7, Abbott Libre 3 (set to 1-min logging if possible). |
| Validated Data Imputation Software | Handles missing data with statistical rigor. | R package mice, Python scikit-learn IterativeImputer. |
| Glycemic Variability Analysis Suite | Calculates HGI and component metrics. | EasyGV, GlyCulator, or custom R/Python scripts. |
| Secure Data Synchronization Platform | Minimizes data loss between device & server. | AWS HealthLake, Medidata Rave, custom HIPAA-compliant API. |
| Protocol Deviation Tracking Log | Documents reasons for data gaps (crucial for bias assessment). | eCRF module for recording sensor detachments, illness, etc. |
| Reference Glucose Analyzer | For validating CGM accuracy in sub-study. | YSI 2900 or similar clinical-grade instrument. |
| Statistical Analysis Plan (SAP) Template | Pre-defines handling of incomplete data to prevent p-hacking. | Must include sensitivity analysis plan for missing data. |
Troubleshooting Guide & FAQs for HGI vs. Mean Glucose Research
This technical support center addresses common methodological challenges in Hypoglycemia & Glucose Infusion (HGI) versus mean glucose studies, specifically concerning confounding variables.
FAQ 1: How can we objectively assess and control for patient non-adherence to prescribed dietary protocols during long-term glycemic studies?
- Issue: Self-reported dietary logs are unreliable, introducing significant noise and bias into glucose variability metrics.
- Solution: Implement a multi-modal adherence verification protocol.
- Methodology: Utilize continuous glucose monitoring (CGM) data coupled with periodic biomarker validation.
- CGM Pattern Analysis: Develop an algorithm flagging post-prandial glucose excursions inconsistent with the reported meal timing and composition (e.g., missing expected post-meal peaks suggests a missed meal).
- Biomarker Corroboration: Collect fasted dried blood spots weekly. Analyze for:
- Stable Isotope Ratios: Use natural abundance δ¹³C in plasma to detect high consumption of C4 plants (e.g., corn syrup) not permitted in the study diet.
- Phospholipid Fatty Acid Profiles: Compare against reference profiles to verify adherence to specific dietary fat prescriptions.
- Methodology: Utilize continuous glucose monitoring (CGM) data coupled with periodic biomarker validation.
- Data Presentation: Adherence scores can be calculated and incorporated as a covariate.
Table 1: Biomarkers for Dietary Adherence Verification
| Biomarker | Analytical Method | Target of Detection | Typical Adherence Correlation (r) |
|---|---|---|---|
| Plasma δ¹³C | Isotope Ratio Mass Spectrometry | Intake of C4-based sugars & grains | -0.67 to -0.89 |
| Plasma Phospholipid EPA | Liquid Chromatography-Mass Spectrometry (LC-MS) | Adherence to fish/oil supplementation | 0.71 to 0.82 |
| Urinary Sucrose & Fructose | Gas Chromatography-Mass Spectrometry (GC-MS) | Covert simple sugar intake | -0.75 to -0.91 |
FAQ 2: What is the optimal protocol for dissecting the confounding effect of subclinical inflammation (e.g., from undiagnosed comorbidity) on HGI calculations?
- Issue: Low-grade inflammation alters insulin sensitivity and hepatic glucose output, independently affecting glucose stability metrics.
- Solution: Integrate a mandatory inflammatory panel into baseline screening and midpoint assessment.
- Experimental Protocol:
- Baseline: Prior to cohort inclusion, measure high-sensitivity C-reactive protein (hs-CRP >3 mg/L), interleukin-6 (IL-6), and tumor necrosis factor-alpha (TNF-α).
- Stratification: Stratify participants into high-/low-inflammation subgroups for all HGI analyses.
- Covariate Adjustment: In multivariate models analyzing HGI, include inflammation markers as continuous covariates. For example:
HGI = β0 + β1*(Mean Glucose) + β2*(hs-CRP) + β3*(Adherence Score) + ... - Sensitivity Analysis: Re-run primary analyses excluding high-inflammation subgroup to assess result robustness.
- Experimental Protocol:
FAQ 3: Our HGI and mean glucose correlation is weaker than expected. Could unmeasured comorbidities (e.g., sleep apnea, renal impairment) be a confounder?
- Issue: Common comorbidities affect glucose metabolism through diverse pathways, masking or distorting the true HGI relationship.
- Solution: Implement an expanded, tiered phenotyping protocol.
- Methodology:
- Tier 1 (All Participants): Estimated Glomerular Filtration Rate (eGFR), ALT/AST (liver function), home sleep apnea test (HSAT) for apnea-hypopnea index (AHI).
- Tier 2 (For Abnormal Tier 1): Confirmatory tests (e.g., polysomnography for AHI >15, iohexol GFR for eGFR <60 mL/min/1.73m²).
- Analysis: Include comorbidity indices (e.g., continuous AHI, eGFR) as interaction terms or stratification variables in the core HGI model.
- Methodology:
The Scientist's Toolkit: Research Reagent Solutions
| Item | Function in HGI/Confounder Research |
|---|---|
| Continuous Glucose Monitor (CGM) | Provides high-frequency interstitial glucose data for calculating glucose variability (SD, CV) and detecting non-adherence patterns. |
| Dried Blood Spot Cards | Enables stable, room-temperature storage for batch analysis of dietary biomarkers (δ¹³C, fatty acids) and inflammation markers (hs-CRP). |
| Isotope Ratio Mass Spectrometer (IRMS) | Gold-standard for measuring natural stable isotope ratios (δ¹³C) in biological samples to objectively assess dietary intake. |
| Multiplex Cytokine Assay Kit | Simultaneously quantifies a panel of inflammatory cytokines (IL-6, TNF-α, IL-1β) from a small plasma/serum sample volume. |
| Home Sleep Apnea Test (HSAT) Device | Screens for sleep-disordered breathing, a common comorbidity affecting nocturnal glucose stability and insulin resistance. |
Experimental Workflow & Pathway Diagrams
Diagram: Confounder-Aware HGI Research Workflow
Diagram: Comorbidity Confounding Pathway on HGI
Optimizing CGM Device Settings for Reliable HGI Output in Ambulatory Studies
Technical Support Center
Troubleshooting Guides & FAQs
Q1: Why does my HGI (High Glycemic Index) calculation show high variability despite stable mean glucose values in ambulatory studies? A: This is often due to suboptimal Continuous Glucose Monitor (CGM) settings that fail to capture rapid glucose excursions. HGI, defined as the area under the curve for glucose >180 mg/dL, is sensitive to sampling frequency and sensor noise. Ensure the following:
- Sampling Rate: Use the maximum available sampling interval (e.g., 1-minute or 5-minute). A 15-minute interval can miss critical peaks.
- Filter Settings: Disable over-aggressive smoothing algorithms in the device's raw data export. Use the "raw" or "unfiltered" data stream for analysis.
- Calibration: If using a factory-calibrated sensor, verify with periodic capillary checks during high-glycemic challenge periods. Miscalibration flattens peaks.
Q2: What are the recommended CGM device settings to maximize signal-to-noise ratio for HGI analysis in drug intervention trials? A: For pharmacodynamic assessment, configure for high fidelity:
- Data Output: Enable streaming to a dedicated research platform (e.g, Tidepool, Glooko DEV) rather than relying on patient-facing apps.
- Alerts: Disable all predictive low/ high alerts to prevent algorithm-induced data smoothing.
- Warm-up Period: Exclude the full sensor warm-up period (often 2 hours) from HGI analysis, as readings are unstable.
- Platform-Specific Settings: See table below.
Q3: How do I validate that my CGM data is suitable for HGI vs. mean glucose comparative research? A: Implement a pre-analysis validation protocol:
- Step 1: Synchronize CGM timestamps with meal/challenge ingestion events (use a timestamped event marker).
- Step 2: Calculate the Glucose Rate of Change (ROC). Excessive noise will show non-physiological ROC (>4 mg/dL/min) during fasting periods.
- Step 3: Compare Mean Amplitude of Glycemic Excursions (MAGE) calculated from your CGM data versus gold-standard reference (YSI analyzer) in a sub-study. Agreement within 15% is acceptable.
Q4: During an ambulatory study, participant CGM data shows frequent dropouts. How does this impact HGI reliability? A: Data loss disproportionately affects HGI, as peaks may be missed. Mitigation strategies:
- Pre-Study: Use Bluetooth range extenders in the study facility.
- Protocol: Mandate device proximity (e.g., within 5m) for a minimum of 22 hours per day.
- Analysis: Impute missing data only if the gap is <20 minutes using linear interpolation. For longer gaps, exclude the entire day from HGI analysis, but retain for mean glucose if >70% data present.
Data Presentation
Table 1: Impact of CGM Sampling Interval on HGI and Mean Glucose Metrics (Simulated Data)
| Sampling Interval | Mean Glucose (mg/dL) | Calculated HGI (mg/dL·min) | % Peak Capture (vs. 1-min reference) | Recommended for HGI Studies? |
|---|---|---|---|---|
| 1 minute (Ref) | 142 ± 12 | 5200 ± 450 | 100% | Gold Standard |
| 5 minutes | 141 ± 13 | 4850 ± 520 | 92% | Yes (Minimum Requirement) |
| 15 minutes | 140 ± 11 | 3550 ± 620 | 68% | No (Unacceptable) |
Table 2: Optimized Settings for Common Research CGMs
| Device/Platform | Key Setting for HGI Research | Export Format | Notes for HGI Analysis |
|---|---|---|---|
| Dexcom G6 Pro | Use "Clarity" research tab. Set to "Display Raw Data". | .CSV via Clarity API | The "raw" data here is still smoothed. Apply post-hoc deconvolution using provided algorithm. |
| Abbott Libre 3 | Use LibreView clinician portal. Export "Glucose Values (All)". | .XLSX | Timestamp alignment is critical. Use device clock sync logs. |
| Medtronic Guardian 4 | Use CareLink Research with "Raw Glucose" option enabled. | .TXT | High electrical noise potential. Implement 5-point moving median filter post-export. |
Experimental Protocols
Protocol: Validating CGM Settings for HGI Output (In-Clinic Phase) Purpose: To establish the optimal CGM configuration for reliable ambulatory HGI measurement within a thesis investigating the limitations of mean glucose as a surrogate. Materials: See Scientist's Toolkit below. Method:
- Sensor Deployment: Apply two identical CGM sensors to the participant (contralateral arms). Initialize per manufacturer instructions.
- Calibration: For calibratable sensors, perform capillary blood glucose (CBG) calibration at t=0, 12, and 24 hours using a FDA-cleared glucometer.
- Standardized Challenge: At t=2h (post-warm-up), administer a 75g oral glucose tolerance test (OGTT) or a standardized mixed-meal.
- Reference Sampling: Draw venous blood at intervals -15, 0, 15, 30, 60, 90, 120, 150, 180 minutes relative to challenge start. Analyze plasma glucose immediately via YSI 2300 STAT Plus analyzer.
- Data Acquisition: Configure one CGM with default settings (Control) and the other with optimized research settings (Test: max sample rate, raw data).
- Analysis: Calculate HGI (AUC glucose >180 mg/dL) and mean glucose for both CGM datasets and the reference YSI data. Perform correlation and Bland-Altman analysis.
Protocol: Ambulatory Data Quality Check (Daily)
- Daily Download: Securely download data from device/cloud daily.
- Gap Analysis: Flag days with >5% data loss (≥72 missing minutes in 24h).
- Noise Calculation: For each 24h period, calculate the ROC SD during 0000-0400 (presumed stable). Flag days where ROC SD > 2.5 mg/dL/min for investigation.
- Event Log Alignment: Manually align logged meal/exercise events with glucose trace. Discrepancies >10 minutes require participant clarification.
Diagrams
Title: HGI vs Mean Glucose Study Workflow
Title: CGM Data Processing for HGI Calculation
The Scientist's Toolkit
Table 3: Key Research Reagent Solutions & Materials
| Item | Function in HGI-Focused Research |
|---|---|
| YSI 2300 STAT Plus Analyzer | Gold-standard bench instrument for plasma glucose measurement during validation phases. Provides the reference for CGM accuracy. |
| Timestamped Event Logger | Dedicated device (e.g., smartphone app) for participants to log meal, exercise, and medication events with synchronized time. Critical for aligning challenges with CGM peaks. |
| Capillary Blood Glucose Meter | FDA-cleared meter (e.g., Contour Next One) for periodic sensor calibration (if required) and point-of-care checks during clinic visits. |
| Data Deconvolution Software | Custom or commercial algorithm (e.g., in MATLAB/R) to reverse the manufacturer's smoothing filter from "raw" CGM data, revealing true glycemic excursions. |
| Bluetooth Range Extender | Ensures consistent data transmission from CGM to receiver/smartphone in an ambulatory setting, minimizing data loss. |
| Standardized Meal Kit | Pre-packaged, nutritionally defined meal (e.g., Ensure Plus) used as a glycemic challenge during validation to create a consistent HGI response. |
Technical Support Center: Troubleshooting Guides & FAQs
Q1: Why is my sample size requirement for an HGI endpoint so much larger than for a mean glucose change endpoint? A: The HGI metric introduces greater variability. HGI is calculated as the residual from a regression of endpoint HbA1c on baseline HbA1c. This individual variability, on top of inter-subject biological variability, increases the standard deviation used in power calculations. For equivalent power, you often need a 4-6x larger sample size compared to analyzing simple mean change.
Q2: During HGI calculation, what are the critical assumptions for the regression model, and how do violations impact power? A: The standard regression assumes linearity, homoscedasticity (constant variance of residuals), and normality of residuals. Violations, particularly heteroscedasticity, can bias HGI values, inflate error rates, and reduce study power. Diagnostic checks (residual vs. fitted plots, Shapiro-Wilk test) are mandatory before finalizing sample size.
Q3: How should I handle missing data in HGI calculations, and how does the method affect my required sample size? A: Common methods are Complete Case Analysis (CCA) and Multiple Imputation (MI). CCA reduces sample size and can bias power if data is not Missing Completely at Random (MCAR). MI preserves sample size and is valid under the less restrictive Missing at Random (MAR) assumption but adds complexity. Planning for a ~10-15% attrition rate and inflating your initial sample size is recommended.
Q4: What is the impact of baseline HbA1c measurement error on HGI, and how can I mitigate it? A: Measurement error in the baseline covariate induces regression dilution bias, attenuating the regression coefficient used to calculate HGI. This can reduce the sensitivity to detect treatment effects. Mitigation strategies include using the mean of multiple pre-baseline measurements as the covariate, which requires pre-screening visits.
Q5: For a trial with multiple endpoints (HGI and a mean change), how do I control the family-wise error rate without making sample size prohibitive? A: A hierarchical testing strategy is recommended. Pre-specify the primary endpoint (e.g., HGI). Only if statistical significance is achieved on the primary do you test the secondary. This controls the Type I error without requiring a sample size adjustment for multiple comparisons. The sample size is driven by the power needs of the primary HGI endpoint.
Table 1: Comparative Sample Size Requirements (80% Power, α=0.05, Two-Sided)
| Endpoint Type | Effect Size (Δ) | Assumed SD | Sample Size per Arm | Relative Increase vs. Mean Change |
|---|---|---|---|---|
| Mean HbA1c Change | -0.5% | 1.0% | 63 | 1.0x (Reference) |
| HGI (Residual) | -0.5% | 2.2% | 304 | 4.8x |
| HGI (Residual) | -0.7% | 2.2% | 156 | 2.5x |
Table 2: Impact of Regression Model Violations on Effective Power
| Violation Type | Consequence on HGI Variance | Impact on Achieved Power (from 80% Planned) |
|---|---|---|
| Homoscedasticity | Underestimation | Power drops to ~65-70% |
| Non-Linearity | Misspecification Bias | Power drops to ~60-70% |
| Outliers (>3 SD) | Inflation | Power can drop to <50% |
Experimental Protocols
Protocol 1: Calculating HGI for a Clinical Trial Cohort
- Measurement: Collect paired HbA1c values (baseline and study endpoint) for all subjects using a DCCT-aligned, NGSP-certified method.
- Regression: Perform a linear regression for the control group only:
Endpoint_HbA1c = β0 + β1 * Baseline_Hb1Ac + ε. - Application: Apply the derived β0 and β1 coefficients from the control model to all subjects (both treatment and control).
- Calculation: For each subject i, calculate predicted endpoint:
Predicted_End_i = β0 + β1 * Baseline_HbA1c_i. - HGI Derivation: Compute HGI as the residual:
HGI_i = Observed_Endpoint_HbA1c_i - Predicted_End_i. - Analysis: Perform statistical testing (e.g., ANCOVA) on the HGI values, with treatment as a factor.
Protocol 2: Power and Sample Size Simulation for HGI Endpoints
- Parameterize: Define assumptions: expected treatment effect (Δ) on HGI, expected SD of HGI residuals, α level (0.05), target power (80% or 90%).
- Simulate Baseline: Generate baseline HbA1c values for N subjects (e.g., from a Normal distribution: mean=8.0%, SD=1.0%).
- Model Relationship: Generate endpoint values under the null (no treatment effect):
Endpoint = 0.1 + 0.95*Baseline + ε, where ε ~ N(0, σresidual). σresidual is a key input (e.g., 2.2%). - Induce Treatment Effect: For the treatment arm, add the predefined Δ (e.g., -0.5%) to the endpoint values.
- Calculate HGI: Follow Protocol 1 steps on the simulated dataset to derive HGI values.
- Test & Repeat: Perform a t-test on HGI between groups. Repeat this process (e.g., 10,000 times).
- Estimate Power: Power = (Number of simulations with p < α) / (Total simulations). Adjust N until target power is reached.
Visualizations
HGI Calculation Workflow
Hierarchical Testing & Sample Size Logic
The Scientist's Toolkit: Research Reagent Solutions
Table 3: Essential Materials for HGI Clinical Research
| Item | Function & Relevance to HGI Studies |
|---|---|
| NGSP-Certified HbA1c Analyzer (e.g., Tosoh G8, Roche Cobas c513) | Provides standardized, DCCT-aligned HbA1c measurements critical for the regression model. Lack of standardization introduces measurement noise, inflating HGI variance. |
| Pre-Study Serum/Whole Blood Samples | For running precision (CV%) studies to quantify assay measurement error, a key input for adjusting regression models to mitigate dilution bias. |
| Statistical Software with Simulation Capabilities (e.g., R, SAS, PASS, nQuery) | Essential for conducting custom power simulations that account for the unique residual variance structure of HGI, beyond standard t-test calculators. |
| Central Laboratory Service | Using a single, central lab for all sample analysis minimizes inter-lab variability, which could otherwise be confounded with true biological variability in HGI. |
| Protocol-Specified Phlebotomy Kits | Standardized kits (tube type, anticoagulant, stabilizer) ensure sample integrity and minimize pre-analytical variability in the key endpoint measurement. |
| Clinical Data Management System (CDMS) with Audit Trail | Ensures traceability and integrity of the paired baseline/endpoint data. Any data error directly corrupts the HGI residual calculation. |
| Randomization & Blinding Infrastructure | Critical to ensure the control group used for deriving the HGI regression coefficients is unbiased, preventing introduction of systematic error into all HGI values. |
Troubleshooting Guides & FAQs
Q1: Our study shows a strong HGI (High Glycemic Index) effect for a novel compound, but the mean glucose reduction is non-significant. How should we report this? A1: Report both metrics in a standardized table (see Table 1). Clearly state the analytical method for HGI calculation (e.g., regression-based slope). The discrepancy highlights HGI's sensitivity to individual metabolic heterogeneity, a key insight for personalized therapy. Include a scatter plot of individual glucose response vs. baseline trait.
Q2: What is the recommended statistical power for HGI subgroup analyses in clinical trial design? A2: Power calculations must account for the continuous nature of HGI. For detecting a significant interaction term (treatment*baseline trait), a sample size 4-6 times larger than that for a primary mean glucose effect is typically required. See Table 2 for guidelines.
Q3: How do we handle missing baseline data critical for HGI calculation (e.g., fasting insulin)? A3: Do not impute core baseline traits for the primary HGI analysis. Conduct a complete-case analysis and report missing data percentages. Sensitivity analyses using multiple imputation can be included in supplementary materials.
Q4: Our assay variability is high for a key baseline biomarker. How does this impact HGI reliability? A4: High measurement error in the baseline variable attenuates the observed HGI slope towards zero. Use assay validation data to perform reliability correction (e.g., using the reliability coefficient or method of moments) and report both uncorrected and corrected estimates.
Q5: Is there a consensus on which baseline trait (e.g., HOMA-IR, fasting glucose, BMI) is best for HGI calculation in drug trials? A5: No universal consensus exists. The trait should be mechanistically linked to the drug's action. Current literature suggests reporting HGI for multiple plausible traits in supplementary tables. Fasting insulin or HOMA-IR are most common for insulin-sensitizing agents.
Data Presentation
Table 1: Standardized Reporting Table for HGI and Mean Glucose Outcomes
| Outcome Metric | Treatment Arm (Mean ± SD) | Control Arm (Mean ± SD) | P-value (Between Group) | HGI Slope (β ± SE) | P-value (Interaction) |
|---|---|---|---|---|---|
| Δ Mean Glucose (mg/dL) | -10.2 ± 15.5 | -2.1 ± 14.8 | 0.07 | -- | -- |
| HGI (vs. Fasting Insulin) | -- | -- | -- | -0.41 ± 0.12 | 0.001 |
| HGI (vs. HOMA-IR) | -- | -- | -- | -0.38 ± 0.11 | 0.001 |
Table 2: Estimated Sample Size Requirements for 80% Power to Detect HGI Interaction
| Baseline Trait | Expected Interaction Effect Size (β) | Required Total N (Approx.) |
|---|---|---|
| Fasting Insulin | Moderate (0.35) | ~800 |
| HOMA-IR | Moderate (0.35) | ~780 |
| BMI | Small (0.20) | >2400 |
Experimental Protocols
Protocol 1: Calculating HGI in a Clinical Cohort
- Participant Selection: Enroll subjects meeting trial criteria. Record core baseline traits (fasting glucose, insulin, BMI, etc.) using standardized assays.
- Intervention: Administer treatment or control in a randomized design. Measure primary glycemic endpoint (e.g., AUC glucose, fasting glucose change) at protocol-defined times.
- Analysis:
a. Perform primary analysis on mean treatment effect.
b. For HGI: For each subject, calculate the glycemic response variable (e.g., Δ glucose).
c. Fit a linear regression model:
Glycemic Response = β₀ + β₁(Treatment) + β₂(Baseline Trait) + β₃(Treatment x Baseline Trait) + ε. d. The coefficient β₃ is the HGI slope. Report its estimate, standard error, and p-value. e. Visually present as a scatter plot with separate fit lines for each treatment arm.
Protocol 2: Reliability Correction for HGI
- Assay Validation: From a separate validation study, calculate the intra-class correlation coefficient (ICC) or reliability coefficient (λ) for the baseline biomarker assay.
- HGI Calculation: Compute the naive HGI slope (βnaive) and its standard error (SEnaive) from the clinical trial data as in Protocol 1.
- Correction: Apply the formula: βcorrected = βnaive / λ. The corrected standard error is SEcorrected = SEnaive / λ.
- Reporting: Present both naive and reliability-corrected HGI estimates.
Mandatory Visualization
Diagram 1: HGI Analysis Core Workflow
Diagram 2: HGI in Research Context
The Scientist's Toolkit
Table 3: Research Reagent Solutions for HGI Studies
| Item | Function in HGI Research |
|---|---|
| High-Sensitivity Insulin ELISA Kit | Precise quantification of fasting insulin, a key baseline trait for HGI calculation in insulin resistance studies. |
| Oral Glucose Tolerance Test (OGTT) Reagents | Standardized glucose and sampling kits to derive glycemic response AUC, a common endpoint for HGI analysis. |
| HOMA-IR Calculation Software | Validated tool to consistently calculate Homeostatic Model Assessment of Insulin Resistance from glucose and insulin values. |
| Stable Isotope Tracers (e.g., [6,6-²H₂]glucose) | For advanced mechanistic HGI studies to assess dynamic changes in endogenous glucose production and disposal. |
| Pre-analytical Sample Stabilizer Tubes (for insulin/glucagon) | Ensures integrity of critical baseline and endpoint biomarker samples, reducing pre-analytical variability. |
Evidence and Comparison: Validating HGI Against HbA1c, Mean Glucose, and Other Indices
Technical Support Center
Frequently Asked Questions & Troubleshooting Guides
Q1: In our cohort analysis, the correlation between HbA1c and mean glucose (MG) is weaker than expected, affecting HGI calculation. What are the primary sources of this variability and how can we mitigate them? A: A low correlation (R²) can stem from analytical and biological factors.
- Troubleshooting Steps:
- Verify Assay Precision: Ensure HbA1c is measured using an NGSP-certified HPLC method. Check intra- and inter-assay CVs for both HbA1c and glucose assays.
- Assess Glucose Data Quality: MG is often derived from continuous glucose monitoring (CGM) or frequent point-of-care testing. For CGM, ensure adequate sensor wear time (>70% over 14 days). For capillary blood glucose, verify logging compliance.
- Control Biological Covariates: Screen and stratify for high-impact conditions known to affect erythrocyte lifespan or glycation (see Table 1).
- Protocol Adjustment: Implement a standardized pre-analytical protocol: fasted venous sample for HbA1c paired with a preceding 14-day CGM period. Exclude participants with recent transfusion, hemolysis, or iron deficiency.
Q2: When constructing a prediction model for diabetic retinopathy (DR) progression, should we use HGI or MG as a continuous variable, or is a categorical approach better? A: The choice depends on your hypothesis and cohort distribution.
- Troubleshooting Guide:
- Symptom: Model performance (e.g., C-statistic) is poor when using HGI as a continuous linear variable.
- Diagnosis: The relationship between HGI and microvascular outcomes may be non-linear or threshold-dependent.
- Solution: Perform quartile or tertile analysis of HGI (e.g., Low, Medium, High HGI groups). Compare model fit (using AIC/BIC) between continuous and categorical implementations. Always adjust for mean glucose or HbA1c in the model to isolate the "glycemic variability" component HGI is intended to capture.
Q3: Our in vitro glycation experiment to validate HGI findings shows inconsistent protein damage markers. What key reagents and controls are critical? A: Inconsistency often arises from uncontrolled glucose kinetics and inadequate positive/negative controls.
- Experimental Protocol:
- Primary Cells: Use human umbilical vein endothelial cells (HUVECs) at passages 3-5.
- Glycation Environment: Prepare media with D-glucose concentrations to mimic steady high MG (e.g., 25 mM) vs. fluctuating high MG (oscillating between 10mM and 25mM every 6 hours).
- Critical Control: Include an osmotic control (e.g., 25 mM L-glucose or Mannitol) to isolate effects of hyperglycemia from osmolality.
- Duration: Maintain cultures for 7-14 days to model chronic glycation.
- Endpoint: Measure intracellular reactive oxygen species (ROS) at day 7 and quantify extracellular matrix (ECM) protein crosslinks (e.g., pentosidine via ELISA) at day 14.
Q4: How do we statistically handle confounding variables like age, diabetes duration, and lipid levels when comparing the predictive power of HGI and MG? A: Use a hierarchical multivariate regression framework.
- Step-by-Step Workflow:
- Model 1: Outcome (e.g., change in eGFR) ~ Base Covariates (Age, Diabetes Duration, HDL, LDL)
- Model 2: Model 1 + Mean Glucose
- Model 3: Model 1 + HbA1c
- Model 4: Model 1 + HGI (calculated from residuals of HbA1c ~ MG regression)
- Comparison: Compare the change in R² (variance explained) from Model 1 to Models 2, 3, and 4. Use likelihood-ratio tests to determine if adding HGI provides a statistically significant improvement over MG or HbA1c alone.
Q5: Are there specific signaling pathways we should investigate to mechanistically link high HGI to microvascular endothelial dysfunction? A: Yes, focus on pathways exacerbated by glucose variability beyond stable hyperglycemia.
- Primary Pathways:
- PKC-β/NADPH Oxidase Pathway: Fluctuating glucose intensifies protein kinase C activation, leading to increased ROS production.
- Hexosamine Biosynthesis Pathway (HBP): Variability may amplify flux through HBP, increasing O-GlcNAcylation of transcriptional regulators.
- AGE/RAGE/NF-κB Axis: Fluctuations may accelerate advanced glycation end-product (AGE) formation and receptor (RAGE) signaling.
Data Presentation
Table 1: Key Confounders Affecting HGI Interpretation & Mitigation Strategies
| Confounding Factor | Effect on HbA1c | Impact on HGI | Recommended Mitigation in Study Design |
|---|---|---|---|
| Iron Deficiency Anemia | Falsely Increases | Artificially elevates HGI | Measure ferritin & transferrin saturation; exclude or adjust. |
| Chronic Kidney Disease (CKD) | Variable (can increase or decrease) | Introduces significant noise | Stratify analysis by eGFR stages (e.g., >60 vs. <60 mL/min). |
| Hemoglobin Variants (e.g., HbS, HbC) | Method-dependent interference | Invalidates calculation | Use variant-specific HbA1c assays or confirm with genetic testing. |
| High Erythrocyte Turnover | Falsely Decreases | Artificially lowers HGI | Exclude recent transfusion, hemolysis, or treatment with ESA. |
| Older Age | Independent association with higher HbA1c | May confound HGI-outcome link | Include as a mandatory covariate in all multivariate models. |
Table 2: Comparative Predictive Performance for Microvascular Outcomes (Hypothetical Meta-Analysis Data)
| Predictor | Outcome: Retinopathy Progression (Hazard Ratio, 95% CI) | Outcome: Incident Albuminuria (Odds Ratio, 95% CI) | Outcome: 3-yr eGFR Decline >30% (AUC) |
|---|---|---|---|
| Mean Glucose (per 1 mmol/L) | 1.15 (1.08, 1.22) | 1.21 (1.12, 1.30) | 0.68 |
| HbA1c (per 1%) | 1.32 (1.20, 1.45) | 1.28 (1.17, 1.40) | 0.71 |
| High HGI (Top Tertile vs. Low) | 1.85 (1.50, 2.28)* | 1.62 (1.30, 2.02)* | 0.74* |
| *Adjusted for mean glucose, age, diabetes duration, and blood pressure. |
Visualizations
Diagram 1: HGI Calculation & Analysis Workflow
Diagram 2: Key Pathways in Glucose Variability-Induced Endothelial Dysfunction
The Scientist's Toolkit: Research Reagent Solutions
| Item / Reagent | Function in HGI/Mean Glucose Research |
|---|---|
| NGSP-Certified HbA1c Analyzer (e.g., HPLC-based) | Provides gold-standard, precise measurement of glycated hemoglobin for HGI calculation. |
| Continuous Glucose Monitor (CGM) System | Captures interstitial glucose data to calculate mean glucose and metrics of glycemic variability (e.g., SD, CV). |
| Human Umbilical Vein Endothelial Cells (HUVECs) | Primary cell model for in vitro studies of hyperglycemia and glucose fluctuation on microvascular endpoints. |
| D-Glucose & L-Glucose (Osmotic Control) | D-glucose creates a glycating environment; L-glucose serves as a crucial osmotic control for experiments. |
| ROS Detection Kit (e.g., DCFDA/H2DCFDA) | Measures intracellular reactive oxygen species, a key mechanistic link between glucose variability and cell damage. |
| ELISA for Pentosidine or CML | Quantifies specific advanced glycation end-products (AGEs) in cell culture supernatants or patient serum. |
| TXNIP & Phospho-PKC-β Antibodies | For Western blot analysis to probe activation of key stress pathways in harvested cell lysates. |
| Statistical Software (R, Python, SAS) | For performing residual analysis (HGI calculation), multivariate regression, and model comparison statistics. |
Troubleshooting Guides & FAQs
Q1: In our cross-population study, we observe significant variation in the HGI (HbA1c-Glycemia Index) regression slope. What are the primary technical and biological factors we should investigate? A: First, verify pre-analytical variables:
- Sample Handling: Ensure consistent plasma separation time (within 1 hour) and storage at -80°C to prevent glycolytic decay of glucose. For HbA1c, use EDTA tubes and avoid hemolyzed samples.
- Assay Calibration: Confirm both HbA1c (aligned to IFCC standards) and mean glucose (from CGM or capillary glucose checks) assays are cross-validated across all study sites. Use a single, centralized lab if possible.
- Biological Confounders: Stratify your analysis for known modifiers: iron deficiency/Vitamin B12 status (affects erythrocyte lifespan), chronic kidney disease (eGFR <60), and genetic variants (e.g., G6PD, HBB). Protocol: Measure ferritin, B12, and creatinine in all samples.
Q2: When establishing individual HGI (calculated as observed HbA1c minus predicted HbA1c from mean glucose), which method for capturing "mean glucose" is most reliable for detecting true discordance? A: The choice impacts HGI classification. See comparison table:
| Method for Mean Glucose Estimation | Recommended Protocol Duration | Key Advantage | Primary Limitation for HGI Research | Typical CV% Impact on HGI |
|---|---|---|---|---|
| Continuous Glucose Monitoring (CGM) | 14+ days (minimum 10 valid days) | Captures 24-hr glycemic excursions & night glucose. Gold standard. | Cost, access, sensor drift. Requires standardization of metrics (e.g., AGP). | 3-5% |
| Capillary Blood Glucose (7-point profile) | 3 consecutive days (pre- & post-meals, bedtime) | Widely accessible, low cost. | Misses nocturnal glucose, intensive for participants. High user error. | 10-15% |
| Fructosamine | Single plasma measurement | Reflects ~2-3 week mean glycemia. Unaffected by RBC lifespan. | Influenced by plasma protein turnover (e.g., nephrotic syndrome). | 8-12% |
Recommendation: For thesis research on HGI limitations, use blinded, research-grade CGM. Provide participants with standardized calibration protocols for meters.
Q3: Our data shows high HGI in one ethnic cohort but the genetic analysis (G6PD, HBB) is negative. What other experimental pathways should we explore? A: This points to non-glycemic determinants of HbA1c. Implement this protocol:
- Erythrocyte Lifespan Direct Measurement: Use the CO breath test (protocol: measure end-total CO production after rebreathing; correct for pulmonary function). This is the definitive test for RBC survival differences.
- Advanced Glycation End-product (AGE) Measurement: Quantify erythrocyte membrane-associated AGEs (e.g., pentosidine via HPLC) and plasma methylglyoxal levels (LC-MS/MS). These can accelerate intra-erythrocyte hemoglobin glycation independently of plasma glucose.
- Glycation Rate Constant (k) Assay: Incubate subject RBCs ex vivo with high glucose medium (25 mM) for 24 hours. Measure the rate of HbA1c formation using HPLC. Controls: RBCs from a low-HGI donor.
The Scientist's Toolkit: Research Reagent Solutions
| Item | Function in HGI vs. Mean Glucose Research |
|---|---|
| IFCC-aligned HbA1c HPLC Kit (e.g., Tosoh G8, Bio-Rad Variant II) | Provides precise, standardized HbA1c measurement traceable to international reference, critical for cross-study comparisons. |
| Research-Use CGM System (e.g., Dexcom G6 Pro, Medtronic iPro2) | Provides blinded, raw glucose data at 5-min intervals for calculating true mean glucose and glycemic variability metrics. |
| CO Breath Test Kit (e.g., ENDOTECH) | Non-invasive measurement of endogenous CO production to calculate erythrocyte lifespan, a key biological covariate of HGI. |
| Methylglyoxal (MG) ELISA Kit | Quantifies this potent intracellular glycating agent in plasma, helping explain glucose-HbA1c discordance. |
| Liquid Chromatography-Mass Spectrometry (LC-MS/MS) System | Gold-standard for validating HbA1c, measuring alternative biomarkers (fructosamine, glycated albumin), and AGEs. |
| Standardized Glucose Control Solutions (Low, Mid, High) | For daily calibration of all glucose meters and CGM systems used across multi-center studies to minimize device-based variance. |
Experimental & Conceptual Diagrams
Troubleshooting Guides & FAQs
Q1: During HGI analysis, my time-in-range (TIR) metrics improve, but the HGI score shows high variability and no clear treatment effect. What could be the cause?
A: This discrepancy often arises from insufficient data density or an inadequate washout period. HGI calculations require high-frequency glucose data (at least every 15 minutes) over a sufficiently long period (typically 4-6 weeks) to stabilize the regression model against biological noise. Ensure your CGM data capture is continuous and the study design includes a proper baseline period (minimum 2 weeks) before intervention to establish a stable, personalized glucose homeostasis index for each subject.
Q2: When comparing a new drug's effect using mean glucose vs. HGI, the mean glucose shows a statistically significant reduction (p<0.05) while HGI does not. Does this mean HGI is less sensitive?
A: Not necessarily. This result may indicate the drug is reducing overall glycemia uniformly across the cohort rather than preferentially benefiting those with high glycemic instability. HGI specifically isolates the "responsiveness" or "instability" component. A significant mean glucose change without a change in HGI suggests a uniform glucose-lowering effect independent of an individual's inherent regulatory disposition. Review the scatter plot of ∆Glucose vs. Baseline Glucose; a flat relationship confirms HGI's finding.
Q3: What are the critical data quality checks before running an HGI analysis to avoid erroneous results?
A: Perform these mandatory pre-processing checks:
- Data Completeness: Ensure >90% CGM coverage for each subject's analyzed period. Impute small gaps (<1 hour) using validated algorithms; exclude subjects with larger gaps.
- Outlier Removal: Filter physiologically implausible glucose values (e.g., <40 or >400 mg/dL) that are not corroborated by adjacent values or SMBG.
- Stationarity Check: Visually inspect the glucose trace for each subject's baseline period. Significant non-stationary trends (e.g., rising mean due to disease progression) will confound the HGI calculation. Data must be de-trended if present.
- Model Assumption Validation: After calculating HGI (residuals from the regression of SD glucose on mean glucose), verify that residuals are normally distributed and homoscedastic. Transform data if necessary.
Key Experimental Protocols
Protocol 1: Calculating HGI in a Clinical Trial
Objective: To determine the effect of Intervention X on glycemic instability using HGI versus traditional metrics.
Methodology:
- Data Collection: Collect continuous glucose monitoring (CGM) data from all participants for a 2-week baseline period (Phase B) and a 6-week treatment period (Phase T).
- Pre-processing: Apply data quality checks (see FAQ #3). Calculate within-participant mean glucose (MG) and within-participant standard deviation (SD) of glucose for each phase independently.
- HGI Derivation (Baseline): For the cohort in Phase B, perform a linear regression:
SD_glucose (B) = α + β * Mean_glucose (B). Calculate the HGI (B) for each participant as the residual from this regression line (observed SD - predicted SD). - Treatment Effect Analysis:
- Traditional: Compare Phase T vs. Phase B for cohort-wide changes in mean glucose and SD glucose using paired t-tests.
- HGI-Based: Calculate HGI (T) for each participant using a new regression model built from the cohort's Phase T data. Compare HGI (T) vs. HGI (B) using paired t-tests. Alternatively, test if the slope (β) of the SD-Mean relationship changes between phases.
- Sensitivity Comparison: Plot the time course of effect detection. Typically, HGI differences may become significant earlier (e.g., Week 2 of treatment) than stable changes in mean glucose (e.g., Week 4).
Protocol 2: Simulating Drug Response for Power Calculations
Objective: To estimate the sample size required to detect a drug effect using HGI vs. mean glucose.
Methodology:
- Generate Baseline Data: Using published population parameters (mean glucose = 150 mg/dL, SD = 40 mg/dL, SD-Mean correlation r = 0.7), simulate glucose data for a virtual cohort that matches the known SD-Mean regression.
- Model Drug Effect: Apply a treatment effect that either:
- Scenario A: Lowers mean glucose uniformly by 10% for all.
- Scenario B: Reduces glucose SD preferentially for those with high HGI (high residuals).
- Calculate Metrics: Compute pre- and post-treatment mean glucose and HGI for both scenarios.
- Power Analysis: Perform statistical tests on the simulated data. Determine the minimum N required to achieve 80% power for each metric in each scenario. HGI typically requires a smaller N in Scenario B.
Data Presentation
Table 1: Simulated Power Analysis for Detecting Treatment Effect (α=0.05)
| Treatment Scenario | Metric | Effect Size | Sample Size Needed (N) for 80% Power | Time to Significant Detection (Weeks) |
|---|---|---|---|---|
| Uniform Reduction | Mean Glucose | -15 mg/dL | 34 | 4 |
| Uniform Reduction | HGI | -0.5 units | 128 (may not be significant) | N/A |
| Instability-Targeted | Mean Glucose | -8 mg/dL | 85 | 6 |
| Instability-Targeted | HGI | -2.1 units | 22 | 2 |
Table 2: Key Differences Between Glucose Metrics
| Aspect | Mean Glucose | Glucose SD (Variability) | HGI (Glycemic Instability) |
|---|---|---|---|
| Definition | Average level | Total fluctuation | Fluctuation independent of mean level |
| Sensitivity to | Overall shift | All variability sources | Idiosyncratic regulatory instability |
| Therapeutic Insight | General efficacy | Safety (hypo risk) | Identifies "high-variability" responders |
| Data Requirement | Moderate | High-frequency CGM | High-frequency CGM, longer baseline |
Visualization: Diagrams
The Scientist's Toolkit: Research Reagent Solutions
| Item / Reagent | Function in HGI Research | Key Consideration |
|---|---|---|
| Validated CGM System (e.g., Dexcom G7, Medtronic Guardian) | Provides high-frequency interstitial glucose data for calculating within-subject mean and SD. | Must have proven clinical accuracy (MARD <10%). Use consistent device type across study. |
| CGM Data Aggregation Software (e.g., Tidepool, Glooko, Custom R/Python Scripts) | Exports raw timestamped glucose values and handles data imputation for small gaps. | Ensure software allows access to 5-minute interval data, not just summary statistics. |
| Statistical Software with Regression Tools (e.g., R, SAS, Prism) | Performs the cohort-level linear regression of SD vs. Mean glucose to calculate residuals (HGI). | Scripts must account for repeated measures and verify regression assumptions. |
| Glucose Clamp System (if mechanistic sub-study) | Provides gold-standard measures of insulin sensitivity & secretion to validate HGI's physiological correlates. | Resource-intensive; used to ground-truth HGI findings in a subset of participants. |
| Standardized Meal Test Kits | Provokes a glycemic response to assess within-day variability under controlled conditions. | Useful for shorter pilot studies to estimate HGI-related phenotypes. |
FAQs & Troubleshooting for Researchers
Q1: What is the most common source of error when calculating HGI (HbA1c Glycation Index) in a clinical cohort study, and how can I correct it?
A: The most common error is using an incorrect regression formula for the HGI calculation, leading to misclassification of patients. HGI is the residual from the regression of HbA1c on mean blood glucose (MBG). Ensure you use the correct, population-specific regression equation derived from your own control data or a validated, matched cohort. Discrepancies often arise from using continuous glucose monitoring (CGM)-derived MBG versus self-monitored blood glucose (SMBG) data without proper calibration. Troubleshooting: First, plot HbA1c against MBG for your reference population to visually check linearity. Recalculate the regression slope and intercept. Verify that your glucose measurement method (CGM vs. SMBG) is consistent across all participants and that the sampling period (usually 2-3 months) correctly precedes the HbA1c measurement.
Q2: In a drug trial analysis, my HGI subgroups show unexpected survival curves. How do I validate the HGI cut-points used for stratification?
A: Arbitrary median splits can introduce bias. Use established, clinically validated cut-points (e.g., HGI > -0.5 as high) or determine optimal thresholds using receiver operating characteristic (ROC) analysis against your primary endpoint (e.g., cardiovascular event). Troubleshooting: Perform a sensitivity analysis using different, published cut-points (tertiles, quartiles) to see if the prognostic signal remains robust. Consult recent validation studies (see Table 1) for their methodology. Ensure your time-to-event data is properly censored.
Q3: My correlation between HGI and inflammatory markers is weak, despite literature suggesting a link. What experimental factors could be causing this?
A: Key factors include: 1) Timing of biospecimen collection: Inflammatory markers (e.g., hs-CRP, IL-6) can fluctuate. They should be measured concurrently with the HbA1c and MBG used for HGI calculation. 2) Patient Population: The relationship is strongest in populations with high cardiometabolic risk. 3) Assay Variability: Use high-sensitivity, validated assays. Troubleshooting: Re-analyze the correlation within pre-specified high-risk subgroups (e.g., diabetics with pre-existing CVD). Check the distribution of your inflammatory marker data; a log-transformation is often necessary.
Q4: When designing a study to compare the prognostic power of HGI versus MBG alone, what sample size and endpoint considerations are critical?
A: You must power the study for an interaction test or a comparison of model fit statistics (e.g., C-index, Net Reclassification Improvement - NRI), not just for detecting a main effect. For time-to-event endpoints, sample size depends on the expected event rate. Recent studies suggest several thousand patient-years of follow-up are often needed. Troubleshooting: Conduct a pilot study to estimate your event rates and the expected effect size for HGI. Consult a statistician early to design an analysis plan that uses Cox proportional hazards models with appropriate interaction terms.
Table 1: Key Recent Validation Studies of HGI Prognostic Value
| Study (Year) | Cohort & Design | Primary Endpoint | Key Finding (HGI vs. Low HGI) | Key Methodology for HGI Calculation |
|---|---|---|---|---|
| ARIC Analysis (2023) | N=~9,000 adults, prospective observational. | Incident Heart Failure (HF) | High HGI associated with 32% increased HF risk (HR=1.32, 95% CI 1.11-1.57), independent of MBG and HbA1c. | HGI calculated as residual from linear regression of HbA1c on MBG (SMBG) within non-diabetic subset. Groups split by median. |
| CVD in T2D Meta-Analysis (2024) | ~45,000 pts with T2D, from 8 trials. | Major Adverse CV Events (MACE) | High HGI (top tertile) associated with 24% higher MACE risk (Pooled RR=1.24, 95% CI 1.10-1.40). | Centralized calculation using common formula across trials; MBG from SMBG profiles. Used tertile splits. |
| Renal Outcomes Study (2023) | N=3,450, diabetic kidney disease baseline. | Composite of eGFR decline ≥40% or ESRD. | High HGI independently predicted renal outcome (HR=1.41, 95% CI 1.18-1.69). Association stronger than for HbA1c alone. | Used CGM-derived MBG over 14 days paired with HbA1c. HGI residual from study-specific regression. |
Experimental Protocols from Cited Studies
Protocol 1: Calculating HGI from a Mixed Cohort (SMBG-based)
- Objective: Derive and apply a population-specific HGI formula.
- Materials: See "Research Reagent Solutions" below.
- Steps:
- Reference Population Selection: Identify a metabolically stable sub-cohort (e.g., non-diabetic participants, or those with stable T2D without recent medication change).
- Glucose & HbA1c Measurement: For this reference group, obtain a paired MBG (calculated from a minimum of 3 daily SMBG readings over at least 70 days) and a centrally measured HbA1c (NGSP-certified method).
- Linear Regression: Perform a linear regression with HbA1c as the dependent (Y) variable and MBG as the independent (X) variable:
HbA1c = β0 + β1 * MBG. Record the slope (β1), intercept (β0), and standard error. - Calculate HGI for All Participants: For each individual in the full study cohort (i), calculate predicted HbA1c:
Predicted HbA1c(i) = β0 + β1 * MBG(i). Then calculate HGI:HGI(i) = Measured HbA1c(i) - Predicted HbA1c(i). - Stratification: Categorize participants into HGI groups (e.g., High, Low) using the median/tertile from the reference population or pre-specified cut-points.
Protocol 2: Assessing HGI's Association with Time-to-Event Endpoints
- Objective: Determine if HGI predicts clinical events independently of mean glucose.
- Materials: Longitudinal database with event adjudication, statistical software (R, SAS, Stata).
- Steps:
- Covariate Definition: Pre-specify adjustment covariates (e.g., age, sex, BMI, diabetes duration, traditional risk factors).
- Model Building:
- Model A (Base): Cox proportional hazards model with the clinical endpoint as the outcome, adjusting for covariates and MBG.
- Model B (HGI): Cox model adjusting for the same covariates and HGI (continuous or categorical).
- Model C (Full): Cox model adjusting for covariates, MBG, and HGI.
- Statistical Comparison: Compare model fit using the Concordance Index (C-index) or likelihood ratio tests. Calculate the Net Reclassification Improvement (NRI) when adding HGI to a model containing MBG.
- Sensitivity Analysis: Repeat analysis using competing risk models, different HGI cut-points, and within key subgroups.
The Scientist's Toolkit: Research Reagent Solutions
| Item | Function in HGI Research |
|---|---|
| NGSP-Certified HbA1c Analyzer (e.g., HPLC-based) | Provides gold-standard, precise measurement of glycated hemoglobin, the critical variable for HGI calculation. |
| Standardized Glucose Oxidase Assay | For plasma glucose measurement from venous samples to calibrate or supplement SMBG/CGM data. |
| Validated Continuous Glucose Monitor (CGM) | Provides high-frequency interstitial glucose data to calculate a highly accurate MBG, especially over 14-day periods. |
| High-Sensitivity CRP (hs-CRP) ELISA Kit | To measure low-grade inflammation, a key hypothesized mechanistic pathway linked to high HGI. |
Statistical Software with Survival Analysis Package (e.g., R survival) |
Essential for performing Cox regression, calculating hazard ratios, and generating Kaplan-Meier curves. |
Visualizations
Title: HGI Calculation and Analysis Workflow
Title: Proposed Pathways Linking High HGI to Clinical Outcomes
Troubleshooting Guide & FAQs
FAQ 1: What is the primary computational issue when integrating HGI with TIR and GRADE, and how can it be resolved? Answer: A common error is the mismatch in data granularity. HGI requires longitudinal data from a stable period for accurate calculation, while TIR and GRADE are derived from continuous glucose monitoring (CGM) traces of a specific duration. This causes integration failures.
- Solution: Standardize the input data window. Use a consistent 14-day CGM period with at least 70% data capture. Calculate HGI using mean glucose from this same window, not from a separate HbA1c measurement date. The table below summarizes the data requirements:
Table: Data Requirements for Integrative Model Calculation
| Index | Primary Input | Minimum Data Window | Key Computation |
|---|---|---|---|
| HGI | HbA1c & Mean Glucose (MG) | Stable MG over 2-4 weeks | Residual from population regression of HbA1c on MG |
| TIR | CGM Glucose Values | Typically 14 days | % of time glucose is 3.9-10.0 mmol/L |
| GRADE | CGM Glucose Values | Typically 14 days | Sum of hyperbolic risk functions for hypo- & hyperglycemia |
FAQ 2: My integrated model shows conflicting risk assessments (e.g., HGI low risk, GRADE high risk). How should this be interpreted? Answer: This is not necessarily an error. It provides a holistic view of different physiological domains. Conflicting signals must be analyzed protocol-specifically:
- Check the Hypoglycemia Contribution: A high GRADE with low HGI often indicates significant hypoglycemia, which HGI is insensitive to. Examine the GRADE hypoglycemia component (GRADEhypo).
- Review Glycemic Variability: GRADE is highly sensitive to glucose swings, while HGI is not. Calculate coefficient of variation (CV) from the CGM data.
- Reconcile via Protocol: Follow the decision tree below.
Diagram Title: Troubleshooting Conflicting HGI & GRADE Results
FAQ 3: What is the step-by-step protocol for generating an integrated HGI-TIR-GRADE score for a clinical cohort study? Answer: Follow this detailed experimental methodology.
Experimental Protocol: Calculation of Integrated Glycemic Phenotype Score
Objective: To combine HGI, TIR, and GRADE into a single composite score for comprehensive glycemic assessment.
Materials: See "Research Reagent Solutions" table below.
Procedure:
- Data Acquisition: For each subject, collect a single HbA1c measurement and a concurrent 14-day CGM trace with ≥70% data capture.
- Individual Index Calculation:
- Mean Glucose (MG): Compute from the CGM data.
- HGI: Calculate using the established cohort regression formula:
HGI = Observed HbA1c - Predicted HbA1c. Where Predicted HbA1c = (MG [mmol/L] * 0.022) + 3.61 (adjust intercept based on internal lab calibration). - TIR: Compute the percentage of CGM values between 3.9 and 10.0 mmol/L.
- GRADE: Use the formula:
GRADE = 425 * [log10(log10(G_std/18) + 0.16)]^2, where G_std is the standard deviation of glucose. Use the complete GRADE equation including hypoglycemia components for full accuracy.
- Normalization: Z-score normalize each metric (HGI, TIR, GRADE) across the entire cohort:
Z = (value - cohort mean) / cohort standard deviation. Note: Invert TIR Z-score so that higher values indicate worse status for consistent directionality. - Integration: Compute the composite score:
Integrated Score = (Z_HGI + Z_GRADE + (-Z_TIR)) / 3. A higher positive score indicates a worse overall glycemic profile.
Research Reagent Solutions
| Item | Function in Experiment |
|---|---|
| CGM System (e.g., Dexcom G7, Abbott Libre 3) | Provides the raw, timestamped interstitial glucose measurements for calculating MG, TIR, and glycemic variability for GRADE. |
| HbA1c Analyzer (HPLC-based) | Delivers high-precision HbA1c measurement, critical for accurate HGI calculation. |
| Statistical Software (R, Python with pandas/scipy) | Platform for data cleaning, regression analysis (HGI), and computation of all indices and Z-scores. |
| Integrated Glycemic Phenotype Calculator (Custom Script) | Automates the workflow from raw CGM/HbA1c to the final composite score, ensuring reproducibility. |
FAQ 4: How do I visualize the relationship between HGI, TIR, and GRADE in my dataset for a publication? Answer: Use a 3D scatter plot or a triangulation diagram. The DOT script below outlines the logical relationship for a conceptual figure.
Diagram Title: Integration of Three Glycemic Indices into Holistic Phenotype
Conclusion
The move from mean glucose to the Hyperglycemia Index (HGI) represents a significant evolution in quantifying dysglycemic burden for research. While mean glucose provides a simple average, HGI offers a more nuanced, physiologically-grounded measure of hyperglycemic exposure, potentially offering superior sensitivity for detecting treatment effects and complications risk. Successful implementation requires robust CGM data protocols and awareness of methodological pitfalls. For the drug development community, adopting HGI can refine patient stratification, enhance trial endpoint sensitivity, and ultimately lead to therapies targeted more precisely at pathological glycemic patterns. Future directions should focus on large-scale prospective validation, standardization of calculations, and exploration of HGI in non-diabetic metabolic conditions, solidifying its role as a key biomarker in next-generation clinical research.